Translating an Expansive Cycle into Value - 29 June 2021
←
→
Page content transcription
If your browser does not render page correctly, please read the page content below
Translating an Expansive
                        Cycle into Value
                                Strategic Update

29 June 2021
                                                   1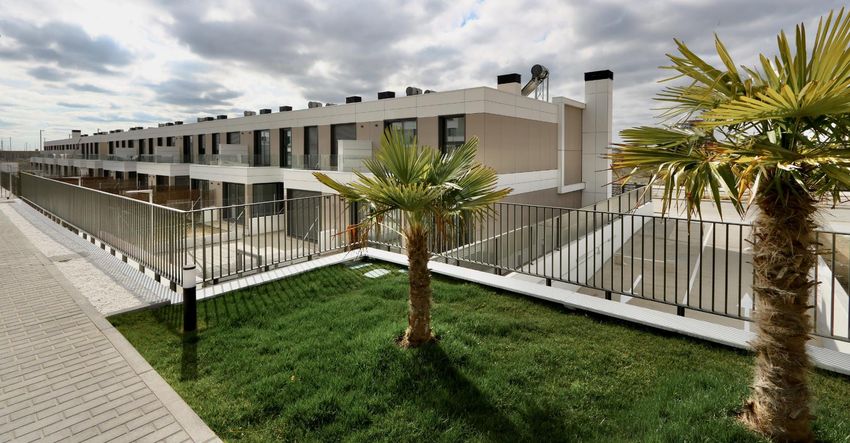
Disclaimer
By attending this presentation and/or by accepting this presentation you will be taken to have represented, warranted and undertaken that you have read and agree to comply with the contents of this disclaimer. This presentation
(the “Presentation”) has been prepared by AEDAS Homes, S.A. (“Aedas” or the “Company”) and comprises slides for a corporate presentation to the market of the Company and its subsidiaries (the “Group”).

For the purposes of this disclaimer, “Presentation” means this document, its contents or any part of it. This Presentation may not be copied, distributed, reproduced or passed on, directly or indirectly, in whole or in part, or
disclosed by any recipient to any other person, for any purpose other than the aforementioned. This Presentation has not been independently verified and will not be updated.

No representation, warranty or undertaking, express or implied, is made as to, and no reliance should be placed on, the fairness, accuracy, completeness or correctness of the information or opinions contained herein and nothing in
this Presentation is, or shall be relied upon as, a promise or representation.

None of the Company nor any of its employees, officers, directors, advisers, representatives, agents or affiliates shall have any liability whatsoever (in negligence or otherwise, whether direct or indirect, in contract, tort or
otherwise) for any loss howsoever arising from any use of this Presentation or its contents or otherwise arising in connection with this Presentation.

This Presentation is for informational purposes only and is incomplete without reference to, and should be viewed solely in conjunction with, the Company’s publicly available information and, if applicable, the oral briefing provided
by the Company. The information and opinions contained in this Presentation are provided as at the date of the Presentation and are subject to verification, correction, completion and change without notice. In giving this
Presentation, no obligation is undertaken to amend, correct or update this Presentation or to provide access to any additional information that may arise in connection with it is undertaken.

Likewise, it is not the intention to provide, and you may not rely on these materials as providing, a complete or comprehensive analysis of the Company’s financial or trading position or prospects.

This Presentation does not constitute investment, legal, accounting, regulatory, taxation or other advice and does not take into account your investment objectives or legal, accounting, regulatory, taxation or financial situation or
particular needs. You are solely responsible for forming your own opinions and conclusions on such matters and for making your own independent assessment of the Company and the Group. You are solely responsible for seeking
independent professional advice in relation to the Company and the Group. No responsibility or liability is accepted by any person for any of the information or for any action taken by you or any of your officers, employees, agents
or associates based on such information.

This Presentation contains financial information regarding the businesses and assets of the Company and the Group. Such financial information may not have been audited, reviewed or verified by any independent accounting firm.
The inclusion of such financial information in this Presentation or any related presentation should not be regarded as a representation or warranty by the Company, its affiliates, advisors or representatives or any other person as to
the accuracy or completeness of such information’s portrayal of the financial condition or results of operations by the Company and the Group and should not be relied upon when making an investment decision. Certain financial
and statistical information in this document has been subject to rounding off adjustments. Accordingly, the sum of certain data may not conform to the expressed total.

Certain statements in this Presentation may be forward-looking. By their nature, forward-looking statements involve a number of risks, uncertainties and assumptions which could cause actual results or events to differ materially
from those expressed or implied by the forward-looking statements. These include, among other factors, changing economic, business or other market conditions, changing political conditions and the prospects for growth
anticipated by the Company’s management. Also, the COVID-19 (Coronavirus) pandemic is an ongoing, rapidly developing situation. The Company is following the state and local health and safety guidance and government
mandates, but, as there is yet much to learn about COVID-19, please be advised that the consequences of said pandemic could cause actual results or events to differ materially from those expressed or implied by the forward-
looking statements. These and other factors could adversely affect the outcome and financial effects of the plans and events described herein. Any forward-looking statements contained in this Presentation and based upon past
trends or activities should not be taken as a representation that such trends or activities will continue in the future. The Company does not undertake any obligation to update or revise any forward-looking statements, whether as
a result of new information, future events or otherwise. No undue reliance should be placed in such forward-looking statements. The market and industry data and forecasts that may be included in this Presentation were obtained
from internal surveys, estimates, experts and studies, where appropriate as well as external market research, publicly available information and industry publications. The Company, its affiliates, directors, officers, advisors and
employees have not independently verified the accuracy of any such market and industry data and forecasts and make no representations or warranties in relation thereto. Such data and forecasts are included herein for
informational purposes only. Accordingly, undue reliance should not be placed on any of the industry or market data contained in this Presentation.

The distribution of this Presentation in other jurisdictions may be restricted by law and persons into whose possession this presentation comes should inform themselves about and observe any such restrictions.

Neither this document nor any of the information contained herein constitutes or forms part of, and should not be construed as, an offer of purchase, sale or exchange, nor a request for an offer of purchase, sale or exchange of
securities, or any advice or recommendation with respect to such securities of the Company in any jurisdiction, nor shall it or any part of it nor the fact of its distribution form the basis of, or be relied on in connection with, any
contract or investment decision. Any purchase of or subscription for securities of the Company should be based solely on each investor’s own analysis of all public information, the assessment of risk involved and its own
determination of the suitability of any such investment. No reliance should be placed, and no decision should be based on this Presentation.

                                                                                                                                                                                                                                             2
Today’s Presenters

     David Martínez           Alberto Delgado   Sergio Gálvez        María José Leal
     Chief Executive          Chief Operating   Chief Strategy &     Chief Financial
     Officer                  Officer           Investment Officer   Officer

Source: Company Information
                                                                                       3
Today’s Agenda
Section                                                              Speaker           Page

          Looking ahead and building on our foundations:
  01      5-year revised Business Plan
                                                                     David Martínez     5

 02       Operationally ready to seize the opportunity               Alberto Delgado    15

 03       Disciplined acceleration of our land investment strategy   Sergio Gálvez      21

 04       Shareholder value creation at the forefront of our goals   María José Leal   28

 05       Key takeaways and medium-term objectives                   David Martínez    33

                                                                                              4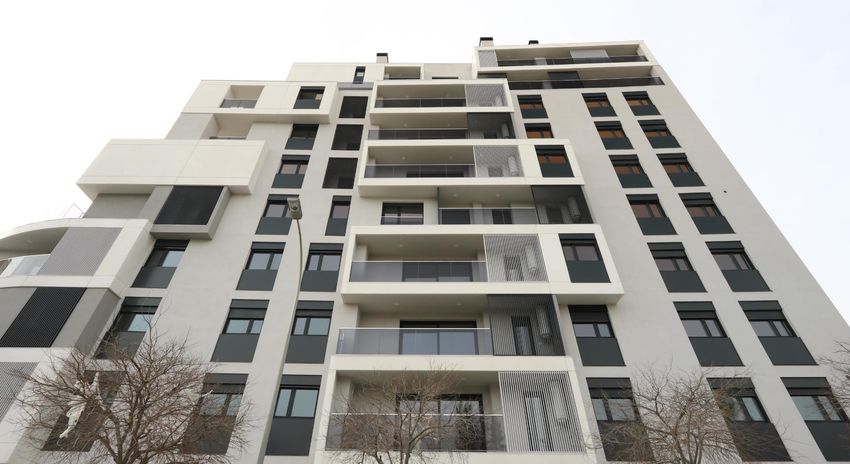
Eliza
                                                    Alicante

01 Looking ahead and building on our foundations:
   5-year revised Business Plan                         5
Operational Ramp-up Phase Completed:
Targets Delivered

   Largest listed homebuilder in Spain

   c. 2,000 deliveries achieved in FY2020

   Replenished best-in-class c.€2bn land bank located in the most attractive regions in Spain

   Robust capital structure: 12% LTV1, highest-quality credit rating in the Spanish homebuilding
   industry (B+ / BB- / Ba2), diversified portfolio of sources of funding

   Business conducted under shareholder value creation principles and financial discipline, to
   sustainably attain AEDAS goal of €250m+ EBITDA (20%+ margin) and ROE around 15%

   Pure-play homebuilder strategy
 Source: Company Information
 Note: FY2020E ended in March 2021
 (1) Pro-Forma for €325m Bond Issuance                                                             6

Looking Ahead: Spanish Homebuilding Tailwinds
   Supporting AEDAS Homes Opportunity

          Favourable housing markets prospects fuelled by a positive forthcoming economic scenario
          coupled with unprecedented savings levels

          Expanding demand for new-build housing supported by strong affordability metrics and
          benign financing conditions

          Imbalance between growing demand for new-build homes and limited supply will drive
          pricing power, margin expansion and top-line growth

          The AEDAS product is at the sweet spot of customer demand

          Pandemic impact on small landowners has dynamised the land market

Source: Company Information

                                                                                                     7
Favourable Housing Market Prospects in Spain, Fuelled by
   Economic Recovery and Extraordinary Household Savings
   Spanish Real GDP and Inflation Expected Evolution (%)                                         Spanish Families’ Savings (as % of Gross Disp. Income)1

                                                                                                                                           14.8%
                                                                         1.9%    1.2%    1.2%

                                                                         6.2%    5.8%                                                              11.0%
         3.8%
                    3.0%      3.0%
                                         2.4%         2.0%                               1.8%
                                                                                                                                                           8.0%    8.2%
                                                                                                    7.2%   7.1%
                                                                                                                                   6.3%
                                                                                                                   5.8%    5.6%

                                                               (10.8)%
        2015A      2016A      2017A      2018A       2019A      2020A    2021E   2022E   2023E
                                                                                                   2015A   2016A   2017A   2018A   2019A   2020A   2021E   2022E   2023E
                                                 Expected Inlfation

              The Spanish economy is ready for take-off                                               Spanish households hit record savings levels

Source: INE, Banco de España
(1) Banco de España Base Case Scenario
                                                                                                                                                                           8
Strong Affordability Metrics and Attractive Financing Conditions
Supporting Demand for New Housing Product
Financial Effort to Buy vs. Rent (as % of Disp. Income)1                                                   Historical Housing Mortgages Average Interest Rate2

35%                                                                                             34%         5.0%

                                                                                                            4.0%
30%

                                                                                                25%         3.0%
                                                                                                                        Global Financial Crisis
25%

                                                                                                            2.0%
                                                                                                                                                                                       COVID-19
20%                                                                                                                                                                                     Period
                                                                                                            1.0%

15%
      1Q13 3Q13 1Q14 3Q14 1Q15 3Q15 1Q16 3Q16 1Q17 3Q17 1Q18 3Q18 1Q19                                        -%
                                                                                                                01/10       03/11   06/12   09/13   12/14   03/16   06/17   09/18   12/19   03/21
                         Financial Effort to Buy                 Financial Effort to Rent

                  Affordability at its highest in years                                                                       Unprecedented financing conditions

Source: Company Information, Idealista (publicly disclosed data), INE
(1) % of annual disposable income per household required on average to finance a house mortgage vs. house rental in Spain
(2) Monthly average of annual mortgage interest rates from INE database                                                                                                                             9
Attractive Homebuilding Cycle Ahead with an Imbalance Between
       Growing New Housing Demand and Limited New Supply
        Spanish Population and Households Growth                                                                                    New-Build Housing Transactions in Spain (000’s Units)
                                                                                                                                    180
                 22                                                                                           50

                                                                                                                                    160
                 21                                                                                           48
                                                                                                                                    140

                                                                                          +388k New
                                                                                                                                    120
Households (m)

                 20                                                                                           46

                                                                                                                   Population (m)
                                                                   +294k New              Households
                                             +364k New             Households
                                             Households                                                                             100
                 19      +808k New                                                                            44
                         Households                                                                                                  80

                 18                                                                                           42                     60                                             L5Y Average: 48

                                                                                                                                     40
                 17                                                                                           40
                                                                                                                                     20
                 16                                                                                           38
                      2010   2012     2014   2016    2018   2020     2022      2024      2026   2028   2030                           -
                                                                                                                                          2010   2011   2012   2013   2014   2015   2016   2017   2018   2019   2020

                                               Households                   Population

                                                    Striking imbalance between demand and supply of new-build housing

        Source: Company Information, INE, Ministerio de Fomento (Vivienda Libre Nueva)

                                                                                                                                                                                                                       10
Early Evidence of HPI Acceleration
House Price Index Growth (%) Homebuyers’ New Preferences
15% Modern Design
10%
Slightly larger apartments / houses
5%
-% Open and well laid-out spaces
(5)%
Prime locations close to cities (ex-city center)
New-build homes
(10)%
prices trending
upwards Surrounded by green urban parks
(15)%
(20)% Purely residential areas
1Q10 4Q10 3Q11 2Q12 1Q13 4Q13 3Q14 2Q15 1Q16 4Q16 3Q17 2Q18 1Q19 4Q19 3Q20
Pricing power being recovered AEDAS is at the sweet spot in customer demand
Source: INE, Banco de España
11AEDAS: Uniquely Positioned to Capture The Opportunity
1 Largest listed pure-play homebuilder in Spain by market cap and leading player in terms of LTM
deliveries
Strategically
Best-in-class c.€2bn fully-permitted land bank deliberately located in Spain’s most dynamic
regions (expected to concentrate c. 60% of new-build home demand by 2030)
2 Operational ramp-up complete and platform now operating at levels consistent with run-rate
Operationally targets of 3,000-3,700 deliveries per annum
Consistently selling over 250 units per month and sustaining a stock of c.10,000 active units
3 Proven disciplined investment approach with €500m+ land acquisitions since January 2017
Access to
Pipeline of c.€800m supports acceleration of investment budget targeting €200-300m of
Land
acquisitions in the next 12 months
4 Conservative capital structure with a 12% LTV and best credit rating (B+ / BB- / Ba2)1 in the
Financially Spanish industry
Ample liquidity of €310m+ and long-term maturities following recent bond issuance
Source: Company Information
(1) S&P, Fitch and Moody’s 12A New 5 Year Business Plan with More Ambitious Goals Governed
by Financial Performance and Shareholder Remuneration
FY 2022E / 2023E FY 2024E / 2025E
FY 2021E
(per annum) (per annum)
Revenue €750m+ ~€1,000m / year ~€1,400-1,500m / year
EBITDA €140m+ €190-200m / year €300-350m / year
(Margin) (~20%) (~20%) (21-23%)
Implied ROE 8-10% ~12% ~18%
Dividends 50% pay-out1 + potential extraordinary dividend up to 20% LTV
Source: Company Information
Note: FY2021E ended in March 2022, idem for FY2022-25E
(1) Computed on prior year net income
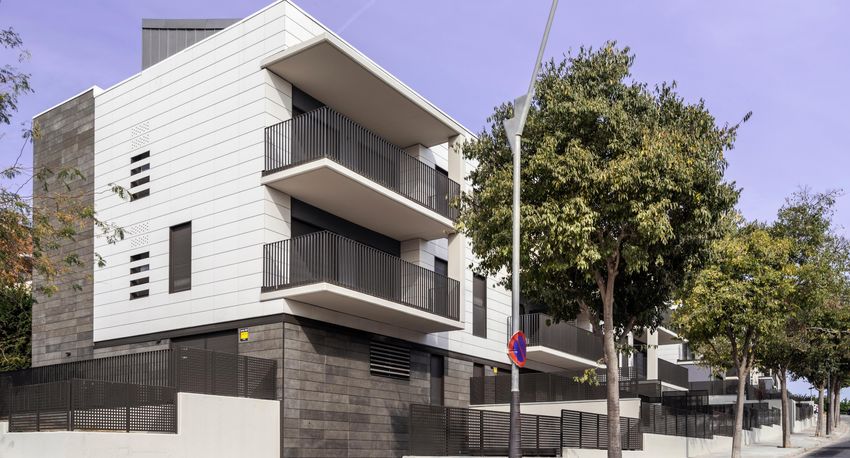
13Bremond Son Moix
Palma de Mallorca
02 Operationally ready to seize the opportunity
14Differentiated Scalable Operating Model with a Winning Decentralized
Strategy
One Strategy, Decentralized Execution AEDAS Presence
Headquarters: 124 FTEs
Chief Operating Officer Catalonia &
Regional Branches North Zaragoza
4 FTEs 24 FTEs
Andalusia
Catalonia East & Costa del
Madrid & Canary North
& Zaragoza Mallorca Sol
Islands
Madrid
28 FTEs1
Sales and
Marketing Pricing and Sales Channels
Core Central Teams
Andalusia &
Canary
Islands
Operations Design and Construction Efficiency 23 FTEs
East &
Mallorca
24 FTEs
Product
Quality
Product Quality Control
Costa del Sol
20 FTEs
6 regional branches supported by 3 core teams at headquarters
Source: Company Information
(1) FTEs corresponding to Centre regional branch only, excluding core central teams FTEs located in Madrid headquarters 15Relentless Focus on Profitability with Multiple Levers to Maximize
Margins and ROE Sustainability across the Development Cycle (1/2)
Year 1 Year 2 Year 3 Levers to Maximize Margins
1
Land 1
Investment Deep knowledge of local land markets and off-
market sourcing capabilities across Spain
2
Product Definition 6-7
and Design Months 2 Established framework ensuring product quality
and feasibility, with a high degree of
3
Permitting 6-9 Months standardisation and a clear focus on ESG
Excellence
4 Shift towards bilateral processes with proven
Marketing and Sales 24-36 Months
architects and contractors
5 3
ESG fully compliant operations backed by
Procurement Months Company’s well-established “Green Book”
6 3 Long-standing relationships with local
Construction 18-21 Months
administrations, optimizing timings and resources
2-3
27-33 Months Months Please refer to next page for stages (4),
4 5 and (5)
6
Delivery
Source: Company Information
16Relentless Focus on Profitability with Multiple Levers to Maximize
Margins and ROE Sustainability across the Development Cycle (2/2)
Year 1 Year 2 Year 3 Levers to Maximize Margins
1
Land 4
Investment Strong digital strategy, capillarity of sales points
2 Full control on pricing strategy, not conditioned by
Product Definition 6-7
and Design Months financing constraints
Premium pricing leveraging on brand awareness
3
Permitting 6-9 Months
5
Well-defined turnkey contracts hedging supplies
4
Marketing and Sales 24-36 Months cost increases and protecting AEDAS’ margins
Close, sticky relationships with top tier contractors
5 3
Procurement given high recurring volumes and product quality
Months
6 6
Construction 18-21 Months Leveraging on quality, factory-build components
and offsite construction (25% of deliveries by 2023)
2-3
27-33 Months Months
Delivery
Source: Company Information
17Limited Impact of Hard Costs on Net Development Margin
Focus on Cost of Goods Sold Focus on Hard Costs Increasing Raw
Materials Costs by…
100% ~45%
Net Development Contractor Margin
+ Other Indirect
+4.0%
Margin
Costs
Marketing and Com.
Financial Costs1
Soft Costs
Workforce …translates into a needed
Sales Price increase of…
Hard Costs
~1.0%
Raw Materials
Land
…to maintain AEDAS’
Standard Development Standard Development Net Development
Denotes % of Standard Development Sale Value Margin
A 4.0% increase in Raw Materials Costs would be fully offset by just an increase of ~1.0% of HPA
Denotes % of Development ASP
Source: Company Information
(1) Activated Financial Costs
18Scaled-up Platform with a Winning Business Model Already
Operating Consistently with Company’s Run-Rate Target
Active1 Units Evolution (units)
Proven Track Record
9,550 9,710
Run-rate Active 8,765 AEDAS is already
Units level2 9,000 operating at run-rate
7055
levels with 9,700+ Accumulated
units active1 as of 3,400+ units
May 2021 already delivered as of
FY 2018 FY 2019 2020 Int. (Mar-20) YTD (May-21)
May 2021A, in line
2021 Monthly Net Sales Evolution (units)
with deliveries target
Monthly Sales Run-rate
253
274 272 AEDAS currently communicated at IPO
215 selling more than
Target: 250 units for the same period
149 270 units on a
monthly basis
consistent with
annual target of
Jan-21A Feb-21A Mar-21A Apr-21A May-21A 3,200+ units / year
Source: Company Information. Note: FY2018 and FY19 ended December 2018/19
(1) Refers to AEDAS land bank units that are already under some of the active development phases (in design, on the market, under construction or completed pending delivery)
(2) Computed taking into account a 30 months development period after land acquisition and a run-rate target of 3,000 deliveries per year 19Cook
L'Hospitalet de Llobregat
Barcelona
03 Disciplined acceleration of our land investment strategy
20The Opportunity – Robust and Growing Residential Product
Demand in AEDAS’ Core Locations Paving the Way for a New Cycle
Population and Residential Demand Concentrated in Key Takeaways
AEDAS Footprint 1 Investment strategy validated by the expected demand
North of new-build houses across 2021-30E in Company’s
Spain
2,3k 4% 2k Catalonia &
60,4k 100% 107k
Zaragoza footprint
3,7k 7% 11k
2
Land bank concentration in areas of strong structural
Madrid demand provides visibility over BP and a privileged
10,6k
11% 21k positioned to source new land in those locations
East & Mallorca 3
3,2k 5% 12k Significant imbalance between a strong expected
Andalusia &
Canary Islands demand for new-build housing and the supply of land
2,8k 4% 10k available, to elevate land prices from 2022 onwards
Costa del Sol
Total new-build houses transactions 2020A
2,5k 2% 5k
% of population
Average yearly demand of new-build houses
(2021-30)
80 municipalities, where AEDAS has a strong presence, will The next 12-18 months will be a unique investment
concentrate c.60% of the new-build house demand by 2030 window for AEDAS, operationally and financially ready
Sources: INE, JLL, Tinsa, MITMA and Company internal Analysis
21The Opportunity – Limited Competition for Land Providing a Unique
Opportunity to Secure High-Quality Assets at Attractive Prices
Category Considerations
National Limited appetite for land in the medium-term, given sizeable land
Players banks either legacy or as a result of recent large-scale acquisitions
High number of competitors shifting towards PRS strategies,
Mid-sized
devoting most of their resources to the development and
Regional Players
management of rental portfolios
More strict financing requirements hindering access to land and
Small Local
leading to reduced investment volumes and forcing disposal of land
Players
plots and WIP
Source: Company Information
22The Opportunity – Quality Assets Expected to Come to Market in
the Next 12-18 Months
Institutional Land Owners with Increased Relevant Number of Strategic Land Plots Soon to Become RTB
Pressure to Wind-Down Portfolios and Come to Market
2016-2017 2021-2022
Increased pressure to Acquisition of
liquidate significant parts of Strategic Land
their land portfolios to
Conversion to Fully
c.5-6 years period
offset business plan delays Permitted Land
caused by COVID-19
Fully Permitted Land
Bank Sale
Large land packages
expected to come to Meaningful number of land plots undergoing transformation
in the last 4-5 years soon to become ready-to-build and
market at attractive prices
come to market
Source: Company Information
23AEDAS Disciplined and Focused Investment Approach As a
Guarantee of Future Land Bank Quality
Supporting Pillars of AEDAS’ Land Acquisition Strategy Land Bank Footprint1
100% Cherry-picked portfolio, plot by plot (96% of deals proactively sourced
off-market, rarely engaging in competitive processes)
Focused on best locations within the 6 AEDAS’ regions: portfolio consistent with
housing demand, with a strong weight of the Madrid area (39% of 2020/21 investment)
100% residential fully permitted land and 92% ready to build, for mid to mid-high
segment as primary residences (92% of 2020/21 investments) which has allowed 66% of
last 4 years investments2 to be already active and /or delivered
Robust economic returns on worst case scenarios and significant room for upside:
since IPO, all the land invested has a minimum 20% target net development margin
Hybrid sourcing approach: (i) self-sourced deals and (ii) REOs and NPLs acquisitions < 500 Units
(20%+ of historical closed deals) 500 < x < 1,000 Units
1,000 < x < 2,000 Units
Comprehensive and speedy due diligence process, led in-house, taking on average 8
2,000 < x < 2,500 Units
weeks, which allows AEDAS team to close 1 deal by public deed every 10 days
> 2,500 Units
Land Sourced According to Strict Profitability and Demand-driven Criteria
Source: Company Information
(1) Units as of May-21A; (2) Land investments from Jan-17 to Mar-21A
24AEDAS’ Proven Sourcing and Investment Platform is Uniquely
Positioned to Seize the Opportunity
Sound and Unparalleled Investment KPIs… …Backing Land Bank Replenishment (Land Bank Evolution
in thousand units)
1,000+ 15.5 15.5
14.9
transactions analysed per year
12.9
10.6
€125m+
investment in land per year1
5.7
66% 1.2
% of land invested since 2017
now active2 FY2014 FY2015 FY2016 FY2017 FY2018 FY2019
3
FY2020
Source: Company Information
Note: FY2014 to FY2018 ended December 2014-2018. FY2019 and FY2020 ended March 2020/2021
(1) Average yearly investment in land since Dec-2017; (2) Includes active and completed units (as of FY2020) bought since Jan-2017;
(3) Financial reporting year end changed from December to March
25Well-identified and Partially Secured Pipeline to Reach AEDAS’
Land Investment Targets in the Coming Years
Pipeline by Status Pipeline by Region Next 12 months Guidance
1 3%
Binding deals,
pending signing
~5 deals 7%
€200-
300m Land
13%
~€60m
€0.8bn
47%
Investments (vs. €132m in
2
Non-binding offer ~30 deals the last year)
accepted, under 15%
exclusive Due
Diligence ~€140m
c.3.1k-3.3k
15%
3
~70 deals Madrid Andalusia & Canary Islands units of land bank
Potential Transactions
in preliminary stages East & Mallorca Catalonia & Zaragoza
replenished (vs. 4.0k units
~€600m in the last 2 years)
North Costa del Sol
Source: Company Information
26Orpi
El Masnou, Barcelona
04 Shareholder value creation at the forefront of our goals
27A Strong Balance Sheet Ready to Support a Larger Investment
Budget
Key Financial Highlights AEDAS Capital Structure as of FY2020 PF for Bond
Unparalleled financial track-record
meeting all its IPO targets 12.1 % 16.5 % 4.6 years B+/BB-/Ba2
Significantly de-levered Capital
Structure leaving room for further
Avg. Corporate
Net LTV Net LTC Corporate Rating
investments and growth of operations
Debt Maturity (S&P / Fitch / Moody’s)
Robust financial muscle and firepower
on the back of latest Corporate debt
Issuance and diversifying financing € 542 m € 230 m € 312 m
sources
Highest-quality rating (B+ / BB- / Ba2)1
Gross Debt Net Debt Available Cash
within the Spanish Homebuilding Sector
Source: Company Information
(1) S&P / Fitch / Moody’s
Note: Net Debt defined as Total Gross Debt - Available Cash; FY2020A ended in 31-Mar-2021 28A New Business Plan with More Ambitious Goals and Stronger
Focus on Financial Performance and Shareholder Remuneration
FY 2022E / 2023E FY 2024E / 2025E
FY 2021E (per annum) (per annum)
Revenue €750m+ ~€1,000m ~€1,400-1,500m
EBITDA €140m+ €190-200m €300-350m
(Margin) (~20%) (~20%) (21-23%)
Net Income €90m+ €130-140m €210-250m
Implied ROE 8-10% ~12% ~18%
Dividends 50% pay-out1 + potential extraordinary dividend of up to 20% LTV
Source: Company Information
Note: FY2021E ended in March 2022, idem for FY2022-25E
(1) Computed on prior year net income
29Limited Exposure to Construction Costs Inflation, to be Successfully
Offset by the Expected HPA Evolution across the Next 5 years
Cost Structure Inflation Scenario Estimated Impact
Standard Development Cost Breakdown Compound HPA / CCI in FY2025E vs. FY2020A
4.2% 3.9%
100% of Standard
Development Sale Value 22.7% AEDAS Gross
21.0%
Net Development Margin Margin to
Marketing and Sales
Financial Costs
Soft Costs
increase
Hard Costs
+140bps
~45% (CCI Only
(Construction Costs)
Impacting to
Hard Costs)
per annum
on average
Land (FY2021-25E)
Standard CCI HPA
Development
Denotes FY2021-25E CAGR
Source: Company Information
Note: FY2020A ended in March 2021, idem for FY2021-2025 30AEDAS’ Targets Substantially Above Research Consensus
EBITDA and EBITDA Margin (€m, %)
~20% ~20% ~20% ~18% 21-23% 18-19%
€300-350m
€190-200m
€170-180m
~€140m €150-160m
€136m
FY 2021 FY 2022/23 FY 2024/25
AEDAS Business Plan Targets Guidance (range midpoint) Broker Consensus Median as of Jun-2021 Denotes EBITDA margin (%)
Source: Company Information, Broker Consensus as of Jun-2021 from Bloomberg
Note: FY 2021E ending in 31-Mar-2022, idem for FY 2022-2025
31Significant Valuation Upside Based on Current Trading
Levels and AEDAS De-risked New Business Plan
Current AEDAS Market Valuation in Context
EV / EBITDA P/E Dividend Yield
Discount to NAV
FY2022E FY2022E @ 50% NI FY2022E
(32)% 6x 8x 6%
EV / EBITDA P/E Dividend Yield
Price to BV
FY2025E FY2025E @ 50% NI FY2025E
1.0x 3x 4x 13%
Source: Company Information, Market data as of 23-Jun-2021
Note: FY2022E ending in 31-Mar-2023, FY2023E ending in 31-Mar-2024, FY2024E ending in 31-Mar-2025, FY2025E ending in 31-Mar-2026 32Etheria (Offsite development)
El Cañaveral
Madrid
05 Key takeaways and medium-term objectives
33Key Takeaways and Medium-Term Objectives
I1 The Spanish homebuilding industry is on the cusp of an expansion cycle, driven by the post-Covid
economic recovery and structural imbalance between supply and demand
II1
This new cycle will offer an unprecedented opportunity to create more value for shareholders
III1
AEDAS Homes is operationally and financially ready to scale up and capture this opportunity
IV1 Fully ramped up platform positioned in the right locations; proven land sourcing capabilities to capture
investments opportunities identified in pipeline
V1
Strong financial foundation and ample firepower
VI1 Ambitious new 5-year Business Plan, with the goal of taking AEDAS Homes to up to €1.5bn in revenue
and up to €300-350m in EBITDA by FY 2025
Source: Company Information
Note: FY 2025 ending in 31-Mar-2026 34“Translating an Expansive Cycle into Value”
Q&A Session
35You can also read