Treasure Mapped: Using Satellite Imagery to Track the Developmental Effects of Somali Piracy
←
→
Page content transcription
If your browser does not render page correctly, please read the page content below
Africa Programme Paper: AFP PP 2012/01

Treasure Mapped: Using Satellite
Imagery to Track the Developmental
Effects of Somali Piracy
Dr Anja Shortland

Brunel University

January 2012

The views expressed in this document are the sole responsibility of the author(s) and do not
necessarily reflect the view of Chatham House, its staff, associates or Council. Chatham House
is independent and owes no allegiance to any government or to any political body. It does not
take institutional positions on policy issues. This document is issued on the understanding that if
any extract is used, the author(s)/ speaker(s) and Chatham House should be credited,
preferably with the date of the publication or details of the event. Where this document refers to
or reports statements made by speakers at an event every effort has been made to provide a fair
representation of their views and opinions, but the ultimate responsibility for accuracy lies with
this document’s author(s). The published text of speeches and presentations may differ from
delivery.
Programme Paper: Treasure Mapped

SUMMARY POINTS

There are increasing pressures to develop land-based approaches to Somali piracy. By making
use of non-traditional data sources including local market data and satellite images, this paper is
intended to be an objective analysis of who benefits from pirate ransoms.
Significant amounts of ransom monies are spent within Somalia, but conspicuous consumption
appears to be limited by social norms dictating resource-sharing. Around a third of pirate ransoms
are converted into Somali shillings, benefiting casual labour and pastoralists in Puntland.
Data analysis is complemented by examination of satellite imagery to establish where the
beneficiaries are located. Pirates probably make a significant contribution to economic
development in the provincial capitals Garowe and Bosasso. Puntland’s political elites are therefore
unlikely to move decisively against piracy.
The positive economic impacts of piracy are spread widely and a military strategy to eradicate it
could seriously undermine local development. However, coastal villages have gained little from
hosting pirates and may be open to a negotiated solution which offers a more attractive alternative.

www.chathamhouse.org         2
Programme Paper: Treasure Mapped

INTRODUCTION

There is widespread agreement in the academic and naval communities that Somali piracy needs a
land-based solution.1 Several years of naval counter-piracy missions have “failed to strategically
deter piracy”.2 Pirates have simply shifted their attacks to ships that have not adopted best
management practice, and operate in the open sea to evade counter-piracy measures in the Gulf
of Aden.3 Since mid-2010, the nature of piracy off the coast of Somalia has changed.4 Pirates and
navies have become considerably more violent. Because of the increased difficulty of hijacking
ships in waters monitored by warships from over thirty nations, pirates invest more resources in
maximizing the return from each captured ship. Ransom negotiations now drag on for longer and
result in record payments. Moreover, there are as yet unproven assertions that al-Shabaab is
offering attractive cooperative agreements to pirates, meaning that piracy could at some stage fund
regional instability and terror.

There are therefore strong incentives to try a fresh approach to resolving the issue of piracy off the
Horn of Africa. A land-based solution might involve replacing piracy as a source of income to
relevant local communities. However, it is unclear where the beneficiaries from piracy are located,
whether revenue from pirate activity is mostly channelled abroad or used domestically and how
widely the benefits are spread. Owing to the absence of central government, conventional data on
economic activity in Somalia have been lacking since 1989.
This paper seeks to understand the on-land impacts of piracy, in order to assist those seeking to
find on-land solutions. The paper proposes and evaluates a number of alternative indicators for
economic activity in Somalia. First, data collected by internationally funded NGOs monitoring
commodity prices show that a significant proportion of pirate ransoms are converted into Somali
shillings; that cattle prices have risen with the development of the pirate industry; and that piracy is
not driving food price inflation but on the contrary has offset the loss of purchasing power of local
wages after the 2007/08 food price shocks.
Secondly, satellite imagery shows that none of the pirate towns on the Puntland coast have enough
power output to feature on global nightlight images. This indicates that coastal communities have
not greatly benefited from piracy. Instead the regional centres of Garowe and Bosasso, which
provide the material inputs and the fire-power of the pirate operations, appear to benefit from
piracy-related investment.
Thirdly, analysis of changes in the built environment based on high-resolution satellite images
corroborates these results. Garowe has seen massive investment between 2002 and 2009, much
of the development being concurrent with the explosion of pirate ransoms. The ‘pirate capitals’ Eyl
and Hobyo, however, have seen little investment.
While each of the data sources has significant weaknesses, a consistent story emerges regarding
the impact of ransom money on the Somali economy. Piracy appears to lead to widespread
economic development and therefore has a large interest group behind its continuation. However,
most beneficiaries are located in the provincial capitals. Puntland’s coastal communities could
easily be made considerably better off through activities other than hosting pirates. The
international community should bear these results in mind when developing land-based strategies
to resolve Somalia’s pirate problem.

1 Kraska, James and Brian Wilson (2008) “Fighting Pirates: The Pen and the Sword” World Policy Journal, Vol. 25; No. 4: p.
46; Menkhaus, Ken (2009) “Dangerous Waters,” Survival, Vol. 51; No. 1; Percy, Sarah and Anja Shortland (2010) “The
Business of Piracy in Somalia”, Discussion Papers; DIW Berlin: 1033.
2 Major General Buster Howes, Operational Commander of the EU Naval Forces, Conference on Future of Naval Forces:
RUSI London, 6 July 2011.
3 Shortland, A. and Vothknecht, M. (2011), ‘Combating “Maritime Terrorism” in Somalia’, European Journal of Political
Economy; Vol. 27; S1: pp. 133-151.
4 United Nations (2011), Report of the Special Adviser to the Secretary-General on Legal Issues Related to Piracy off the
Coast of Somalia.

www.chathamhouse.org                3
Programme Paper: Treasure Mapped

BACKGROUND ON SOMALIA

The Somali economy and the pirate industry
The history of political violence and state failure in Somalia is well known, but the Somali economy
is not well researched, owing to lack of data. Somalia is one of the poorest countries in the world
with per capita GDP estimated at less than US$300. A quarter of the population relies on food aid
provided by the World Food Programme. Agricultural activities are the main contributors to GDP,
and there is a service sector based around telecommunications and the transfer of remittances
from the Somali diaspora.5
Estimates of piracy ransoms are significantly lower than those of diaspora remittances, but the vast
majority of remittances are used to cover basic household expenses.6 In this study piracy is
therefore compared with other economic sectors and the ability of the government to raise taxes.
Piracy creates considerable employment: for the crews directly involved in hijacking and for local
militias who guard ships moored in Somali territorial waters. Up to fifty pirates on each hijacked
ship and another fifty people on the coast will be involved in guard duties. Some hostages are
imprisoned on land in order to discourage the ship’s crew or foreign troops from attempting to take
control of the hijacked vessel. As the piracy business is based on ransoming the crew, hostages
are treated reasonably well. The International Maritime Bureau (IMB) reported that 1,016 hostages
had been captured by Somali pirates in 2010, and taking care of them created employment for
local cooks, producers and traders.7

Ransoms for single pirate hijacks ranged from US$690,000 to US$3 million in 2008 but climbed to
a record US$9 million in 2010. The amount of ransom paid is often kept a commercial secret, and
so estimates of the total income from piracy in Somalia vary widely, and are mostly vastly inflated.
About US$40 million was paid in ransoms in 2008.8 A realistic figure for 2009 is in the region of
US$70 million.9 To put this into context, the official government budget of Puntland in 2008 was
US$11.7 million and in 2009 was US$17.6 million.10 Cattle exports from Somalia in 2009 were
worth US$43 million.11 The amount of foreign exchange and income generated by piracy is
potentially a large proportion of Puntland’s GDP.
In 2008, the United Nations (UN) estimated that 40 per cent of the proceeds of piracy directly funds
local employment. Of this, 30 per cent goes to the pirate crew, and those involved in land-side
operations receive 10 per cent. According to the report, a further 10 per cent of revenue is paid in
gifts and bribes to the local community, while the remaining 50 per cent is paid to the financiers and
sponsors of the pirates, who may be based abroad. If all revenue from piracy was invested or spent
locally, it could have a transformative effect on deprived coastal communities.
The testimony of locals interviewed about the effect of piracy on the economy is, however,
conflicting. Piracy does bring employment to the local community. Pirate financiers and ex-pirates
are said to be investing in local businesses and contributing to local governance. However, there
are also complaints that local communities only make negligible gains from piracy, because much
of the money generated is moved abroad. Expenditure on imported goods such as sports utility
vehicles or narcotics does not enhance local development. Critics of piracy also express concern
that the poorer parts of the local community suffer because piracy generates inflation.
The effect of ransom payments on the Somali economy is therefore unclear. In order to create a
lasting land-based solution, it is necessary to ascertain three factors: the proportion of ransom
payments that actually benefits the local economy; the trickle-down effect of piracy revenue into

5 CIA World Factbook.
6 Hammond, Laura; Awad, Mustafa; Dagane, Ali; Hansen, Peter; Horst, Cindy; Menkhaus, Ken and Obare, Lynette (2011)
Cash and Compassion; the Role of the Somali Diaspora in Relief, Development and Peacebuilding: p. 53.
7 IMB Piracy Report (2010) International Maritime Bureau; http://www.icc-ccs.org.
8 Menkhaus, Ken (2009) “Dangerous Waters,” Survival, Vol. 51; No. 1: p. 22.
9 Personal communication Bundespolizei, Luft - und Seesicherheit, Bundesministerium des Innern, Germany.
10 Garowe Online, Puntland Cabinet Passes 2009 Budget, 2 May 2009.
11 Based on total exports and average cattle prices reported by FSNAU.

www.chathamhouse.org             4
Programme Paper: Treasure Mapped

local communities and consequently the size of the pro-pirate interest group; and the location of the
main beneficiaries of piracy.

Remittances in the Somali economy
The existing literature on remittances sheds light on the likely consequences of piracy. Experts on
Somalia point to a deep-rooted culture of sharing.12 Wealthy Somalis raise their social status by
sharing resources within social (mostly clan-based) networks where individuals have an obligation
to assist other members. A Somali proverb says: “The man who owns one hundred goats, but his
relatives have nothing, he is poor.”13 Dispersing assets geographically but within the clan is an
effective risk-reduction strategy when entire herds are regularly wiped out by drought or conflict.14
The large financial networks that facilitate the Somali diaspora’s remittances testify to the strength
of this tradition. Moreover, when prosperous people engage in conspicuous consumption this
generates employment as expensive assets such as cars and large houses require private
protection in the form of chauffeurs and armed guards.
The research on remittances suggests that the most likely developmental effect of piracy would be
widespread but incremental progress rather than conspicuous consumption by the few. Interviews
with pirate bosses back this up. Pirate chief Abshir Boyah, questioned on how he spent his
considerable profits from piracy, simply referred to his extended clan network, stating “It’s not like
three people split a million bucks. It’s more like three hundred.” Another pirate boss, Mohamed
Abdi, laughed off the UN threat to freeze pirate assets: “What assets?”15

12 For example, Ali, Degan, Fanta Toure and Tilleke Kiewied (2005) Cash Relief in a Contested Area: Lessons from
Somalia Humanitarian Practice Network, ODI Network Paper; 50: pp. 11.
13 Cited in Lindley, Anna (2010) The Early Morning Phonecall: Somali Refugees Remittances; Studies in Forced Migration
Vol. 28; Berghahn Books: pp. 73.
14 Horst, Cindy (2006) Transnational Nomads: How Somalis Cope with Refugee Life in the Dadaab Camps of Kenya,
Studies in Forced Migration: Vol. 19; Berghahn Books.
15 Gettleman, Jeffrey (2010) The Pirates are Winning, The New York Review of Books, 14 September 2010.

www.chathamhouse.org               5
Programme Paper: Treasure Mapped

ANALYSIS OF AVAILABLE COMMODITY DATA

Below are results from the analysis of available monthly data on real wages, rice and cattle prices,
and variations in the exchange rate between the Somali shilling and the US dollar between January
2000 and December 2010. Further information on methodology, data, variables and results can be
found in the appendices.16

Impact of piracy on wages in Somalia
The Food Security and Nutrition Analysis Unit – Somalia (FSNAU) reports the daily wage rate for
casual labour in local markets. These wages differ widely between markets. Because most
hijacked ships are taken to the Puntland coast during ransom negotiations, this study focused on
the three provinces that make up Puntland: Bari, Nugal and Muduq.17 The southern coastal
province of Banaadir, which includes Mogadishu, was used as a comparator. Data is collected from
the respective regional capitals Bosasso, Garowe and Galkaayo. The development of real and
nominal wages over time is shown in Figures 1 and 2.

Figure 1: Local nominal daily wage rate (SSh)

                                       Nominal wages
                    140000                                                      Nomi na l Wa ge Muduq
                    120000
                    100000                                                      Nomi na l Wa ge Nuga l
      SSh per Day

                     80000
                                                                                Nomi na l Wa ge Ba ri
                     60000
                     40000                                                      Nomi na l Wa ge Ba na a di r
                     20000
                         0
                             Jan‐00
                             Jan‐01
                             Jan‐02
                             Jan‐03
                             Jan‐04
                             Jan‐05
                             Jan‐06
                             Jan‐07
                             Jan‐08
                             Jan‐09
                             Jan‐10

From Figure 1 it appears that nominal daily wages in the pirate provinces of Nugal and Muduq
have caught up with and then overtaken non-pirate regions since the explosion of piracy in 2008.18
In the three pirate regions nominal wages have more than doubled since 2006, while in the
Banaadir region nominal wages in 2010 were roughly equivalent to their 2006 levels.

16 Shortland, Anja (2011) “Robin Hook” Economics of Security, Working Paper Series, Discussion Paper No. 1155: DIW
Berlin.
17 “Puntland remains the epicentre of piracy...” according to the UN (2011): p. 14.
18 Gaps in the diagrams are explained by no figures being available for that period.

www.chathamhouse.org             6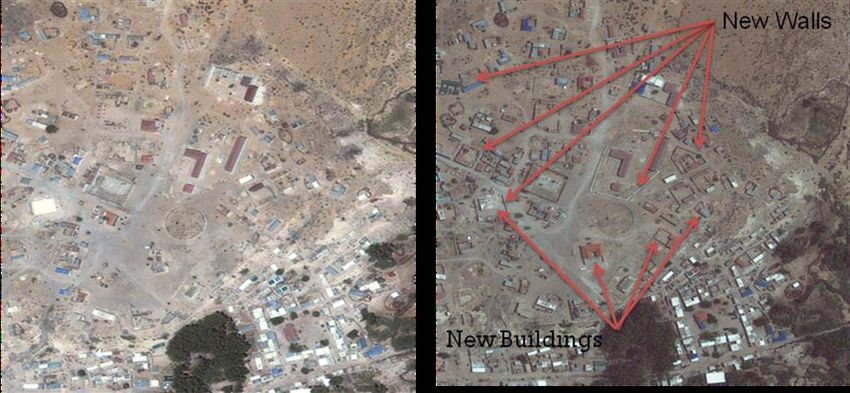
Programme Paper: Treasure Mapped

Figure 2: Real wages

                                                                                              Real Wages
     Nominal wage / 1kg red rice

                                   14
                                   12                                                                                                      Rea l Wa ge Muduq
                                   10                                                                                                      Rea l Wa ge Nuga l
                                    8                                                                                                      Rea l Wa ge Ba ri
                                    6
                                                                                                                                           Rea l Wa ge Ba na a di r
                                    4
                                    2
                                    0
                                        Jan‐00
                                                 Jan‐01
                                                          Jan‐02
                                                                   Jan‐03
                                                                            Jan‐04
                                                                                     Jan‐05
                                                                                              Jan‐06
                                                                                                       Jan‐07
                                                                                                                Jan‐08
                                                                                                                         Jan‐09
                                                                                                                                  Jan‐10

Figure 2 tracks the purchasing power of the nominal wage over time. The “real wage” is calculated
by dividing the nominal wage rate by the local price of a staple food, in this case 1 kg of rice. The
real wage Figure suggests that people in the pirate provinces may not feel that they have gained
from piracy, because nominal wage gains have been entirely offset by the food price increases of
2007/08.

The statistical analysis presented in Appendix II shows that the real wages of casual workers in
Bari, Muduq and Nugaal have risen significantly in response to the establishment of the piracy
industry. This is likely to reflect both direct employment opportunities and investments into local
businesses. However, the positive effects of piracy are offset by food price inflation. No positive
impact of piracy is observed for Banaadir, which has a long coastline and several ports, but does
not appear to be involved in the ransoming business. Instead there was a very high “peace
dividend” during the period of the rule of the Union of Islamic Courts from June to December 2006.

Impact of piracy on rice prices
Month-on-month changes in the average price charged for 1kg of the food staple (imported red
rice) are used to determine whether piracy has created food price inflation through increased
demand or by deterring shipping companies. Contrary to common perception, the statistical model
shows that on average, rice prices in regional markets in Somalia have, if anything, fallen as a
result of piracy. The food price rises observed when piracy exploded in 2008 were due to
international rather than local developments. Claims about piracy creating inflation are therefore
likely to have been caused by confusion about local and international trends in food prices. The
result that the growth of the pirate industry has lowered the average price of imported rice might be
explained by pirates providing local governance and stability, the side-effect of which has been to
help other entrepreneurs to trade more easily. An alternative explanation might be that trucks
acquired by successful pirates are used for transporting merchandise.

Impact of piracy on the Somali shilling exchange rate
The Somali shilling (SSh) is not backed by a government and there is no monetary authority. Many
transactions are conducted in US dollars, but the Somali shilling continues to be widely used. It

www.chathamhouse.org                                                        7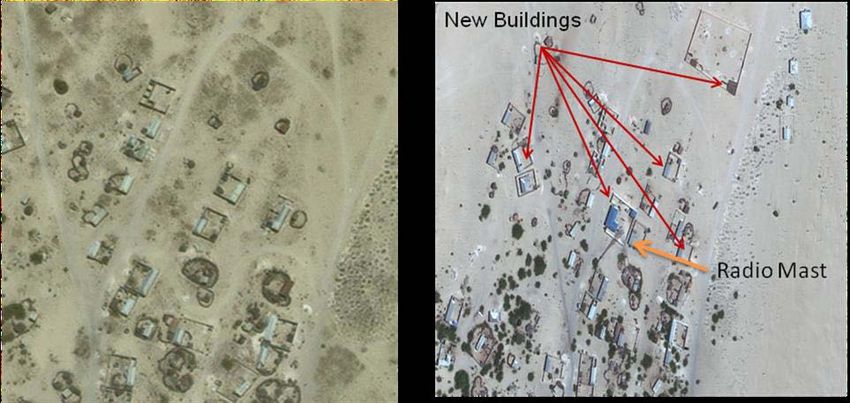
Programme Paper: Treasure Mapped

appears to be upheld by common assent and remittances from abroad.19 The effect of piracy on
the average exchange rate across markets was evaluated and compared with the effects of cattle
exports on the exchange rate. This comparison gives an indication of how much of the ransom
payments find their way into local currency transactions.

Figure 3: SSh/US$ exchange rate

                                                             SSH / US$
  40000

  35000

  30000

  25000

  20000                                                                                                       SSH / US$

  15000

  10000

   5000

       0
           Jan-00

                    Jan-01

                             Jan-02

                                      Jan-03

                                               Jan-04

                                                        Jan-05

                                                                 Jan-06

                                                                          Jan-07

                                                                                   Jan-08

                                                                                            Jan-09

                                                                                                     Jan-10

The statistical analysis indicates that piracy works in exactly the same way as the cattle export
sector in that it generates foreign exchange revenues. Both piracy and cattle exports slow the rate
of depreciation of the Somali shilling. However, it seems to take some time – about five months –
before successful hijackings translate into increased demand for Somali shillings. Given that
ransom negotiations have generally taken between two and four months, the five-month delay
suggests that pirates conduct their transactions mostly in a US dollar economy.20 The effects of
piracy on the exchange rate occur only when transactions paid by pirates in US dollars for goods
and services are exchanged into local currency.
A comparison of cattle exports and pirate ransom variables shows that a successful pirate hijack
and ransom operation was roughly equivalent to the export value of 1,650 cattle.21 At 2009 average
cattle prices, this means that on average a hijack brought US$450,000 into the SSh-denominated
local economy. While this is low compared with recently reported ransom records, until late 2008
ransoms tended to be well below US$1 million. Also, a significant proportion of hijacked ships are
fishing trawlers and dhows, so are unlikely to bring in large ransoms. Based on 44 successful
hijacks in 2009, the statistical model suggests that US$21 million out of total payments of US$70
million were channelled into the local economy. This is very close to the UK Foreign &
Commonwealth Office (FCO) estimate that about one-third of ransoms stay in Somalia.22 The UN’s
2008 estimate that 50 per cent of ransoms were paid out locally (in wages and bribes) is higher, but
this includes dollars that continued to circulate in parallel with the Somali shilling, as well as dollars
used to fund the import of equipment, luxury goods and khat.

19 The Economist, Commerce Among Chaos; Feb 10 2011.
20 Cars and drugs are imported and therefore require hard currency; real estate appears to be priced in US$.
21 Comparing the relative size of the coefficients of the cattle and pirate success variables in the statistical model.
22 Personal communication received at a Cabinet Office hosted cross-Whitehall meeting in London. March 2011.

www.chathamhouse.org                           8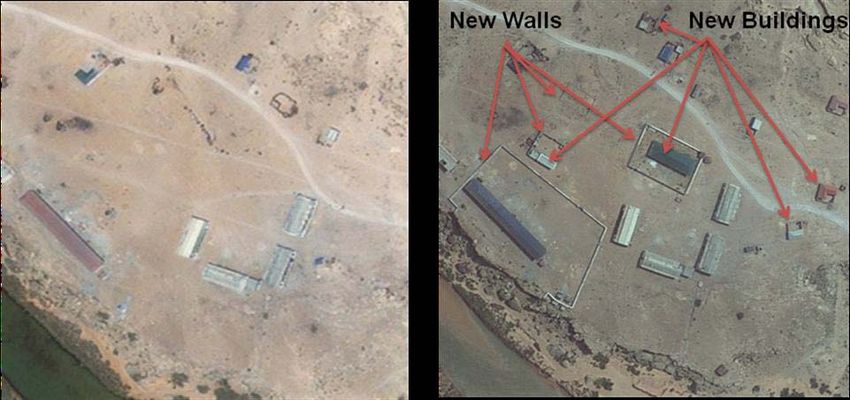
Programme Paper: Treasure Mapped

Cattle prices
The SSh price of local quality cattle in regional markets is used to illustrate the spill-over effect of
piracy into the wider economy. Local quality cattle are an investment rather than a consumption
good (the main meat consumed is mutton or goat) and are distinct from export-quality cattle. All
things being equal, cattle price increases related to piracy would indicate that local nomadic
communities participate in the gains from piracy. From the cattle price models presented in the
appendices there is evidence that piracy drives up the price of cattle, benefiting pastoralists by
raising the value of their assets.
In all provinces the booming pirate industry is associated with an increase in cattle prices. In
Muduq increases in cattle prices can be statistically linked directly to pirate successes, indicating
that either pirates or those supplying them with goods and services invest their financial gains
locally.

Summary
The data analysis indicates pirate incomes have widespread and significant positive impacts on the
Somali economy. Although only a fraction of ransoms is exchanged into Somali shillings, the
appreciation of the Somali shilling resulting from the injection of US dollars benefits people relying
on imported food staples such as rice. There are clear trickle-down effects for casual labourers and
pastoralists because of higher cattle prices.
Although there are concerns about data quality, analysis of the exchange rate changes used to
establish the impact of piracy money on the local economy correlates with traditional intelligence
sources.

www.chathamhouse.org          9
Programme Paper: Treasure Mapped

EVIDENCE FROM SATELLITE IMAGES

The relationship between night-time light emissions and economic parameters such as urban
development, economic activity and poverty has been convincingly demonstrated. The analysis of
nightlights data is particularly valuable where data collection is sporadic and unreliable.23

Night-time light emissions
The images produced by the National Oceanic and Atmospheric Administration (NOAA) are annual
records of stable nightlights, which are composite images of each location taken every evening
over a year. Individual camera shots are disregarded if there is cloud cover or moon glare. Lights
which only occur occasionally (owing to fires or thunderstorms) are excluded. The intensity of light
emissions is measured on a scale of 0 to 64. Observations at the bottom end of the spectrum are
censored to reduce noise in the data.
Somalia is barely visible on the global nightlight images. One needs to increase the brightness
setting considerably to make Somalia’s cities visible, but none of the well-known pirate villages –
Eyl, Hobyo or Xharardeere – emit sufficient light to be picked up by remote sensing (see Figure
4).24
Figure 4: Somalia nightlights, 2009

23 Global nightlight images are available from NOAA satellite and information systems. http://noaasis.noaa.gov/NOAASIS/:
National Oceanic and Atmospheric Administration.
24 A polygon was created around each city for each year. Using ArcGIS (9.3) software the following information was
extracted from each city image: the total light emitted from the city-polygon, the number of lit pixels detected by the satellite
and the light intensity score of the brightest pixel.

www.chathamhouse.org                  10
Programme Paper: Treasure Mapped

Analysis
The nightlights analysis tracks fifteen cities in Somalia from 2000 to 2009 for which night-time lights
appear regularly in the NOAA images.25
Total light emission increased over time in Puntland and Somaliland. This reflects both
reconstruction after the civil war and diaspora remittances supporting consumption and
development. After 2007 however, there appears to be a downturn in total light emissions in twelve
of the fifteen cities. The exceptions are Garowe, Bosasso and Kismayo (see Figure 5).

Figure 5: Sum of light intensity over all pixels in Somali cities

                                        Total Light Emissions
                                                                                                    Baydhabo
  1000.000                                                                                          Beletweyne
    900.000
                                                                                                    Boraama
    800.000
                                                                                                    Bosasso
    700.000
    600.000                                                                                         Burao
    500.000                                                                                         Erigavo
    400.000                                                                                         Galkaio
    300.000                                                                                         Garowe
    200.000
                                                                                                    Kismayo
    100.000
                                                                                                    Lascanood
      0.000
                 2000

                         2001

                                2002

                                         2003

                                                2004

                                                       2005

                                                              2006

                                                                      2007

                                                                              2008

                                                                                     2009

                                                                                                    Qardho

The pronounced general decrease in light emissions can be linked to the massive increases in
global food and energy prices in 2008, below average rainfalls across the country, the resumption
of violence in south-central Somalia and a slowdown of diaspora remittances during the global
financial crisis.
The pattern of total lit areas confirms a general decline in electricity consumption in Somalia after
2007. Figure 6 shows that many poor or less densely settled areas completely disappear from the
nightlights images.

25 Baydabho, Beletweyne, Berbera, Boraama, Bosasso, Burao, Erigavo, Galkaio, Garowe, Hargeisa, Jowhar, Kismayo,
Lasanood, Mogadishu, Quardho. Berbera, Hargeisa and Mogadishu are considerably larger and richer than the other cities
and are therefore excluded from the illustration graphs.

www.chathamhouse.org               11
Programme Paper: Treasure Mapped
Figure 6: Number of pixels lit in Somali cities
Town Area
120 Baydhabo
Beletweyne
100
Borama
Number of Pixels Lit
80 Bosasso
Burao
60 Erigavo
Galkaio
40
Garowe
20 Kismayo
Lascanood
0
Qardho
2000
2001
2002
2003
2004
2005
2006
2007
2008
2009
In Garowe and Bosasso the decline did not become apparent until 2009, but it does occur. The
only city to increase its light footprint over this period was the harbour city of Kismayo in south-
central Somalia. Kismayo was captured by the Islamist al-Shabaab militia in August 2008, and
basic provision of electricity was restored by the al-Shabaab administration in 2009.
In Figure 7, light emissions from the brightest pixel in each city were examined as an indicator of
changes in wealth and disposable income of the richest. There are only three cities in the dataset
where the brightest nightlights of 2009 exceed those of 2007: Hargeisa (rising from 48 to 50),
Garowe (9 to 12) and Bosasso (20 to 25).
Figure 7: Light emission from brightest pixel
Brightest Cell Emissions
Baydhabo
30 Beletweyne
25 Borama
Bosasso
20
Burao
0‐64 Score
15 Erigavo
Galkaio
10
Garowe
5 Kismayo
Lascanood
0
2000
2001
2002
2003
2004
2005
2006
2007
2008
2009
Qardho
www.chathamhouse.org 12Programme Paper: Treasure Mapped Interpretation Since 2007, disposable income in Somalia has declined considerably owing to adverse local, regional and global developments, hitting the poorest particularly hard but also affecting wealthier sections of society. The only two cities that deviate from this general pattern are Garowe and Bosasso, where the growth in electricity consumption has more than offset declines in the spending power of the poor. Both cities are perceived to be closely associated with piracy. Indeed, their growth spurt began after 2005, a year considered to mark a step-change in pirate activity, which was transformed from the extraction of on-the-spot fines to hijack and ransom operations. The growth of Garowe and Bossaso further accelerated with the explosion of piracy in the Gulf of Aden in 2008. Garowe is at the centre of the pirates’ tribal heartland.26 The armed boarding teams tend to come from the interior of the region and employ fishermen for navigation. Bosasso was a pirate port in the past, although ransom negotiations have not been conducted from the vicinity since international anti-piracy naval missions started. Bosasso is the main port for importing pirate equipment such as communications technology, motors and weapons. Bosasso’s status as Puntland’s boomtown makes it an attractive location for successful (former) pirates to invest their newly found wealth in businesses and real estate.27 Analysis of high-resolution daytime images The nightlights data demonstrate that smaller coastal towns have gained little from the pirate business carried out in their local waters.28 By comparing high-resolution satellite images of the coastal pirate towns of Eyl and Hobyo as well as the provincial capital Garowe before and after the explosion of piracy in 2008, development in the three locations associated with piracy can be analysed.29 Changes in settlement size, investment in large-scale buildings and improvements in local infrastructure were used as a measure. Ground-based imagery sourced from the internet was used for scene familiarization and to verify the overhead imagery interpretation. Eyl image analysis The town of Eyl has two areas, a lower part situated directly on the coast and an upper part further along a valley. There are no significant changes in the size or housing density of either settlement, called the fishing village and main town for the purposes of this paper. 26 Hansen, Stig Jarle (2009) Piracy in the Greater Gulf of Aden: Myths, Misconceptions and Remedies, NIBR report: 29. 27 Both Foreign office and MoD officials rejected the alternative hypothesis that the observed effect is due to Bosasso elites receiving financial transfers from the counter-piracy operation. Personal communication received at a cross-Whitehall meeting hosted by the Cabinet Office in London, March 2011. 28 US air-strikes in Somalia have generally occurred in broad daylight. It is therefore unlikely that the pirate villages are following a ‘blackout’ policy to reduce the likelihood of night-time attacks. 29 Being of little commercial interest, the area was not surveyed frequently and several images are partially obscured by clouds. The chosen images of Eyl were collected on 24 September 2005 by IKONUS and 05 July 2009 by GEOEYE. Imagery of Hobyo was collected by IKONUS on 04 July 2006 and by GEOEYE on 24 June 2010. The imagery of Garowe was collected by IKONUS on 12 February 2002 and by GEOEYE on 13 July 2009. There were no appropriate commercially available images of Gharardeere. Each image was available in orthorectified format, full colour and (almost) cloud free. Spatial ground resolution of the IKONUS was approximately 100cm and approximately 50cm for GEOEYE. www.chathamhouse.org 13
Programme Paper: Treasure Mapped

Figure 8: Fishing village Eyl, September 2005 vs July 2009

In the fishing village the crude system of gravel roads and paths remains unaltered although some
small increase in vehicle numbers was observed. Some houses – probably private homes – have
been improved with new roofing and a few have been newly built. The fishing fleet of small boats
has remained largely unaltered and harbour facilities have not been upgraded. Some new, fortified
buildings (potentially for storage?) have been built and older ones are surrounded by high
perimeter walls in the later image. While perimeter walls are an integral part of Somali domestic
architecture, this was not common practice for storage buildings before 2008.
A similar situation is seen in the main town (see Figure 9). Road and path infrastructure has not
changed significantly as it might have been if any major scheme for town improvement was
underway. However, there appear to be significantly more vehicles in the town. A small number of
new private houses have been constructed, mostly on the northern edge of the town and the
roofing has been upgraded on others. There are two new large buildings in the centre of the town:
these do not have any cars around them, making it unlikely that they have civic or retail functions.
The most noticeable changes to existing structures are again the high perimeter walls erected
around a number of residential and non-residential buildings, including a compound with two layers
of security walls. The development suggests a combination of a rising value of stored goods and
increased community tensions. Given that when the first image was taken in 2005 Somalia had
already experienced sixteen years of internal conflict, it is highly likely that the new walls are
related to piracy.
Figure 9: Main town Eyl, September 2005 vs July 2009

www.chathamhouse.org         14
Programme Paper: Treasure Mapped

Photographic images from Eyl show that most housing is of poor quality with flat roofs, but new
houses have pitched roofs and appear to be of higher quality. In interviews many pirates said they
bought “a house and a car” with their ransom money.30 The new-builds and home improvements in
Eyl could well be linked to the fishermen hired by pirates for their navigational skills. The rest of the
population does not appear to be gaining much from the piracy business, nor is there visible
investment in infrastructure useful to the general population, such as roads or harbour facilities.
During interviews residents expressed considerable scepticism about the benefits of piracy to the
local community and there were several grassroots anti-piracy initiatives. The high perimeter walls
around major compounds in Eyl might suggest that pirates are concerned about deteriorating
community relations. Indeed, the UN reports that the Puntland authorities concentrated their land-
based counter-piracy operations in 2010 on Eyl, leading to the relocation of pirate activity towards
Hobyo and Garacad.31 The counter-piracy operations would not have been possible without local
support.

Hobyo image analysis
Hobyo is a small settlement of around 5,000 people surrounded by encroaching sand dunes. The
local elder Abdullahi Ahmed Barre’s complaints that, ‘we have no schools, no farming, no fishing –
it's ground zero here’ and ‘the nearest hospital is an eight-hour drive on a rough road’32 are backed
up by the image. There is no evidence of upgraded road infrastructure, nor has Hobyo grown
significantly in size. However, there are some signs of increased private affluence: traffic in Hobyo
appears to have increased and some alterations to existing buildings are evident. There are also a
few new, larger than average, thickly-walled dwellings concentrated at the town’s northern end.
Hobyo has a small beach area away from the town where boat launching takes place, with
marginally greater activity on the later image.
The main change to Hobyo’s infrastructure is a new, heavily secured communications centre with a
very tall microwave broadcasting relay tower (see Figure 10).

Figure 10: Hobyo, July 2006 vs June 2010

30 Hansen, 2009: p. 40.
31 UN (2011) p. 14.
32 Jean-Marc Mojon (2010) In the heart of a Somali pirates' lair, AFP: Sep 2, 2010.

www.chathamhouse.org                15
Programme Paper: Treasure Mapped
Telecommunications is an important economic sector in Somalia with several competing networks,
funded by diaspora investment. City skylines are often dominated by large communications towers.
Since the systems are more or less line-of-sight, such towers are tall; the lattice construction
mitigates the impact of high winds. Signals are received by microwave dish aerials, amplified and
sent on to the next relay or terminal. Radio and telephone signals for local consumption are
beamed omnidirectionally to the immediate area. Hobyo’s relay tower seems to operate in several
directions as it has a number of differently aligned dishes.
In 2009 satellite images of Garowe there are three comparable telecommunications towers, as well
as other considerably smaller and/or less complex masts. There is no telecommunications tower on
the image of Eyl. The question is therefore why Hobyo, an impoverished provincial backwater, has
a telecommunications facility to rival the state-of-the-art facilities in Puntland’s capital city.33 The
most probable explanation for this first-rate installation in Hobyo is piracy. The height of the Hobyo
mast indicates that it serves a large area and its reach to sea is probably more relevant than its
ability to broadcast to the surrounding desert. As there are no harbour facilities, hijacked ships are
moored several miles from the coast, and it is easier to guard ships from rival gangs in the open
sea. Reliable telecommunications are needed to ensure that ships are appropriately guarded and
supplied. Mobile phone calls are used in ransom negotiations to prove that hostages are alive.
Pirates also use the internet to research victims’ backgrounds and condition their ransom
demands.
There may therefore be some give and take between pirates and the local community in Hobyo
(which has a radio station34 and telecommunications facilities), with a reasonably cooperative
relationship. While perimeter security around the radio tower appears to be strong, there is no
massive investment in fortification elsewhere around the town and the authorities have not
mounted any credible counter-piracy operations in this location.
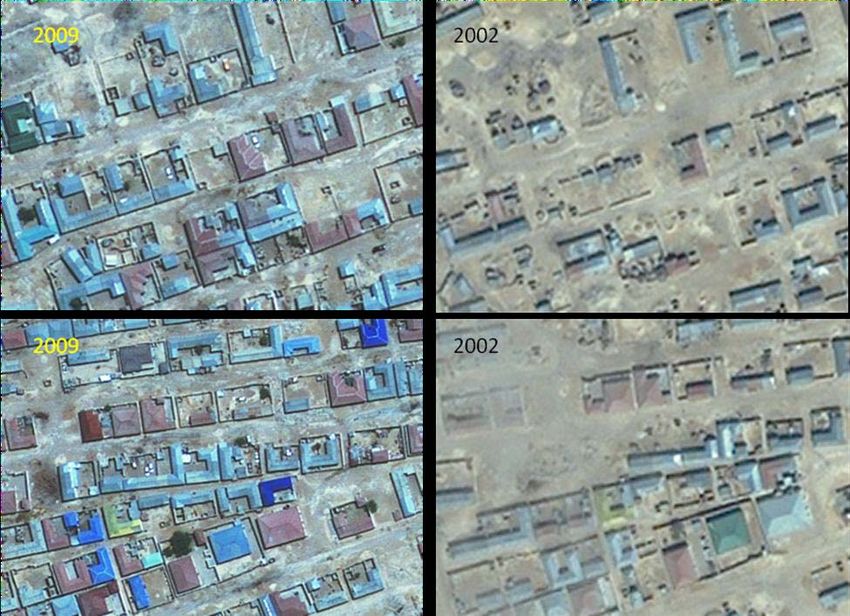
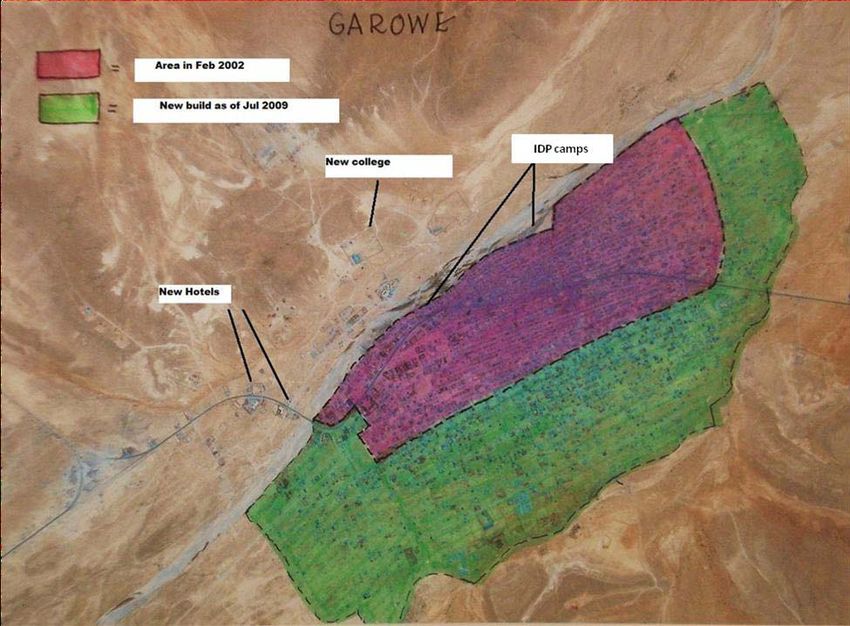
Garowe image analysis
Garowe is the capital of Puntland, situated well inland with a population of between 40,000 and
70,000 people.35 Investment is on a completely different scale from that in the coastal communities.
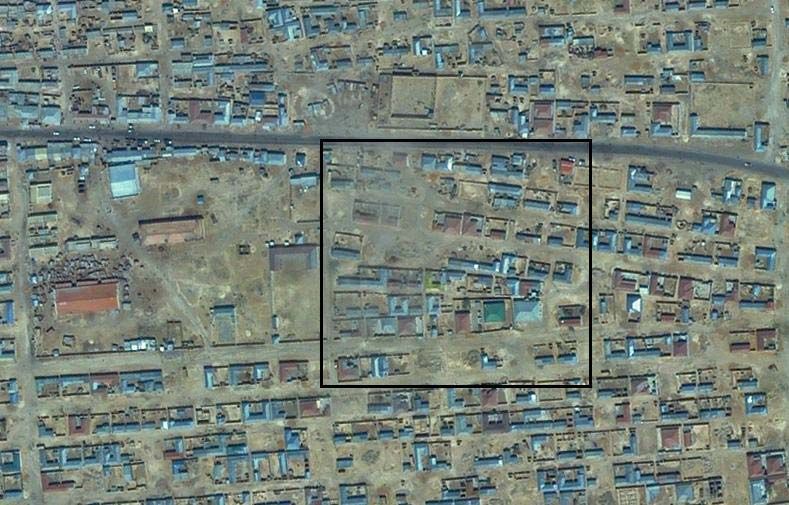
Between February 2002 and July 2009 Garowe almost doubled in area with significant housing,
light industrial and commercial developments to the south-east and south of the town (see Figure
11).
Figure 11: Garowe
overall growth
33 The Garowe radio mast, most similar to the Hobyo tower, is situated in a large walled compound with 13 parked cars, i.e.
it is part of a major business (image not included). The telecommunications facilities in the UN compound are less complex
than the Hobyo radio tower.
34 http://www.hobyoradio.com.
35 UN Habitat (2008) Garowe: First Steps towards Strategic Urban Planning.
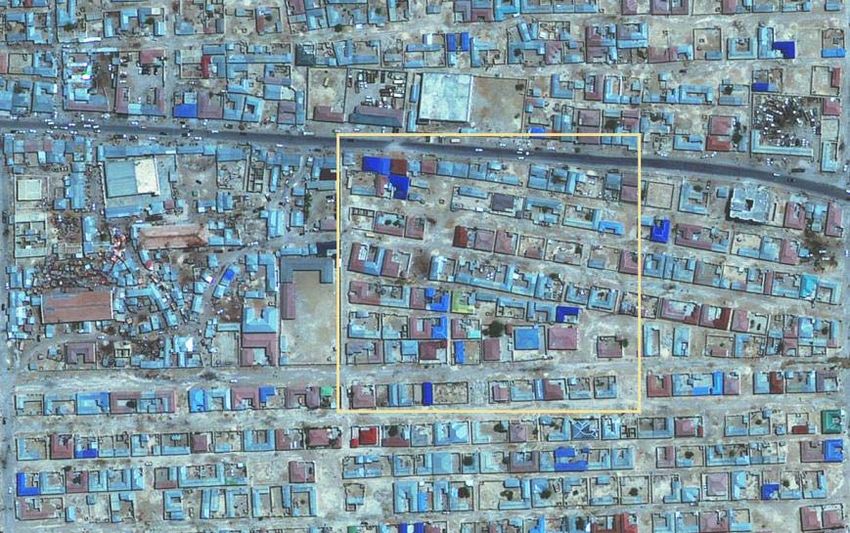
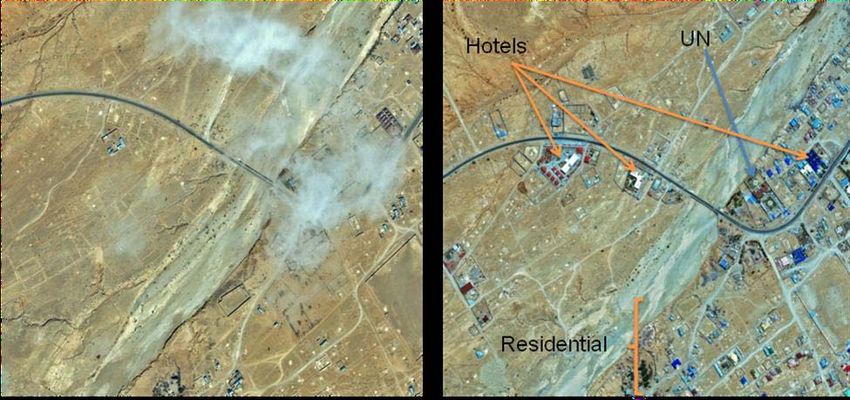
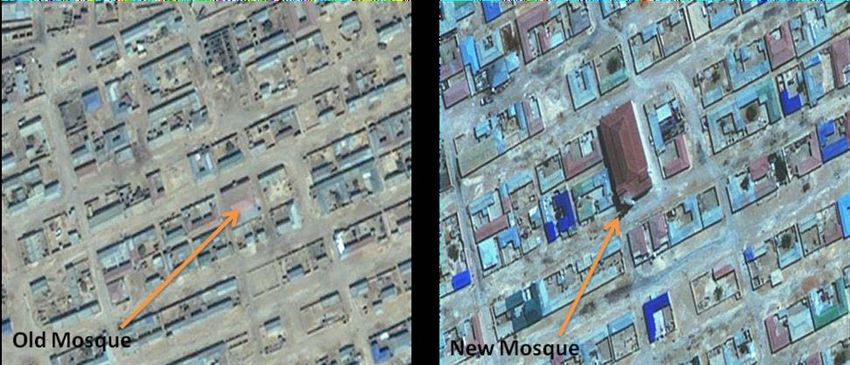
www.chathamhouse.org 16Programme Paper: Treasure Mapped North of the town, on the other side of the Togga-Garowe River and along the main highway to the west, many new large scale buildings and commercial developments are noticeable (see Figure 12 below). Figure 12: South-west Garowe, February 2002 vs July 2009 In the centre of town existing facilities seem to have been developed with expansion, roofing and security in evidence and the increase in traffic appears to be substantial. Figure 13 illustrates changes in part of the central area, to the east of the central market. In the outlined area there have been at least 30 changes, including newly built, improved or enlarged houses and outlets. On the edges of town, gravel roads are laid out indicating plans for further growth. Figure 13: Changes in central Garowe, February 2002 vs June 2009 It is possible to identify a number of the larger buildings, as well as the dates of their completion. The buildings on the northern edge of the town are associated with the foreign-sponsored Puntland State University and the hospital. The UN guest house and compound were completed in 2007. On the southern side of town the UN constructed large compounds to house internally displaced people.36 The number of businesses servicing cars, trucks and retail areas (with associated car parking) along the north-south highway has grown significantly. In the centre of town the old main mosque was replaced with the huge Masjid al Huda with its minaret clearly visible (see Figure 14). 36 UN Habitat (2008). www.chathamhouse.org 17
Programme Paper: Treasure Mapped

Figure 14: Central Garowe, February 2002 vs July 2009: Mosque

The Somali diaspora is likely to have contributed significantly to private investment in Garowe.
However, mass emigration from Puntland is relatively recent and the Puntland diaspora is less able
to contribute than the well-established Somaliland diaspora, which emigrated in the 1970s and 80s.
Moreover, several of the large-scale new developments opened in 2009/10, i.e. at the time when
the diaspora was under pressure from the global financial crisis, but when pirate ransoms surged.
There are a number of new hotels clearly built for rich customers, potentially linked to pirates. It is
therefore probable that pirate money has contributed to the rapid growth of this town, which is at
the heart of the pirates’ clan homeland.
It is commonly asserted by local residents that pirates are living and spending money in Garowe.
They are said to be easily identifiable by their flash cars, lavish weddings and expensive drug
habits. The satellite images provide some evidence for this: in the 2002 image there are very few
cars associated with residential buildings. In the 2009 image there are a significant number of
houses in residential areas of town with a car parked within the perimeter walls. In most cases
these are newly-built, not particularly large houses with very noticeable security walls, often in
small clusters with other new houses with cars (see Figure 15 for two examples). The structures
are considerably less elaborate than the high-status villas marketed to diaspora investors, which
have a minimum price tag of US$45,000. While the ‘home plus car’ combination is evidence of new
money rather than pirate money, it should be interpreted in conjunction with the pirates’ own
statements that they tend to buy “a house and a car” and local residents’ common assertion that
piracy and car ownership are linked.

www.chathamhouse.org          18
Programme Paper: Treasure Mapped

Figure 15: Central Garowe, February 2002 vs July 2009: ‘House + Car’

Summary
There is evidence of new affluence in the three locations, but investment in Garowe is on a
completely different scale from that in the coastal areas. Much of the new investment has come at
a time of financial retrenchment for the diaspora and is concurrent with the explosion of piracy. If
low-key new house and car ownership is linked to piracy, it tallies well with the results from the
previous sections that a) a considerable proportion of ransom money is spent in-country, b) pirates’
spending choices are influenced by social norms limiting conspicuous consumption, and c) such
expenditure is concentrated inland rather than on the coast. The imagery from Eyl and Hobyo
suggests that the coastal communities have not experienced an economic boom.

www.chathamhouse.org         19
Programme Paper: Treasure Mapped

CONCLUSION
The paper has demonstrated the impact of piracy on the local and national economies of Somalia,
using a number of innovative ideas for tracking economic development in a failed state. Piracy has
created employment and considerable multiplier effects in the Puntland economy, even if a
significant proportion of the proceeds is invested in foreign goods or channelled to foreign
financiers. The distribution of ransoms follows traditional patterns in Somalia, involving
considerable redistribution and investment in urban centres rather than coastal villages. Piracy-
related gains have been largely offset, however, by the rise in international food prices. While
Puntlanders are relatively better off than the rest of the country as a result of piracy, the poor are
no better off in absolute terms.
The conclusion that a large group of people can be expected to benefit from piracy should not
discourage the international community from seeking a land-based solution. The total cost of piracy
off the Horn of Africa (including the counter-piracy measures) was estimated to be in the region of
US$7–12 billion for 2010, while ransoms were said to be in the region of US$250 million.37 Even if
Somali communities received all of the ransom money, replacing this source of income (for
example with a combination of a foreign-funded security forces and development aid) would be
considerably cheaper than continuing with the status quo.
A negotiated solution to the piracy problem should aim to exploit local disappointment among
coastal communities regarding the economic benefits from piracy and offer them an alternative that
brings them far greater benefits than hosting pirates does. A military crack-down on the other hand
would deprive one of the world’s poorest nations of an important source of income and aggravate
poverty.

37 Bowden, Anna (2010), The Economic Cost of Maritime Piracy, One Earth Future Working Paper, December 2010. These
figures have not been verified, but are used to illustrate that there is considerable scope for a solution that makes both sides
better off.

www.chathamhouse.org                  20
Programme Paper: Treasure Mapped

APPENDIX I: DATA AND METHODOLOGY

Model
The model takes the following form: y = f {piracy, controls for business conditions, shocks}. The
dependent (y) variables are the price and wage data collected the FSNAU. Prices and wages may
or may not be affected by piracy, but they are certainly affected by the general business
environment. Moreover, pirate activity also positively correlates with improved business conditions.
Percy and Shortland (2010) and de Groot et al. (2010) show that anarchy is bad for pirates and that
as a country starts to rebuild governance structures opportunities for piracy improve until law
                                38
enforcement becomes effective.
Indeed the explosion of piracy in Puntland started in 2007 when local governance became
sufficiently stable to enforce contracts and property rights. It is therefore very important to control
for general business conditions in this model. Omitting to control for business conditions would
wrongly attribute the effect of improvements in the ease of trading to piracy. Business activity is
aided by improvements in institutional and physical infrastructure and reduced when conflict
intensity increases. In the absence of concrete information on monthly variations in the quality of
the business environment, the proxy variables below were developed to capture important aspects
of business conditions.

There are also a number of shocks that have an impact on the Somali economy, particularly the
cost of import prices. Somalia is highly dependent on imports of food staples, the price of which is
determined in global markets. Prices may also fluctuate seasonally. The model therefore
additionally controls for these developments.
The data are monthly observations from January 2000 to December 2010. I used either differences
or deflators to create stationary time series or included lagged variables to strip out pure time
effects. Ordinary Least Squares regression was used. The residuals do not exhibit a time trend and
are normally distributed. In regional time series, there are several missing observations. I have not
interpolated or otherwise replaced missing values. For average price series, I calculated the
average across all markets that are reporting data for the month.

Data
Somalia does not have a statistical service, but the Somali Food Security and Nutrition Analysis
                                                                                  39
Unit (FSNAU) collects local market data to monitor threats to food security. Price data are
collected weekly and averaged over the month. If no price is available for a certain commodity,
                                                                   40
then this generally means that it was not traded during the period. I use the following price series:
wages of casual workers, (imported) red rice prices, the Somali shilling/US dollar exchange rate
and the price of ‘local quality’ cattle.

Piracy
Information on pirate attacks is published annually in the International Maritime Bureau’s Annual
Piracy Report. The IMB publishes narratives on all incidents of piracy reported by captains and
ship-owners. From the narratives one can distinguish between successful and unsuccessful
hijacking attempts. I code as a success any reported incident where the pirates hijacked a ship and
ultimately extracted a ransom payment from the owners. In the analysis, the total number of

38 Percy, Sarah and Anja Shortland (2010), ‘The Business of Piracy in Somalia’, Discussion Papers, DIW Berlin: 1033; and
de Groot, Olav; Rablen, Matthew and Anja Shortland (2010) Gov aargh nance – ‘even criminals need law and order’,
Economics of Security Working Paper Series: DIW Berlin.
39 http://www.fsnau.org/
40 Personal communication from Kamau Wanjohi, data manager at FSNAU.

www.chathamhouse.org               21
Programme Paper: Treasure Mapped
incidents of piracy, the average number of incidents of piracy in the last six months and the
(previous) incidents of successful piracy are used as explanatory variables. The first two variables
measure the impact of the industry as a whole on the economy, while the latter captures money
inflows through ransom payments.
Control variables for business conditions
Instability/Missing markets: This is a count of the number of markets in which no sorghum price
was reported for a given month. The market data provided by FSNAU often missed observations
for a number of markets. This is caused by traders not trading in a market because of a worsening
security situation, or by the observer being unable to travel or otherwise obtain the information.
Unexploited arbitrage gains: The standard deviation of prices relative to their monthly mean is used
as a proxy for local monopolies and the ease of trading and safe movement inside Somalia. There
is a considerable spread of prices between markets, even in commodities which are high value to
weight. For example the US$/SSh exchange rate exhibits large regional variations – even though
the financial hawala networks mean that traders would not have to travel with cash in US$ between
41
regional centres to exploit arbitrage gains. The variability of the exchange rate between markets
is therefore proposed as a proxy of local monopolies and information problems. The much larger
variation in the local commodity prices occurs because of the additional problems encountered by
merchants who have to physically transport their goods to markets over rickety physical
infrastructures and with the need to protect against armed thieves.
Contractual environment: The Somalia Water and Land Information management agency
(SWALIM) attempted to rebuild the data collection network for rainfall and river stream-flow data in
Somalia after the civil war. 42 However, SWALIM found it difficult to contract reliable weather
stations, because insecurity meant that staff could not leave their homes or fled the area. I
therefore use the percentage of pre-war stations contracted as a proxy for the feasibility of entering
43
into a long-term contract/supply relationship and building (very) basic infrastructure.
Additionally, I include a UIC dummy to control for the period of the rule of the Union of Islamic
Courts from June to December 2006. The UIC is generally considered to have been the most
successful administration in delivering governance and stability in Southern and Central Somalia
44
over the last 20 years.
Exports: I use the FNSAU data on the exports of cattle from Somali harbours to control for legal
foreign exchange earnings, and the effect of livestock export bans as another indicator for the ease
of doing business and transporting goods over large distances. In months when the FSNAU did not
report any export figures, we have assumed that no exports took place because it was too risky to
transport these highly valued assets.
Controls for exogenous shocks
Seasonality: Trading could also have a seasonal pattern, because of the increased availability of
certain types of agricultural produce at certain times of year, or because of the impacts of changing
trade winds on the ease of the transport of goods at different times of year. Finally, Ramadan might
41 Ali et al. (2005) note that even within a single province (Sool) the beneficiaries of US$-denominated cash relief faced
exchange rate variations of 35 per cent.
42 Somalia Water and Land Information Management (SWALIM), www.faoswalim.org.
43 In July 2009 manual rainfall data collection was abandoned in favour of computerized data collection in a small number
of locations. For this reason we have extrapolated the data through 2010 at the last observed level.
44 Menkhaus, Ken (2007) ‘The Crisis in Somalia: Tragedy in Five Acts,’ African Affairs, Vol. 106, No. 204, pp. 357–90.
www.chathamhouse.org 22Programme Paper: Treasure Mapped be a special time for trading activity. We report dummies for the timing of Ramadan and the monsoon seasons where they were statistically significant. World market prices: I use the FAO cereal price index to control for food price changes worldwide. There was a major hike in food prices in 2008, which was only partially reversed in 2009 and 2010. www.chathamhouse.org 23
Programme Paper: Treasure Mapped

APPENDIX II: TABLES AND DISCUSSION OF RESULTS

Table A1: Real wages (daily labour rate/rice price)

                                    Muduq             Nugal         Bari           Banaadir
        Piracy                      0.0370***         0.0658***     0.0463***      -0.0116
        (6 months moving average)   (0.0125)          (0.0134)      (0.0167)       (0.0320)
        FAO food index              -0.0238***        -0.0289***    -0.0294***     -0.0289**
                                    (0.0042)          (0.0047)      (0.0055)       (0.0119)
        SSh / US$                   -0.0675***        -0.1073***    -0.1628***     -0.2288***
                                    (0.0177)          (0.0208)      (0.0235)       (0.0446)
        Missing markets             0.1772***         -0.0497       0.1702**       0.4398***
                                    (0.0612)          (0.0858)      (0.0653)       (0.1171)
        UIC                         0.9027***         0.9466***     1.1931***      4.4345***
                                    (0.3160)          (0.3362)      (0.4234)       (0.8021)
        Southwest                   -0.4804***        -0.1759       -0.2747        -0.6608*
        monsoon
                                    (0.1519)          (0.1676)      (0.2039)       (0.3791)
        Camel exports               0.1269***         0.0787***     0.075**        0.1754***
        (1000s)                     (0.0264)          (0.0282)      (0.0352)       (0.069)
        Constant                    6.990***          10.627***     11.937***      12.997***
                                    (0.4559)          (0.5112)      (0.6096)       (1.1975)
        Number of                   120               111           119            121
        observations

        R-squared                   0.6146            0.6615        0.7267         0.6781

Robust standard errors in parentheses

* significant at 10%; ** significant at 5%; *** significant at 1%

In the models above the effect of the establishment of the pirate industry on the real wage rate is
positive and highly statistically significant in the three regions of Puntland, but there is no significant
effect on the Banaadir region. The analysis also shows that real wages were negatively affected by
rising international food prices and the depreciation of the Somali shilling. The positive and
significant effect on wages associated with the rule of the UIC in June to December 2006 indicates
that casual labourers benefited from improvements in security and governance under the Islamist
rule, particularly in Banaadir. However, the negative coefficient on the missing markets variable
suggests that some forms of labour benefit from local instability, probably because men are drawn
into local militias or migrate. Livestock exports have the expected positive effect on wages
indicating that greater demand for a domestically produced good improves opportunities for local
labour. Finally, the annual southwest monsoon season from June to September makes the import
of foreign goods more difficult and reduces demand for labour and hence wages.

www.chathamhouse.org                24
Programme Paper: Treasure Mapped
Table A2: Exchange rates
% depreciation SSH / % depreciation
US$ SSH / US$
Pirate success(t-5) -0.4464** -0.5901***
(0.2246) (0.2044)
Cattle exports -0.2732*** -0.3459***
(1000s) (0.0752) (0.0707)
FAO food index 0.0691*** 0.0340*
(0.0212) 0.0204
Arbitrage gains XR -0.8731***
(0.2135)
Arbitrage gains rice -0.5954***
(0.1447)
Constant -3.3261 14.4861***
(2.4008) 3.8605
Observations 126 126
R-squared 0.1398 0.3355
Robust standard errors in parentheses
* significant at 10%; ** significant at 5%; *** significant at 1%
The model here analyses the monthly percentage depreciation of the Somali exchange rate, i.e.
the change in the number of Somali shillings needed to buy 1 US$. The negative coefficient on the
piracy and cattle export variables therefore indicate that both types of activity generate foreign
exchange earnings which are converted into SSh, raising its value relative to the US$. Comparing
the size of the two coefficients, the piracy effect is 1.63 or 1.7 times greater than the cattle effect,
which relates to the export of a thousand cattle. The effect of a pirate hijacking success is therefore
comparable to the export of around 1,630–1,700 cattle. We also see that the international rise in
food prices had the predictable effect of increasing the rate of depreciation of the SSh, as
additional US$ were needed to pay for imports. There is also a significant effect of regional price
variation on the exchange rate. When markets are thin and traders charge monopoly prices,
customers reduce their purchases of foreign currency.
www.chathamhouse.org 25You can also read