Trust in government: understanding territorial divides in Australia - OECD Danielle Wood, Grattan Institute 7 July 2021
←
→
Page content transcription
If your browser does not render page correctly, please read the page content below

Trust in government: understanding
        territorial divides in Australia
                                      OECD
             Danielle Wood, Grattan Institute
                                 7 July 2021
Trust in government: understanding territorial
divides
Trust in government was in decline (until COVID)
• Trust in government has been on the decline for more than a decade
• COVID has seen a reversal, particularly for state governments
Low trust is manifesting in a rising ‘protest vote’
• Minor party vote is historically high, particularly in the regions
• Distrust and voting do not appear to be primarily driven by economics
Regions are unhappy – but the problems appear to be cultural
• Incomes are no worse – but population growth is slow
• There’s a growing cultural divide – of identity, not social liberalism
Why is trust falling and what can we do about it?
• Policy failures, corruption of politics, leadership instability
• Policy delivery, reforming political institutions, focus on what can control in
  the regions (services), stop fear mongering on migration                          2
Pre-COVID, trust in the Australian government was at
its lowest on record
Percentage of survey respondents who agree
50%

40%

30%

              People in government can be
20%
              trusted to do the right thing
              (at least ‘sometimes’)
10%

 0%
             1993 1996 1998 2001 2004 2007 2010 2013 2016 2019
Notes and source: Australian Election Study, sample size in 2019 = 5,175 voters.   3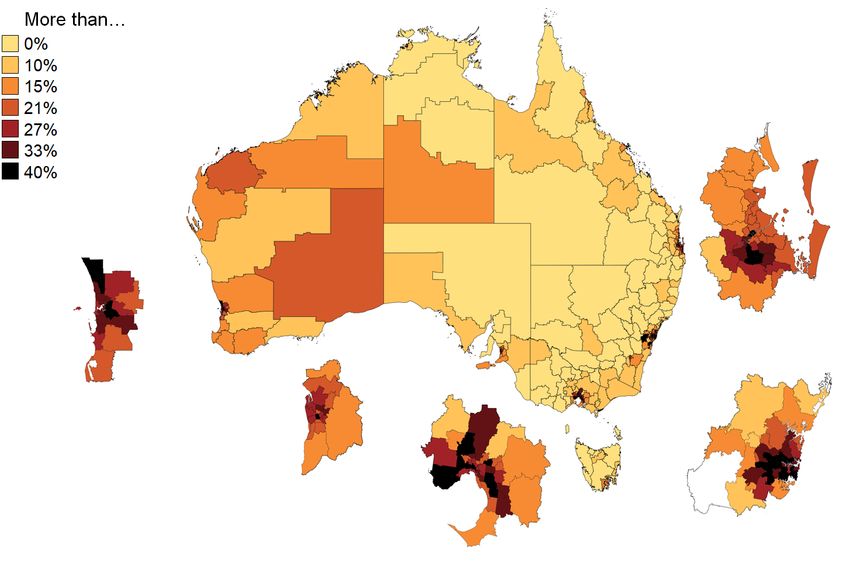
This lack of trust holds across several dimensions
Percentage of survey respondents who agree with selected statements
80%                                                   People in government
70%                                                    look after themselves
                                                       Government is run
60%                                                    for a few big interests
                                                       Politicians don’t know what
50%
                                                       ordinary people think
40%                                                    Not satisfied
30%                                                    with democracy

20%
10%
  0%
           1998 2001 2004 2007 2010 2013 2016 2019
Source: AES 2019.                                                          4
COVID has shifted, both for the Federal government…

60%

50%

40%

30%

20%            The government in Canberra can be trusted to
               do the right thing for the Australian people
10%            (at least ‘most of the time’)
  0%
            2007 2009 2010 2011 2012 2013 2014 2015 2016 2017 2018 2019 2020 2020
                                                                         Jul Nov
Notes: Includes responses of ‘almost always’ and ‘most of the time’.
Source: Scanlon Foundation – Mapping Social Cohesion 2020.                          5
…and for state governments
How well is your state government responding to the pandemic?
(‘very well’ or ‘fairly well’)

                    NSW VIC QLD WA SA                        NSW VIC QLD WA SA
100%

 80%

 60%

 40%

 20%

   0%
                                       Jul-20                      Nov-20
Source: Scanlon Foundation – Mapping Social Cohesion 2020.
                                                                                 6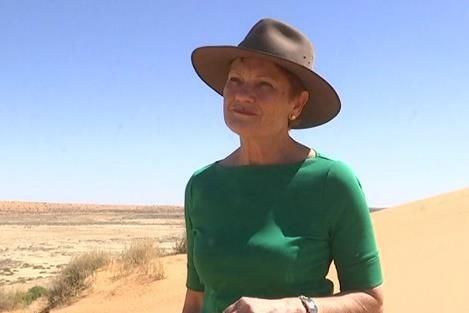
Trust in government: understanding territorial
divides
Trust in government was in decline (until COVID)
• Trust in government has been on the decline for more than a decade
• COVID has seen a reversal, particularly for state governments
Low trust is manifesting in a rising ‘protest vote’
• Minor party vote is historically high, particularly in the regions
• Distrust and voting do not appear to be primarily driven by economics
Regions are unhappy – but the problems appear to be cultural
• Incomes are no worse – but population growth is slow
• There’s a growing cultural divide – of identity, not social liberalism
Why is trust falling and what can we do about it?
• Policy failures, corruption of politics, leadership instability
• Policy delivery, reforming political institutions, focus on what can control in
  the regions (services), stop fear mongering on migration                          7
The minor party vote is historically high
First preference votes to minor parties as a share of the formal vote
               House of Representatives                                                         Senate
35%                                                                  35%

30%                                                                  30%

25%                                                                  25%

20%                                                                  20%

15%                                                                  15%

10%                                                                  10%

 5%                                                                    5%

 0%                                                                    0%
   1950               1975             2000              2025            1950               1975             2000   2025
Source: A.Green data (provided); AEC (2019) Tally Room; Grattan analysis, includes Greens as a minor party                 8
Minor party vote is growing faster in the regions in
Australia
1st preference Senate votes to minor parties (not LNP, Labor, Greens) by election
40%
2016
30%
2013
2010
20% 2004
2007
10%
0%
1 10 100 1000
Distance to State GPO (km, log scale)
Source: AEC, Grattan Institute analysis 9The minor party vote is fragmented, and
partly driven by State-based personalities
First preference Senate vote share, minor parties (not LNP, Labor,
Greens), 2016
Liberal Xenophon
Democrats
30%
Hinch
One
Nation
20% Lambie
10%
All other
(Economic explanations are unconvincing: minor
party vote jumped after incomes rose
Real wages per hour, Index 2002=100 Minor party Senate vote share
109 45%
108 40%
107 35%
106 30%
105 Real wages 25%
(LHS)
104 20%
103 15%
Minor party
102 vote share 10%
101 (RHS) 5%
100 0%
2002 2004 2006 2008 2010 2012 2014 2016
Notes: Nominal wages deflated using RBA’s trimmed mean measure of underlying inflation. Minor party = not LNP, Labor, Greens.
Source: ABS 6345.0, 6401.0; Grattan Institute, A crisis of trust 11Minor party voters aren’t more excited by
redistribution
Percentage of respondents who agree that income and wealth should be
redistributed, by party voted for in the Senate, 2016
100%
80%
60%
40%
20%
0%
GRN ALP LP NP NXT ONP Other
Note: Estimates combine ‘Strongly agree’ and ‘Agree’ response categories. Party voted for in previous election is self-reported.
Source: Grattan analysis of AES 2016
12Minor party voters are different in terms of their lack
of trust, not their economic views
Index of trust in government and big business and index of left-right views,
2016 Pauline Hanson's One Nation is a political party
0.6
More representing the people of Australia who are concerned
that their will is being ignored by the two party
trust system.
LP
Pauline Hanson One Nation Party website
NP
0.4 GRN ALP We stand for:
NXT - Honest and accountable government
Other - Looking after the national interest – not vested interests
0.2 Nick Xenophon Team party website
ONP I became an independent Senator because I could see
Less party politics and self-interest meant elected
trust representatives weren’t putting Tasmania first.
0 Jacqui Lambie Network website
Left-wing
0.2 0.4 0.6 Right-wing
0.8
Source: Grattan analysis of AES 2016 13Trust in government: understanding territorial divides Trust in government was in decline (until COVID) • Trust in government has been on the decline for more than a decade • COVID has seen a reversal, particularly for state governments Low trust is manifesting in a rising ‘protest vote’ • Minor party vote is historically high, particularly in the regions • Distrust and voting do not appear to be primarily driven by economics Regions are unhappy – but the problems appear to be cultural • Incomes are no worse – but population growth is slow • There’s a growing cultural divide – of identity, not social liberalism Why is trust falling and what can we do about it? • Policy failures, corruption of politics, leadership instability • Policy delivery, reforming political institutions, focus on what can control in the regions (services), stop fear mongering on migration 14
Regions have lower incomes, but their growth has
kept up
          Taxable income per filer           Growth in taxable income per filer
               $000 2014-15                      Real CAGR, 2004 to 2015
120                                         10%

100                                          8%
  80
                                             6%
  60
                                             4%
  40
  20                                         2%

    0                                        0%
        1            10       100    1000         1       10       100    1000
                  Distance to GPO, km                 Distance to GPO, km
Source: Grattan analysis of ATO (2016)                                       15
But population growth much stronger in the cities (plus
coast and mining regions)
Population growth by SA3, CAGR 2006-2016
0
0.6%
1.0%
1.3%
1.5%
1.9%
2.9%
Note: Sample is grouped into shrinking areas, and the remainder into seven subsets of equal population.
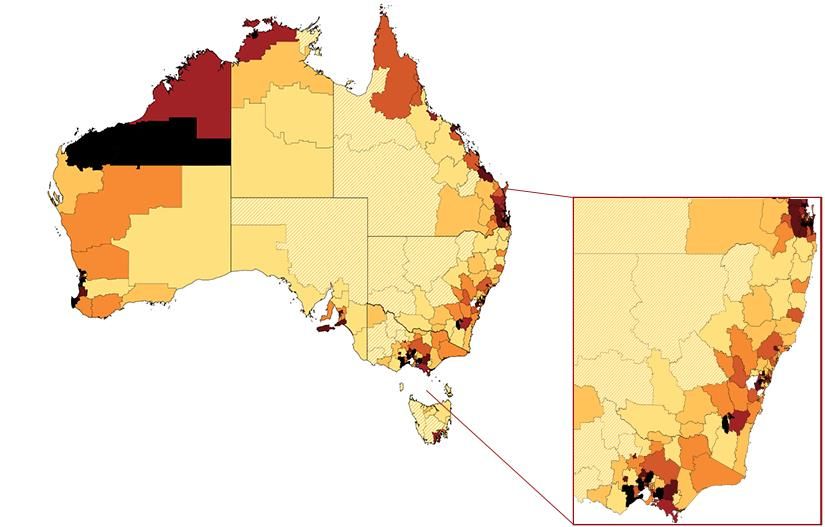
Source: ABS, Census 16Largely because of migration
Migrants as share of population by SA 3, 2016
10%
15%
21%
27%
33%
40%
Note: Sample is grouped into seven subsets of equal population.
Source: ABS, Census 17Regional voters more concerned about immigration
Percentage of respondents who agree that immigrant numbers should be
reduced, by location, 2016
80%
60%
40%
20%
0%
City Large town Country town Rural
Source: Grattan analysis of AES 2016
18And worried about how society is changing
Percentage of survey respondents who agree with selected statements, 2017
80% Major city
Inner regional
Outer regional
60% Remote
40%
20%
0%
Traditional values
traditional_values Everything is changing
changing_too_often
should be upheld too fast
Source: Grattan analysis of Sheppard. 2017. The Political Persona Project. ANU Social Research Centre. 19Cultural symbols are shifting
From Man from Snowy River to MasterChef…..
1982
2018 20And politicians are keen to exploit rising discontent
“Regional people across Australia have grown tired of
being kicked in the guts.’’
Bob Katter in lead up to 2016 Federal election
Regional Queensland is the heart of Queensland and
they have been forgotten for many, many years
Pauline Hanson in lead up to 2018 Queensland election
We acknowledge the vital role rural and regional
Australia plays... Our action plan for regional NSW will
return rights to property owners, protect local jobs and
industries and support regional communities.
Shooters, Famers and Fishers Party website
21Trust in government: understanding territorial divides Trust in government was in decline (until COVID) • Trust in government has been on the decline for more than a decade • COVID has seen a reversal, particularly for state governments Low trust is manifesting in a rising ‘protest vote’ • Minor party vote is historically high, particularly in the regions • Distrust and voting do not appear to be primarily driven by economics Regions are unhappy – but the problems appear to be cultural • Incomes are no worse – but population growth is slow • There’s a growing cultural divide – of identity, not social liberalism Why is trust falling and what can we do about it? • Policy failures, corruption of politics, leadership instability • Policy delivery, reforming political institutions, focus on what can control in the regions (services), stop fear mongering on migration 22
Some causes of falling trust

    Great expectations raised and                                              Political donations – at
dashed, e.g.: housing affordability;                                           least appearance of conflict
                                            Policy           Influence
jobs; cost of living; regional growth                                          Lobbying spending and
                                            failure          of vested         activity is high
      Sense of chaos, e.g.: energy                           interests
                 policy; tax policy                                            Transparency is limited

                                                                                             Politics increasingly a “job
             Media increasingly fragmented,         Fewer                     Un-            for life”
                    creating echo chambers       authoritative           representative
                                                                           democracy         Political parties less
                   Declining trust in experts       voices                                   representative and
                                                                                             membership falling

            “Not the Prime Minister                                 Self-        Abuse of entitlements feeds
                         I voted for”    Leadership              interest of     cynicism
            Personal ambition over        changes                politicians     “Jobs for mates” reduces
                        public good                                              confidence in decisions

                                                                                                                       23
What can governments do? Focus on policies that make a difference to people’s lives • Jobs/growth, health, education AND actually deliver Rebuild institutions • Reform politicians’ entitlements, • Address increasing access of vested interest - lobbying and donations reform • Broaden popular involvement in parties • Reforms to tie hands to reduce ‘misuse of office’ including national integrity commission Regional realism • Don’t promise what can’t control (e.g. population growth) • Increase presence of institutions (cultural, political) • Improve regional services, more local input National identity • Broader of national identity that includes cities and regions • Reduce “national security” fear-mongering • Rhetoric matters – emphasise migrant participation, shared values, not difference 24
You can also read