TUNISIA ECONOMIC MONITOR - Navigating Out of the Crisis Spring 2021 - World Bank Documents
←
→
Page content transcription
If your browser does not render page correctly, please read the page content below

Public Disclosure Authorized   Public Disclosure Authorized          Public Disclosure Authorized     Public Disclosure Authorized

                                                                                                                  Navigating Out

Middle East and North Africa Region
                                                                                             Spring 2021
                                                                                                                     of the Crisis
                                                                                                                                              MONITOR
                                                                                                                                     TUNISIA ECONOMIC
Tunisia
Economic Monitor
 Navigating Out of the Crisis

             Spring 2021

    Middle East and North Africa Region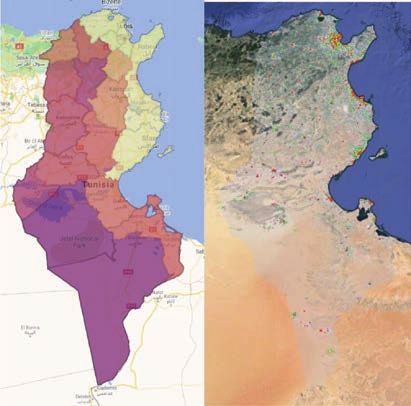
© 2021 International Bank for Reconstruction and Development / The World Bank
1818 H Street NW
Washington DC 20433
Telephone: 202-473-1000
Internet: www.worldbank.org

This work is a product of the staff of The World Bank with external contributions. The findings, interpretations, and conclusions
expressed in this work do not necessarily reflect the views of The World Bank, its Board of Executive Directors, or the
governments they represent.

The World Bank does not guarantee the accuracy, completeness, or currency of the data included in this work and does not
assume responsibility for any errors, omissions, or discrepancies in the information, or liability with respect to the use of or
failure to use the information, methods, processes, or conclusions set forth. The boundaries, colors, denominations, and other
information shown on any map in this work do not imply any judgment on the part of The World Bank concerning the legal
status of any territory or the endorsement or acceptance of such boundaries.

Nothing herein shall constitute or be construed or considered to be a limitation upon or waiver of the privileges and immunities
of The World Bank, all of which are specifically reserved.

Rights and Permissions

The material in this work is subject to copyright. Because The World Bank encourages dissemination of its knowledge, this
work may be reproduced, in whole or in part, for noncommercial purposes as long as full attribution to this work is given.

Any queries on rights and licenses, including subsidiary rights, should be addressed to World Bank Publications, The World
Bank Group, 1818 H Street NW, Washington, DC 20433, USA; fax: 202-522-2625; e-mail: pubrights@worldbank.org.

Cover photos used with the permission of ShutterStock.com.
Publication design and layout by The Word Express, Inc.
TABLE OF CONTENTS
Abbreviations and Acronyms . . . . . . . . . . . . . . . . . . . . . . . . . . . . . . . . . . . . . . . . . . . . . . . . v
Acknowledgements . . . . . . . . . . . . . . . . . . . . . . . . . . . . . . . . . . . . . . . . . . . . . . . . . . . . . .vii
Addendum to the Tunisia Economic Monitor – Spring 2021 . . . . . . . . . . . . . . . . . . . . . . . . . . . . viii
Executive Summary . . . . . . . . . . . . . . . . . . . . . . . . . . . . . . . . . . . . . . . . . . . . . . . . . . . . . ix
Résumé Exécutif . . . . . . . . . . . . . . . . . . . . . . . . . . . . . . . . . . . . . . . . . . . . . . . . . . . . . . . . xi
الملخص التنفيذي. . . . . . . . . . . . . . . . . . . . . . . . . . . . . . . . . . . . . . . . . . . . . . . . . . . . . . . . xv
1. Recent Economic Developments . . . . . . . . . . . . . . . . . . . . . . . . . . . . . . . . . . . . . . . . . . . . 1
Growth and Employment . . . . . . . . . . . . . . . . . . . . . . . . . . . . . . . . . . . . . . . . . . . . . . . . . . . . . . . . . . . . . . . . . . . . . . .1
The Socioeconomic Impact of COVID-19 on Household Welfare . . . . . . . . . . . . . . . . . . . . . . . . . . . . . . . . . . . . . 5
The External Sector . . . . . . . . . . . . . . . . . . . . . . . . . . . . . . . . . . . . . . . . . . . . . . . . . . . . . . . . . . . . . . . . . . . . . . . . . . . 8
Fiscal Policy . . . . . . . . . . . . . . . . . . . . . . . . . . . . . . . . . . . . . . . . . . . . . . . . . . . . . . . . . . . . . . . . . . . . . . . . . . . . . . . . .10
Monetary Policy and Inflation . . . . . . . . . . . . . . . . . . . . . . . . . . . . . . . . . . . . . . . . . . . . . . . . . . . . . . . . . . . . . . . . . . 12
2. Outlook and Risks . . . . . . . . . . . . . . . . . . . . . . . . . . . . . . . . . . . . . . . . . . . . . . . . . . . . .15
Special Focus: Assessment of the Digital Transition in Tunisia . . . . . . . . . . . . . . . . . . . . . . . . . . 19
Why Digitization? . . . . . . . . . . . . . . . . . . . . . . . . . . . . . . . . . . . . . . . . . . . . . . . . . . . . . . . . . . . . . . . . . . . . . . . . . . . . .19
Tunisia’s Digital Strengths . . . . . . . . . . . . . . . . . . . . . . . . . . . . . . . . . . . . . . . . . . . . . . . . . . . . . . . . . . . . . . . . . . . . . 20
Tunisia’s Missed Opportunities and Areas of Improvement . . . . . . . . . . . . . . . . . . . . . . . . . . . . . . . . . . . . . . . . .21
Recommendations to Accelerate the Digital Transformation . . . . . . . . . . . . . . . . . . . . . . . . . . . . . . . . . . . . . . . . 22
List of Figures
Figure 1 Impact of COVID-19 Was Higher than Neighboring Peers… . . . . . . . . . . . . . . . . . . . . . . . . . . . . . . . . . 1
Figure 2 …while Policy Stringency Was More Relaxed . . . . . . . . . . . . . . . . . . . . . . . . . . . . . . . . . . . . . . . . . . . . . 1
Figure 3 Nearly All Sectors Contracted in 2020… . . . . . . . . . . . . . . . . . . . . . . . . . . . . . . . . . . . . . . . . . . . . . . . . . 2
Figure 4 …with Sharper Declines than Regional Peers . . . . . . . . . . . . . . . . . . . . . . . . . . . . . . . . . . . . . . . . . . . . . 2
iiiFigure 5 International Flights Recovered Only Temporarily . . . . . . . . . . . . . . . . . . . . . . . . . . . . . . . . . . . . . . . . . 3
Figure 6 Energy and Mining Sectors Still Far Below Potential . . . . . . . . . . . . . . . . . . . . . . . . . . . . . . . . . . . . . . .3
Figure 7 Household Reported Worsening in Living Standards… . . . . . . . . . . . . . . . . . . . . . . . . . . . . . . . . . . . . . 6
Figure 8 …Particularly among the Lowest Income Groups . . . . . . . . . . . . . . . . . . . . . . . . . . . . . . . . . . . . . . . . . .6
Figure 9 Varying Reasons for the Decline in Business Income . . . . . . . . . . . . . . . . . . . . . . . . . . . . . . . . . . . . . .7
Figure 10 The Deterioration of Welfare Felt among Everyone . . . . . . . . . . . . . . . . . . . . . . . . . . . . . . . . . . . . . . . . 7
Figure 11 Net Exports Shrinks, Moderating the Trade Deficit... . . . . . . . . . . . . . . . . . . . . . . . . . . . . . . . . . . . . . . .8
Figure 12 ...Mainly Caused by Savings on Energy Imports . . . . . . . . . . . . . . . . . . . . . . . . . . . . . . . . . . . . . . . . . . 8
Figure 13 Current Account Deficit Still Wider than Peers... . . . . . . . . . . . . . . . . . . . . . . . . . . . . . . . . . . . . . . . . . . 9
Figure 14 …yet Borrowing Still Largest Source of Financing . . . . . . . . . . . . . . . . . . . . . . . . . . . . . . . . . . . . . . . . . 9
Figure 15 A Narrow Current Account Appreciates the Dinar . . . . . . . . . . . . . . . . . . . . . . . . . . . . . . . . . . . . . . . . 10
Figure 16 Less Pressure on CA Boosts FX Reserves . . . . . . . . . . . . . . . . . . . . . . . . . . . . . . . . . . . . . . . . . . . . . . 10
Figure 17 Fiscal Deficit Balloons Public Debt to Record Levels… . . . . . . . . . . . . . . . . . . . . . . . . . . . . . . . . . . . . 11
Figure 18 …while Subsidies Continue to put Pressure on Budget . . . . . . . . . . . . . . . . . . . . . . . . . . . . . . . . . . . . 11
Figure 19 Despite Rising Concern, Public Wage Bill Grows… . . . . . . . . . . . . . . . . . . . . . . . . . . . . . . . . . . . . . . . 12
Figure 20 …with Interior and Defense Shares Doubling . . . . . . . . . . . . . . . . . . . . . . . . . . . . . . . . . . . . . . . . . . . . 12
Figure 21 Lower Inflation Provides Space for Rate Cuts… . . . . . . . . . . . . . . . . . . . . . . . . . . . . . . . . . . . . . . . . . . 13
Figure 22 …yet Most Credit is Soaked Up by the Public Sector . . . . . . . . . . . . . . . . . . . . . . . . . . . . . . . . . . . . . .13
Figure 23 Output Will Not Recover Before 2024… . . . . . . . . . . . . . . . . . . . . . . . . . . . . . . . . . . . . . . . . . . . . . . . . .16
Figure 24 …due to the Sharper Contraction in 2020 . . . . . . . . . . . . . . . . . . . . . . . . . . . . . . . . . . . . . . . . . . . . . . .16
Figure 25 Maturity of the Pillars of the Digital Economy . . . . . . . . . . . . . . . . . . . . . . . . . . . . . . . . . . . . . . . . . . . . 20
List of Boxes
Box 1 Building a Green, Resilient, and Inclusive Agro-Food Sector . . . . . . . . . . . . . . . . . . . . . . . . . . . . . . . .4
Box 2 How Did COVID-19 Affect Regional Growth? Monitoring Economic Activity
Using Night-Time Lights . . . . . . . . . . . . . . . . . . . . . . . . . . . . . . . . . . . . . . . . . . . . . . . . . . . . . . . . . . . . . . .5
iv TUNISIA ECONOMIC MONITOR – NAVIGATING OUT OF THE CRISISABBREVIATIONS AND
ACRONYMS
AMG2 Assistance Médicale à tarif réduit M3 Broad Money
CBT Banque Centrale de Tunisie (Central Bank MNO Mobile Network Operators
of Tunisia) MVNO Mobile Virtual Network Operator
EFF Extended Fund Facility NPL(s) Non-performing loan(s)
GDP Gross Domestic Product OIT Tunisian Order of Engineers
GIPAC Groupement Interprofessionel des Produit ONAGRI Observatoire National de l’Agriculture
Avicoles et Cunicoles ONH Office National de l’Huile
GIVLAIT Groupement Interprofessionel des Viandes PNAFN Programme national d’aide aux familles
rouges et du Lait nécessiteuses
IFAD International Fund for Agricultural Q-o-Q Quarter over Quarter
Development RFI Rapid Financing Instrument
IMF International Monetary Fund SOE(s) State-owned Enterprise(s)
INS Institut National des Statistaiques STEM Science, Technology, Engineering, and
IRESA Institut de la Recherche et de Math
l’Enseignement Supérieur Agricoles STIR Société Tunisienne Des Industries de
ISP Internet Service Provider Raffinage
LMICs Low- and Middle-Income Countries US$ United States Dollars
vACKNOWLEDGEMENTS
T
he Tunisia Economic Monitor (TEM) presents Professional, HMNHN), Yosra Bouaziz (ET Consultant,
timely and concise assessments of current SMNAG), and Mehdi Barouni (Senior Economist,
economic trends in Tunisia in light of the HMNSP).
country’s broader development challenges. Each It was prepared under the direction of Jesko
edition includes a section on recent economic Hentschel (Country Director, MNC01), Eric Le Borgne
developments and a discussion of the economic (Practice Manager, MTI) and Tony Verheijen (Country
outlook, followed by a special focus section drawing on Manager, MNTCN). The team is grateful to Muna Salim
recent World Bank analytics on Tunisia. The report is (Senior Program Assistant, MTI) and Olfa Limam
intended for a wide audience, including policy makers, (Program Assistant, MNCTN) for their administrative
business leaders, financial market participants, and support.
the community of analysts and professionals engaged The findings, interpretations, and conclusions
in Tunisia. The Tunisia Economic Monitor is a product expressed in this Monitor are those of World Bank
of the Middle East and North Africa (MENA) unit in the staff and do not necessarily reflect the views of the
Macroeconomics, Trade & Investment (MTI) Global Executive Board of the World Bank or the governments
Practice in the World Bank Group. they represent.
The report was prepared by Ali Ibrahim For information about the World Bank and its
Almelhem (ET Consultant, MTI), Mohamed Habib activities in Tunisia, please visit www.worldbank. org/
Zitouna (ST Consultant, MTI) and Shireen Mahdi en/country/Tunisia (English) or www.albankaldawli.
(Senior Economist, MTI). The team included Olivier org/ar/country/tunisia (Arabic).
Durand (Senior Agriculture Economist, SMNAG), Eric For questions and comments on the content of
Raoul Philippe Dunand (Senior Digital Development this publication, please contact Ali Ibrahim Almelhem
Specialist, IDD02), Carlo Maria Rossotto (Digital (aalmelhem@worldbank.org), Massimiliano Cali (mcali@
Development Senior Specialist, BM), Sadok Ayari worldbank.org) or Eric Le Borgne (eleborgne@worldbank.
(External Affairs Associate, ECRMN), and Federica org).
Alfani (ET Consultant, EMNPV). Helpful comments The cutoff date for this edition of the TEM was
were received from Denizhan Duran (Young June 1st, 2021.
viiADDENDUM TO THE
TUNISIA ECONOMIC
MONITOR – SPRING 2021
This issue of the TEM covers political and economic on July 26th. The fall in bond prices is in line with the
developments until June 2021. As such it does not market perception of higher short-term uncertainty on
include the decision, and its potential impact, of public debt sustainability. Hard-currency bonds issued
the Tunisian President Kais Saied to dismiss the by Tunisia’s central bank dropped by record amounts
Prime Minister Hichem Mechichi on July 25th. This on Monday, the 2027 and 2024 dollar-denominated
emergency measure has been the prelude to a bonds both fell more than 5 cents to their lowest in
number of other measures, including the dismissal more than a year. Five-year credit default swaps for
of the minister of defense and the minister of justice, Tunisia’s central bank reached 751 basis points, up
the suspension of parliamentary activities and the one point from Friday’s close. The level has almost
removal of the immunity of members of Parliament. doubled from a year ago.
President Saied also declared a curfew from July Countering this uncertainty is the perception
26th through Friday August 27th, between 7p.m. and by the markets that these measures may help break
6 a.m. At the time of writing the President has yet to the long-standing political impasse on the policy
nominate the new Prime Minister. reform agenda and address the corrupt practices that
These measures are likely to impact the had grown to unprecedented levels in the last few
economy and the reform agenda as well. However, years. Consistent with this view, exchange rates and
it is too early for the TEM to identify such impacts, the stock markets have fluctuated within the normal
which will be covered in the next issue of the TEM. bands in the week of July 26th.
These will include the revised economic projections Much of the outcome could depend on who will
and outlook, with the analysis in this report providing be named as a Prime Minister, and how the President
a baseline prior to the emergency measures. will frame his actions and plans going forward.
The reactions of the markets have been mixed.
Tunisian Government bonds have fallen substantially
viiiEXECUTIVE SUMMARY
Recent Developments percent of GDP (from 8.5 percent a year before),
as a 34 percent drop in the trade deficit reduced
Due to disruptions in international trade and pressure on external balances. The reduction in
tourism triggered by the COVID-19 pandemic, the the trade deficit was led mainly by import demand
Tunisian economy contracted by unprecedented falling faster than exports, and higher energy savings
levels during 2020. Fortunately, recent data caused by lower commodity prices. The narrowing of
indicates that the economy stabilized during the first the current account helped reduce pressure on the
quarter of 2021, with quarter-over-quarter (q-o-q) exchange rate and boost foreign exchange reserves,
growth no longer in negative territory. In comparison which climbed from 112 at the end of 2019 to 158
with regional peers, Tunisia experienced a sharper days of import cover at the end of 2020.
contraction than others, having entered the crisis Although the government has made recent
while already experiencing slow growth, limited fiscal gains in balancing the budget, lower tax revenues
space, and rising debt levels. While the government and higher health-related spending widened the
managed the first phase of the pandemic well from fiscal deficit to 10.4 percent of GDP. Losses in tax
a health standpoint, this early success waned as revenue after the economic fallout of the pandemic
controls were relaxed later in 2020. A record 13.3 was the largest contributor to the widening deficit,
decline in the tradable services sector and a 11.7 followed by an increasingly growing consumer
percent drop in exports contributed towards the subsidy program and transfers to public employees
8.8 percent economic contraction, as weak global and state-owned enterprises (SOEs). Higher health-
demand depressed industrial and tourism exports related expenditures certainly contributed to the large
throughout 2020. As a result, unemployment rose deficit, but will moderate going forward, as some of the
from 14.9 to 17.4 percent, contributing to the wave coronavirus-related stimulus will wane. To finance the
of protests breaking out around the country on the budget, the government quickly mobilized to secure
10-year anniversary of the Arab Spring. Some of the US$6 billion from external lenders, pushing public
recent gains made in poverty reduction will be lost debt levels to 88 percent of GDP. This led credit rating
because the share of the population vulnerable to agencies to downgrade the sovereign credit rating
falling into poverty increased during 2020 due to the of Tunisia, although the risk of debt default “remains
impact of COVID-19 on the economy. highly unlikely.”
Despite this low growth environment, the A declining inflation rate provided much
current account deficit has narrowed to 6.8 needed space for looser monetary policy, as the
ixCentral Bank of Tunisia (CBT) cut rates twice, of the pandemic’s impact on the economy. The
in March and September of 2020. The CBT also financing of the public sector will be particularly
played an active role outside of standard monetary challenging in 2021, with an expected fiscal deficit of
policy by enacting pro-active measures to support the 8.6 percent of GDP, as the authorities deal with the
economy during the pandemic. Without the strong pandemic and maintain support to households, but
fiscal and monetary response from the government with depleted fiscal buffers. In particular, meeting
and the central bank, the impact of the crisis would the 2021 budget’s external financing needs will be
have been far more severe. challenging given the deterioration of the fiscal setting
and the recent sovereign credit rating downgrade.
Structural reforms are on the horizon but
Outlook and Risks will be difficult to implement in a fragile socio-
political environment. In April 2021, the Prime
Output is not projected to return to pre-pandemic
Minister and the Minister of Economy, Finance and
levels until 2024, due to pre-existing structural
Investment announced the government’s broad
weaknesses, a gradual global recovery, and a
economic reform priorities. The main elements were
slow path towards complete vaccination. The real
transitioning from generalized subsidies to targeted
economy is projected to grow by 4 percent in 2021
social assistance, controlling the public sector wage
before quick moderation back to historical growth
bill, SOE governance reforms and restructuring,
rates of 2.2–2.6 percent.1 The magnitude of the
modernization of monetary and financial policies,
recovery will depend on the evolution of the pandemic
digitization (see special focus section) and increasing
in major trading countries and normalization of supply
energy independence through investments in
chains, providing a revival in exports and services.
renewable energy. Such reforms have been on the
The current account deficit is expected to
agenda of every government since the revolution,
widen to 9.2 percent of GDP in 2021 as imports
but have not been implemented because of a lack
begin to recover and commodity prices rise.
of consensus between major stakeholders and an
As the pandemic wanes and trade flows recover,
unstable political and social environment. These issues
manufactured exports and tourism arrivals are
have grown in importance during the pandemic, as
expected to pick-up gradually, supporting a gradual
the government has struggled to convince voters that
reduction in the current account deficit to 8.9 percent
it has a viable plan to create jobs and restore growth.
of GDP by 2023. But risks to the external outlook
A fragmented parliament has made policymaking
remain high, including a sluggish recovery in exports,
cumbersome, complicating the coronavirus response
given the heavy impact of the pandemic on firm
and undermining the effectiveness of the government.
capacity and the pace of recovery amongst Tunisia’s
main trading partners
Financing needs are projected to remain
elevated in the medium term given the extent 1
World Bank April 2021 Forecast (Spring Meetings).
x TUNISIA ECONOMIC MONITOR – NAVIGATING OUT OF THE CRISISRÉSUMÉ EXÉCUTIF
Derniers Développements Il est attendu que les quelques progrès réalisés en
matière de réduction de la pauvreté soient, eux aussi,
En 2020, l’économie tunisienne s’est contractée perdus : en 2020, la part de la population susceptible
à des niveaux sans précédents suite aux pertur- de tomber dans la pauvreté a augmenté en raison
bations que la pandémie de COVID-19 a causées des répercussions de la pandémie de COVID-19 sur
aux échanges internationaux et au tourisme. Fort l’économie.
heureusement, les dernières évolutions indiquent En dépit de ce contexte de faible croissance,
que l’économie s’est stabilisée au cours du premier le déficit du compte courant s’est resserré pour
trimestre de 2021, la croissance en glissement se situer à 6,8 % du PIB (contre 8,5 % une année
trimestriel n’étant plus négative. La Tunisie a connu auparavant), au moment même où la diminution
une contraction plus forte que celle enregistrée du déficit commercial a allégé la pression exer-
par les autres pays pairs de la région, le pays ayant cée sur la balance des paiements. La diminution
affronté la crise alors qu’il pâtissait déjà des effets du déficit commercial s’explique essentiellement par
d’une croissance lente, d’un espace budgétaire limité la rapidité de la diminution des importations compa-
et d’un endettement en hausse. Le gouvernement, qui rativement à celle des exportations. Le resserrement
avait pourtant réussi à gérer la première phase de la du compte courant a permis d’alléger la pression
pandémie d’un point de vue sanitaire, a vu cet acquis exercée sur le taux de change et aidé à renflouer les
s’estomper à mesure que les contrôles commen- réserves en devises qui sont passées de 112 jours
çaient à se relâcher plus tard en 2020. La contraction d’importation fin 2019 à 158 jours d’importations fin
économique, estimée à 8,8 %, a essentiellement été 2020.
provoquée par une baisse record de 13,3 % enregis- En dépit des gains récemment réalisés en
trée au niveau du secteur des services échangeables matière d’équilibre budgétaire, la baisse des re-
et le repli de 11,7 % des exportations, le recul de la cettes fiscales et l’augmentation des dépenses de
demande mondiale ayant réduit les exportations santé ont davantage creusé le déficit budgétaire,
industrielles et touristiques tout au long de 2020. Par le portant à 10,4 % du PIB. Le repli des recettes
conséquent, le taux de chômage est passé de 14,9 % fiscales des suites de l’impact économique causé par
à 17,4 %, alimentant ainsi les vagues de protestations la pandémie de COVID-19 a été le principal respon-
qui ont éclaté un peu partout dans le pays à l’occa- sable du creusement du déficit, suivi du programme
sion du dixième anniversaire du printemps arabe. de subventions aux consommateurs et de transferts
xiaux entreprise publiques. L’augmentation des dé- que les exportations de produits manufacturés et les
penses de santé a, elle aussi, contribué à l’ampleur arrivées de touristes reprennent progressivement,
du déficit, même si l’on s’attend à ce qu’elle s’atténue induisant ainsi une réduction graduelle du déficit de
avec le temps, à mesure que la menace pandémique la balance des paiements à 8,9 % du PIB en 2023.
s’estompe. Pour financer le budget, le gouvernement Toutefois, les risques qui pèsent sur les perspectives
s’est rapidement mobilisé pour obtenir 6 milliards de extérieures restent élevés, notamment eu égard à la
dollars auprès de divers bailleurs extérieurs, ce qui a lenteur de la reprise des exportations, compte tenu
porté le niveau de la dette publique à 88 % du PIB. du lourd impact de la pandémie sur les capacités
Cela a conduit les agences de notation à revoir à la des entreprises et du rythme de la reprise chez les
baisse la note de crédit souverain de la Tunisie, bien principaux partenaires commerciaux de la Tunisie.
que le risque de défaut de paiement “reste hautement On s’attend également à ce que les besoins
improbable”. en financement continuent de grimper sur le
La baisse du taux d’inflation a permis de moyen terme, au vu de l’ampleur de l’impact de
dégager l’espace nécessaire à l’assouplissement la pandémie sur l’économie. Pour 2021, on table
de la politique monétaire, la Banque Centrale de sur des finances publiques en difficulté et un déficit
Tunisie (BCT) ayant réduit ses taux à deux reprises, budgétaire de l’ordre de 8,6 % du PIB. Dans le même
d’abord en mars puis en septembre 2020. La temps, les autorités continuent de lutter contre la
BCT a également joué un rôle actif en se démarquant pandémie et de venir en aide aux ménages dans
de sa politique monétaire conventionnelle et en le besoin, en dépit de l’épuisement des réserves
décrétant un paquet de mesures proactives visant à budgétaires du pays. Il sera particulièrement difficile
soutenir l’économie pendant l’épisode pandémique. de répondre aux besoins de financement extérieur
Sans la forte réponse budgétaire et monétaire du du budget de l’année 2021, au vu de la détérioration
gouvernement et de la BCT, l’impact de la crise aurait du cadre budgétaire et de la récente décote du crédit
été bien plus grave. souverain.
Les réformes structurelles sont difficiles
Perspectives et Risques à mettre en œuvre au vu de la fragilité du
contexte socio-politique. En avril 2021, le chef
Il n’est pas attendu que la production reprenne du gouvernement et le ministre de l’économie, des
ses niveaux pré-pandémiques avant 2024, en finances et de l’investissement ont annoncé les
raison de l’existence de faiblesses structurelles, grandes priorités du gouvernement en matière de
du caractère progressif de la reprise mondiale et réforme économique. Les principales composantes
de la lenteur de la progression de la campagne de de ces réformes ont porté sur : (i) l’abandon
vaccination. Il est prévu que l’économie réelle croisse des subventions universelles en faveur d’une
de 4 % en 2021, avant de revenir rapidement aux taux aide sociale ciblée, (ii) le contrôle de la masse
de croissance habituels de 2,2 %–2,6 %. L’ampleur de salariale du secteur public, (iii) la réforme et la
la reprise va dépendre de l’évolution de la pandémie restructuration de la gouvernance des entreprises
dans les principaux pays qui commercent avec la publiques, (iv) la modernisation des politiques
Tunisie, ainsi que de la normalisation des chaînes monétaires et financières, (v) la numérisation (Se
d’approvisionnement, relançant ainsi les exportations référer à la section dédiée) et (vi) l’amélioration de
et les services. l’indépendance énergétique par l’intensification des
Le déficit de la balance des paiements est investissements dans les énergies renouvelables.
voué à se creuser davantage pour atteindre 9,2% Ces réformes, inscrites à l’ordre du jour de tous les
du PIB en 2021, conséquemment à la reprise des gouvernements depuis la révolution, n’ont jamais
importations et à la hausse des prix des produits été mises en œuvre en raison de l’absence de
de base. A mesure que la pandémie s’estompe et consensus entre les principales parties prenantes et
que les flux commerciaux se rétablissent, on prévoit de l’instabilité de l’environnement politique et social.
xii TUNISIA ECONOMIC MONITOR – NAVIGATING OUT OF THE CRISISCes questions ont pris plus d’importance pendant la Le caractère fragmenté de l’ARP a entravé la mise
pandémie et le gouvernement a des difficultés pour au point de politiques adéquates, compliqué la
convaincre les citoyens qu’il détenait un plan viable réponse à la pandémie et sapé l’efficacité du travail
pour créer des emplois et restaurer la croissance. gouvernemental.
Résumé Exécutif xiiiالملخص التنفيذي
األسعار .وساعد تقلص عجز الحساب الجاري عىل تحفيف الضغط عىل آخر التطورات
سعر الرصف وتعزيز احتياطيات العملة الصعبة التي قفزت من 112
يو ًما من التوريد يف نهاية عام 2019إىل 158يو ًما يف نهاية عام .2020 نتيجة لالضطرابات التي شهدتها التجارة الدولية و قطاع السياحة الناجمة
عن جائحة الكوفيد ،-19سجل االقتصاد التونيس انكامشا مبستويات غري
و عىل الرغم من أن الحكومة قد حققت مكاسب يف اآلونة األخرية عىل مسبوقة خالل عام .2020و لحسن الحظ ،تشري املعطيات األخرية إىل أن
مستوى توازنات امليزانية ،إال أن انخفاض اإليرادات الرضيبية وزيادة االقتصاد يشهد استقرار خالل الثاليث األول من عام ،2021حيث متكنت
اإلنفاق املرتبط بالقطاع الصحي أدى إىل توسيع عجز املالية العامة ليبلغ معدالت النمو من ثاليث إىل آخر ( )q-o-qمن تجاوز املستويات السلبية.
10.4يف املائة من الناتج املحيل اإلجاميل .و ت ُعترب الخسائر يف اإليرادات و باملقارنة مع نظرائها يف املنطقة ،شهدت تونس انكامشً ا أكرث حدة من
غريها من البلدان ،حيث دخلت األزمة بينام كانت تعاين أصال من بطء
الرضيبية بعد التداعيات االقتصادية للجائحة أكرب مساهم يف اتساع
يف نسق النمو ،ومحدودية الحيز املايل ،وارتفاع مستويات الديون .و بينام
العجز ،يليها كل من برنامج دعم املستهلك ،الذي يشهد زيادة مطردة،
متكنت الحكومة من إدارة املوجة األوىل للجائحة بشكل جيد من وجهة
والتحويالت لفائدة املوظفني العموميني والرشكات اململوكة للدولة .و من نظر صحية ،فقد تراجع هذا النجاح املبكر تزامنا مع تخفيف اإلجراءات
املؤكد أن النفقات املرتفعة املرتبطة بالصحة قد ساهمت يف اتساع العجز، االحرتازية يف وقت الحق من عام .2020وساهم الرتاجع القيايس املسجل
لكنها ستصبح معتدلة يف املستقبل ،حيث ستختفي بعض العوامل املرتبطة يف قطاع الخدمات القابلة للتداول التجاري بنسبة 13.3٪وانخفاض
بفريوس كورونا .و لتمويل امليزانية ،قامت الحكومة بتعبئة املوارد بشكل الصادرات بنسبة 11.7٪يف انكامش اقتصادي بنسبة ،8.8٪حيث أدى
رسيع لتأمني 6مليار دوالر من قبل املانحني الدوليني ،مام رفع مستويات ضعف الطلب العاملي إىل تراجع الصادرات الصناعية والسياحية طوال
الدين العام إىل 88يف املائة من الناتج املحيل اإلجاميل .وقد أدى ذلك عام .2020ونتيجة لذلك ،ارتفعت معدالت البطالة من 14.9٪إىل
إىل قيام وكاالت التصنيف االئتامين بخفض التصنيف االئتامين السيادي ،17.4٪مام ساهم يف اندالع موجة من االحتجاجات يف جميع أنحاء البالد
(الرتقيم السيادي) لتونس ،عىل الرغم من أن مخاطر التخلف عن سداد مبناسبة الذكرى العارشة للربيع العريب .باالضافة إىل ذاك ستخرس تونس
الديون «ال تزال غري مرجحة إىل حد كبري». بعض املكاسب األخرية التي تحققت يف مجال الحد من الفقر ألن نسبة
السكان املعرضني للوقوع يف براثن الفقر ارتفعت خالل عام 2020بسبب
و أدى انخفاض نسبة التضخم إىل توفري مساحة رضورية من أجل تداعيات جائحة الكوفيد-19عىل االقتصاد.
سياسة نقدية أكرث مرونة ،حيث قام البنك املركزي التونيس بخفض
و رغم هذه البيئة التي تتسم بانخفاض معدالت النمو ،فقد تقلص
أسعار الفائدة مرتني ،يف مارس وسبتمرب من عام .2020لعب البنك عجز الحساب الجاري إىل 6.8٪من إجاميل الناتج املحيل (من 8.5٪
املركزي التونيس أيضً ا دو ًرا نشطًا خارج السياسة النقدية التقليدية يف العام السابق) ،حيث أدى انخفاض العجز التجاري بنسبة 34٪إىل
من خالل وضع تدابري استباقية لدعم االقتصاد أثناء الجائحة .و لوال تخفيف الضغط عىل التوازنات الخارجية .و كان االنخفاض يف العجز
االستجابة املالية والنقدية القوية من الحكومة والبنك املركزي ،لكان التجاري مدفو ًعا بشكل أسايس بانخفاض الطلب عىل الواردات بوترية
تأثري األزمة أكرث حدة. أرسع من الصادرات ،مدخرات عيل تكاليف الطاقة بسبب انخفاض
xvالعمومي تحديًا خاصا يف عام ،2021يف ظل عجز مايل متوقع بنسبة 8.6 اآلفاق واملخاطر
يف املائة من إجاميل الناتج املحيل ،حيث ستواصل السلطات التعاطي مع
الجائحة و دعم األرس ،ولكن مع استنفاد االحتياطيات الوقائية .و عىل ليس من املتوقع أن يعود الناتج إىل مستويات ما قبل الجائحة قبل حلول
وجه الخصوص ،ستمثل تلبية احتياجات التمويل الخارجي مليزانية 2021 عام ،2024و يعود ذلك إىل نقاط الضعف الهيكلية املوجودة من قبل ،و
تحديا كبريا نظ ًرا لتدهور الوضع املايل وخفض التصنيف االئتامين السيادي النسق التدريجي لالنتعاش العاملي ،و النسق البطيء لعملية التطعيم.
يف اآلونة األخرية. من املتوقع أن ينمو االقتصاد الحقيقي بنسبة 4يف املائة يف عام 2021قبل
أن يرتاجع برسعة إىل معدالت النمو التقليدية البالغة 2.2إىل 2.6يف املائة.
رغم التخطيط للقيام باإلصالحات الهيكلية سيكون من الصعب تنفيذها و سيعتمد حجم االنتعاش عىل مدى تطور الجائحة يف البلدان التجارية
يف بيئة اجتامعية وسياسية هشة .يف أبريل ،2021أعلن رئيس الحكومة الكربى و عودة سالسل التوريد إىل وضعها الطبيعي ،مام يوفر انتعاشً ا يف
ووزير االقتصاد واملالية و دعم االستثامر عن الخطوط العريضة ألولويات الصادرات والخدمات.
اإلصالح االقتصادي للحكومة .و متثلت العنارص الرئيسية يف :االنتقال من
الدعم الشامل إىل املساعدات االجتامعية املوجهة ،والتحكم يف كتلة أجور من املتوقع أن يتسع عجز الحساب الجاري ليبلغ 9.2٪من إجاميل
القطاع العمومي وإصالحات حوكمة الرشكات العمومية وإعادة هيكلتها، الناتج املحيل يف عام 2021تزامنا مع بدء انتعاش الواردات وارتفاع
وتحديث السياسات النقدية واملالية ،والرقمنة (انظر قسم الرتكيز الخاص) أسعار السلع األساسية .حيث أنه بانحسار الجائحة و انتعاش التدفقات
و دعم االستقالل الطاقي من خالل االستثامرات يف الطاقات املتجددة. التجارية ،من املتوقع أن تنتعش الصادرات الصناعية و يرتفع عدد السياح
و املالحظ هو أن هذه اإلصالحات كانت دامئا مضمنة يف برنامج كل الوافدين تدريجياً ،مام يساعد عىل التخفيض التدريجي لعجز الحساب
الحكومات املتعاقبة منذ الثورة ،لكنها مل تُنفذ بسبب عدم التوصل إىل اتفاق الجاري ليبلغ 8.9يف املائة من الناتج املحيل اإلجاميل بحلول عام .2023
بني األطراف الفاعلة و بسبب عدم استقرار البيئة السياسية واالجتامعية .و لكن املخاطر عىل التوقعات الخارجية ال تزال مرتفعة ،مبا يف ذلك انتعاش
ازدادت أهمية هذه القضايا خالل الجائحة ،حيث بذلت الحكومة مجهودا بطيء يف الصادرات ،بالنظر إىل التأثري الكبري للجائحة عىل قدرات الرشكات
من أجل إقناع الناخبني بأن لديها خطة قابلة للتطبيق ستساهم يف خلق ووترية التعايف لدى الرشكاء التجاريني الرئيسيني لتونس.
فرص العمل واستعادة معدالت النمو .و باإلضافة إىل ذلك ،فقد جعل عدم
فاعلية العمل الربملاين جعلت عملية صنع السياسات مرهقة ،مام يعقد من املتوقع أن تظل احتياجات التمويل مرتفعة عىل املدى املتوسط
االستجابة لجائحة الكوفيد -19ويقوض فعالية العمل الحكومي. بالنظر إىل مدى تأثري الجائحة عىل االقتصاد .و سيمثل متويل القطاع
xvi TUNISIA ECONOMIC MONITOR – NAVIGATING OUT OF THE CRISIS1
RECENT ECONOMIC
DEVELOPMENTS
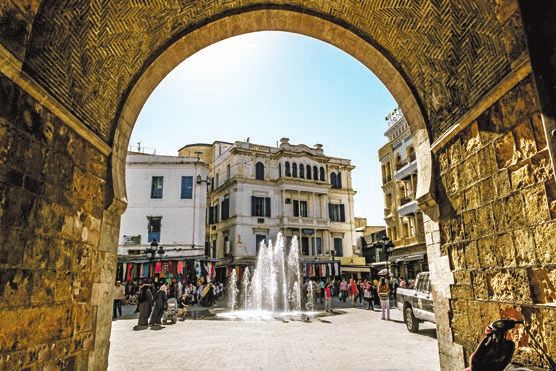
Growth and Employment and reduce pressure on hospital and medical staff.
As policy measures were relaxed over the Summer of
By mid-2021, the Tunisian economy began to 2020, new cases emerged (Figures 1 & 2). Managing
stabilize after a difficult year of managing the this second wave of the virus was complicated by the
pandemic. The impact of the pandemic has been political uncertainties created by the government’s
more strongly felt than in neighboring countries resignation in July 2020. In September, a new
and will require careful planning to pull the government was formed with the daunting task of
economy out of the recession. managing increasingly difficult health, economic,
The road to Tunisia’s recovery is long. and social conditions. Containment measures were
The initial containment measures imposed during imposed throughout the rest of 2020 including
March 2020 helped control the spread of the virus curfews, restrictions on movement between regions,
FIGURE 1 • Impact of COVID-19 Was Higher than FIGURE 2 • …while Policy Stringency Was More
Neighboring Peers… Relaxed
COVID-19 new cases and deaths COVID-19 policy stringency index
25,000 800 100
700 90
20,000 80
Stringency index
600 70
500 60
15,000 50
400 40
10,000 300 30
20
200 10
5,000
100 0
Jan-20
Feb-20
Mar-20
Apr-20
May-20
Jun-20
Jul-20
Aug-20
Sep-20
Oct-20
Nov-20
Dec-20
Jan-21
Feb-21
0 0
Tunisia Morocco Egypt Algeria
Cases (per million) Deaths (per million) Tunisia Algeria Morocco Egypt
Source: MENA Crisis Tracker, World Bank. Source: Johns Hopkins Coronavirus Resource Center.
1FIGURE 3 • Nearly All Sectors Contracted in FIGURE 4 • …with Sharper Declines than Regional
2020… Peers
100% 4 Regional comparison of GDP growth
80% 8
2
Growth (%) by sector (YoY)
GDP growth (%) YoY
60% 6
40% 0
Real GDP growth (percent)
4
20% –2
0% 2
–20% –4 0
–40% –6 –2
–60%
–8 –4
–80%
–100% –10 –6
2015 2016 2017 2018 2019 2020 2021 –8
(Q1)
–10
Agriculture Manufacturing industries 2019 2020 2021 2022
Non-manufacturing industries Tradable services
Non-tradable services GDP growth Jordan Egypt Morocco Tunisia
National Institute of Statistics (INS). World Bank, MENA Economic update, April 2021.
alternating work in the public sector, and limiting Lower domestic and public sector demand are also
capacity in the hospitality sector. These policy affecting output as private consumption contracted
responses helped reduce pressure on a health by 3 percent while public consumption fell by 11.4
system with limited capacity and reduced the negative percent owing to lower revenues. Some of the recent
repercussions on both lives and livelihoods. Despite gains made in poverty reduction will be lost as the
these measures, a third wave of cases began to rise share of the population vulnerable to falling into pov-
toward the end of the year, highlighting the difficulty of erty increased because the share of the population
managing the pandemic. vulnerable to falling into poverty increased during
The real economy contracted by unprece- 2020 (See Box 3).
dented levels in 2020 as Tunisia’s high exposure Services and export-oriented sectors were
to Europe weighed negatively on demand. The hit hard amid strong economic headwinds from
Tunisian economy saw an unprecedented 8.8 per- the pandemic. The services sector represents over 60
cent contraction for the entire year (Figure 3). The percent of GDP and was hit by a 13.3 percent decline
majority of the decline was registered during the in the tradable services sector, mostly concentrated in
second quarter (–21 percent y-o-y), during which transportation and hospitality. Although interregional
time that the pandemic’s effect on the economy flights showed some recovery during the summer
strengthened. Recent data shows that economic per- months, they sharply declined towards the end
formance is still affected by the pandemic, although of the year, primarily from the uncertainty caused
at a lower rate, with a 3 percent contraction y-o-y in by the pandemic (Figure 5). These declines were
the first quarter of 2021. The pandemic has under- slightly offset by modest growth in agro-food and
lined Tunisia’s high exposure to economic conditions petroleum refining sectors thanks to a favorable
in Europe in terms of trade, tourism, remittances, and harvest and resumption of activity in the national
investment. Weak demand in Europe, the destina- refining industry (Société Tunisienne des Industries
tion of more than 75 percent of Tunisian exports, will de Raffinage – STIR). Industrial production declined
continue to weigh on domestic growth and the pace 5.2 percent as both the domestic economy and major
of recovery in the near term. In fact, Tunisia’s high trading partners registered negative growth for 2020.
trade openness among MENA countries and heavy Similarly, manufacturing and non-manufacturing
emphasis on services has caused a sharper contrac- industries contracted by 9.3 and 8.8 percent during
tion in comparison with regional peers (Figure 4). 2020. In the first quarter of 2021, exports increased
2 TUNISIA ECONOMIC MONITOR – NAVIGATING OUT OF THE CRISISFIGURE 5 • International Flights Recovered Only FIGURE 6 • Energy and Mining Sectors Still Far
Temporarily Below Potential
Weekly interregional flights Energy and minig industrial production
1.2 120
Interregional flights (index)
1.0 100
0.8 80
0.6 60
0.4 40
0.2 20
0.0 0
May-20
May-11
May-13
May-15
May-17
May-19
Aug-20
Mar-20
Dec-20
Mar-21
Sep-20
Sep-10
Sep-12
Sep-14
Sep-16
Sep-18
Sep-20
Nov-20
Feb-20
Feb-21
Jun-20
Jan-20
Jan-21
Jan-10
Jan-12
Jan-14
Jan-16
Jan-18
Jan-20
Apr-20
Oct-20
Jul-20
Egypt Algeria Morocco Tunisia Mining Energy IPI
World Bank, Global Aviation Dashboard. INS.
by 6.2 percent compared to the first quarter of 2020 had steadily grown over the years, but is now down 21
while imports increased by 1.5 percent over the same percent compared to the beginning of 2020.
period, signaling the beginning of recovery for some Domestic and international containment
sectors. Exports in the mechanical and electrical measures are weighing on the income-generating
sector increased by 12.1 percent and those of the role of the private sector, jeopardizing social and
textile-clothing-leather sector rose by 6.5 percent, while economic stability. A survey of 2,500 private firms in
those of the mining and energy sector decreased by November-December 2020 revealed that 65 percent
18.3 percent and 15.3 percent respectively. Imports of firms risk permanent closure in the next 12 months,
by the agriculture and agro-food sector increased by and only 30 percent were confident they would sur-
20.9 percent and those of the mining sector rose by vive until next year. By the end of the 2020, a total of
13.4 percent. 21.6 percent of companies were either permanently
Protests at energy and mining sites caused or temporarily closed. Over 80 percent of businesses
large swings in production, reducing tax reve- saw a drop in demand, and as a result fired employ-
nues and development opportunities for lagging ees (26 percent) or cut wages (15.7 percent). The risk
regions. The energy and mining sectors play impor- of permanent closure was highest among micro-enter-
tant roles in the regional development—especially for prises (70 percent), SMEs (62 percent), non-exporting
lagging regions—but also provide strong buffers to firms (70 percent), and large companies (48 percent).
external balances and tax revenues at the national Amid strong headwinds from the pandemic, the pri-
level. These sectors saw a sharp decline in produc- vate sector has made little headway in its struggle to
tion (–80 percent) after the 2011 revolution and they improve living standards and incomes, exacerbating
remain well below potential (Figure 6). During 2020, already simmering unrest.
mining production declined 13 percent after oil and Unemployment was high before the pan-
phosphate production was disturbed following social demic and worsened to 17.8 percent in 2021. The
unrest and regular protests in the southern regions. labor force participation rate for women has improved
Most of the energy and mining sites are located in the by 4 percent over the past ten years, offset by an
poorest parts of the country with high unemployment
and are more sensitive to economic swings. Protests 2
For instance, in July, miners in Tataouine closed the
began to appear in May 2020 near older sites in
valves for local distribution as a protest against the failure
Tataouine and Gafsa, but also in the recently started to implement an agreement the government signed on in
Nawara gas field.2 Following the sharp decline imme- November 2019, which provided for thousands of new
diately post-revolution, total phosphate production jobs for the region.
Recent Economic Developments 3BOX 1. BUILDING A GREEN, RESILIENT, AND INCLUSIVE AGRO-FOOD SECTOR
The agro-food sector demonstrated sound resilience during the Economic growth by sector (%)
COVID-19 pandemic, but at the same time lockdown measures 15
again confirmed the limited economic inclusion of smallholder 10
farmers. Unlike tourism and manufacturing sectors, agroculture 5
contributed positively to growth during the pandemic, providing a
0
small boost to food processing industries due to favorable harvest
conditions. At the start of the pandemic, the cereal production –5
campaign was already well advanced, and the olive harvest and –10
oil processing were almost completed. During the lockdown, –15
only the fishery industry was put to a complete halt with a severe 2016 2017 2018 2019 2020
impact on fishermen revenues. Subsectors linked to the tourism Agriculture and fisheries
industry (poultry and meat) suffered from a serious demand Manufacturing industries
reduction. As part of a qualitative survey carried out by the Bank Non-manufacturing industries
in June 2020, 70 agro-industries were interviewed on the impact Market services
of the COVID-19 crisis on their activities. With the exception of the Non-market activities (admin, domestic services, etc.)
fishery and poultry subsectors, agro-industry representatives did
not mention serious disruption in supply or commercialization
as a concern but highlighted their major constraints as staff Sub-sector annual production versus 2010–2020 average
100%
reduction and rotation, and the additional costs associated with
80%
sanitary measures. No severe disruption was recorded in food
supply to urban markets and medium and large commercial farms 60%
remained connected to export markets. 40%
Source: Institut National des Statistaiques (INS) and Livret annuel 20%
des statistiques agrocoles 2018 (Direction Générale des études et 0%
de développement agrocole), Observatoire National de l’Agroculture –20%
(ONAGRO), Groupement Interprofessionnel des Viandes rouges et
du Lait (GIVLAIT), Groupement Interprofessionnel des Produits –40%
Avicoles et Cunicoles (GIPAC), Office National de l’Huile (ONH) –60%
2015 2016 2017 2018 2019 2020
However, the crisis has had a higher impact on smallholders and
had once again revealed their recurrent disconnect from input Wheat Olive oil Dates
Fisheries Poultry farming Dairy milk
and output markets, their limited economic inclusion, and their
vulnerability to shocks. During the lockdown, and in the absence
of well-structured producer organizations and cooperatives,
more than 80 percent of small farmers could not access agroculture inputs and commercialize their produce. As part of a field survey,
carried out by L’institution de la Recherche et de l’Enseignement Supérieur Agrocoles (IRESA) and International Fund for Agrocultural
Development (IFAD) in June 2020, 82.5 percent of small producers in the north (Siliana and Jendouba), 79 percent in the center (Kairouan
and Mahdia) and 83.5 percent in the south (Kébili et Médenine) declared that they had to reduce their agrocultural activities because they
could not purchase inputs, especially seeds, fertilizer, and animal feed, and were unable to commercialize their produce, especially dairy
and vegetable productions. Access to temporary agrocultural work in larger farms and other off-farm job opportunities was also a major
concern for small producers. As movement restrictions were eased for agrocultural activities, the situation improved but this experience
confirmed the vulnerability of smallholder farmers, whose contribution to the country’s food security is important.
According to the last agrocultural census (ONAGRO 2005), Tunisian smallholder farmers represent 21.5 percent of the cultivated area
but contribute to a large share of the domestic food production. Of the half million farms in Tunisia, 88 percent are family farms and 75
percent hold less than 10 hectares, but these represent 62 percent of the cereal production. But, only 5 percent of the Tunisian farmers
belong to a producer organization and only 7 percent have access to credit.
Smallholder farmers remain isolated and vulnerable, but digital technologies have a significant potential to strengthen their
resilience, and to ensure their financial and economic inclusion. In this context, characterized by a general defiance from farmers vis-
à-vis cooperatives, digital technologies offer solutions to connect small producers to a wide range of technical and financial services, and
to overcome market failures in the agro-food sector, such as market power, information asymmetries, and transaction costs. Digital tools
can help small farmers remain connected with input suppliers, get up-to-date market information, and access technical information (such
as plant disease identification or vet care advice) in order to become more resource-efficient and climate-resilient. Electronic marketing
platforms have started to offer fresh vegetable produce to urban consumers. Digital technologies such as mobile money, digital credit
(continued on next page)
4 TUNISIA ECONOMIC MONITOR – NAVIGATING OUT OF THE CRISISBOX 1. BUILDING A GREEN, RESILIENT, AND INCLUSIVE AGRO-FOOD SECTOR (continued)
scoring, and remote sensing for insurance design have the potential, in rural areas especially, to reduce high transaction costs for credit
access related to isolation, small scale, and risks. The Tunisian government is providing support to smallholders in the form of investment
subsidies that they may not always be able to access independently due to administrative hurdles and requirements, literacy capacities, and
other reasons. With higher levels of digital inclusion for farmers, these public support programs could become better targeted to the most
vulnerable producers, and thereby be delivered in a more efficient and equitable manner.
BOX 2. HOW DID COVID-19 AFFECT REGIONAL GROWTH? MONITORING ECONOMIC ACTIVITY USING
NIGHT-TIME LIGHTS
Did COVID–19 affect growth in some regions of Tunisia more
than others? We use satellite data on night–time lights, as a proxy
to GDP growth, to explore the spatial distribution and evolution
of the pandemic’s in Tunisia. The left panel shows the average
luminosity by governate in 2019, while the right panel shows NTL
gains (green) and losses (red) during 2020. Coastal governates
emit the most NTLs given their large manufacturing, trade, and
services sectors, while still developing inland and Southern
governates are less bright. During 2020 however, the brightest
coastal cities exhibited the sharpest declines. The largest
contractions (year–on–year) were concentrated in Tunis (–10.7
percent), Ariana (–8.4 percent), Monastir (–8 percent), Sousse
(–7.2 percent), Ben Arous (–6.5 percent), Nabeul (–4.6 percent),
Manouba (–4.0 percent), Bizerte (–3.7 percent), Medenine (–2.6
percent), Mahdia (–2.5 percent), Gabes (–2.3 percent), Sfax
(–1.1 percent).
equal decline for men. However, the employment rate
percent in the agriculture and fishing sector as of
for men is 60 percent on average while for women
2021. Most of these sectors registered contractions
the rate is only 20 percent. Before the pandemic, the
in 2020, particularly in services and export-oriented
unemployment rate stood at 14.9 percent and initially
industries. The unemployment rate for females is far
spiked to 18 percent in the second quarter of 2020
higher than that for men (24.9 vs. 14.4 percent) and is
in response to the challenges presented by the pan-
disproportionally concentrated in the interior regions
demic. After moderating to 16 percent in October, the
of the country. The unemployment rate for university
rate rose sharply to 17.4 percent by the end of the
graduates continues to be above the national aver-
year. This resulted in a 78,000 increase in the num-
age, highlighting the limited job opportunities for
ber of unemployed persons during the fourth quarter,
high-skilled workers and the structural mismatch in
and an increase of 133,000 for the entire year. This
the labor market.
increase in unemployed definitely contributed to the
wave of protests breaking out around the country and
will continue to weigh heavily on recovery efforts. An The Socioeconomic Impact of
analysis of the distribution of employees shows that COVID-19 on Household Welfare
52.8 percent are in the service sector, 17.9 percent
in the manufacturing industries sector, 16.0 percent Living standards have deteriorated for about half
in the non-manufacturing industries sector, and 13.3 of Tunisian households through the COVID-19
Recent Economic Developments 5FIGURE 7 • Household Reported Worsening in living standards of Tunisian households, particularly
Living Standards… among the most vulnerable (i.e., the bottom 40 per-
cent of the consumption distribution). More than half
Round 5 14.3 31.6 50.0 3.7 0.3 of the households interviewed report a worsening of
Round 4 10.9 32.0 50.4 6.6 0.2
their living standards relative to before the start of
the pandemic in March 2020 (Figure 7). This effect
Round 3 15.4 33.9 46.6 4.1 moderated to 42.9 percent in the second half of the
Round 2 21.7 32.4 42.3 3.5 June (round 4) but rose again to 45.9 percent in the
first half of October (round 5).
0% 20% 40% 60% 80% 100% Living standards particularly worsened
Percent
among the poor and the bottom 40 percent.
Much worse Worse Same
In May 2020, 66.9 percent of households in the
Better Much better
lowest consumption quintile reported that their living
Source: Alfani et al., 2021. Estimation based on data from the Enquête téléphonique standards had worsened, compared to the situation
auprès des ménages pour étudier et suivre l’impact du COVID19 sur le quotidien des
Tunisiens, Institut national de la statistique (INS) and World Bank. they faced in March (Figure 8). Estimates show that the
probability of declaring a worsening in living standards
is positively correlated with a lower degree of education
level of the household head and with being younger.
pandemic. Between March and October 2020, the Individuals not employed at the time of the survey, the
Institut National de la Statistique (INS), in collabora- self-employed, and contributing family workers have a
tion with the World Bank, implemented five rounds of higher probability of reporting a deterioration of their
high-frequency telephone surveys. This nationally rep-
resentative panel dataset of about 1,000 households 3
Results reported in this section have been extracted
allowed the assessment of the socioeconomic impact
from Alfani F., Dhrif D., Molini V., Pavelesku D., Ranzani
of the COVID-19 over time. The survey results3 indi- M. 2021. “Living Standards of Tunisian Households in
cate that the combined public health and economic the midst of the COVID-19 Pandemic,” World Bank Policy
crises have had a sizeable negative effect on the Research Working Paper, Forthcoming.
FIGURE 8 • …Particularly among the Lowest Income Groups
Round 2 Round 3
0.1 0.1
100% 1.1 0.9 3.4 4.7 6.6 100% 3.2 2.6 6.0 5.2 3.2
80% 32.0 31.2 40.0 80% 32.3 38.5 44.9
48.6 56.2 52.4 60.6
Percent
Percent
60% 60%
32.4 36.8 39.7
40% 32.9 32.9 40% 39.0
27.3 33.6 32.3 26.4
20% 34.5 31.1 20%
23.7 13.8 9.8 24.8 20.0 16.5 10.1 9.7
0% 0%
20% poorest 2 3 4 20% richest 20% poorest 2 3 4 20% richest
Round 4 Round 5
0.9 0.7
100% 4.6 3.3 9.4 8.2 6.9 100% 1.4 4.4 3.9 4.1 4.1
80% 36.9 42.2 80% 37.4 48.6 44.9
49.0 56.8 63.0 55.7 59.4
Percent
Percent
60% 60%
40% 35.4 40% 45.3 26.6
39.9 31.9
20% 33.3 27.9 23.9 20% 30.0 28.3
22.0 14.7 8.3 7.1 5.3 15.9 20.3 18.4 9.5 8.2
0% 0%
20% poorest 2 3 4 20% richest 20% poorest 2 3 4 20% richest
Much worse Worse Same Better Much better
World Bank, MENA Economic update, April 2021
6 TUNISIA ECONOMIC MONITOR – NAVIGATING OUT OF THE CRISISliving standards. Similarly, in the following rounds, Safety net programs mitigated only par-
the percentage of households declaring worsening tially the negative effects of COVID-19 on the
living standards is consistently higher at the bottom poorest and more vulnerable ones. Although
of the consumption distribution than the top. While public transfers, and particularly social protection
waiting for the economy to rebound, most vulnerable systems, usually provide a safety net for those who
households will continue to need income support. lose their job giving them the means to look for new
A lack of demand from clients was the employment, this kind of mitigation measures are
primary contributing factor to a significant labor limited in scope and insufficient to avoid significant
income decline among the self-employed. By increases in poverty. High unemployment and levels
October 2020, incomes had not yet bounced back to of informality has created low coverage rates in the
the level observed before the onset of the COVID-19 country, although Tunisia has a comprehensive
pandemic, with labor income getting worse among social insurance system in place. Shortly after the
the self-employed (Figure 9). The main element COVID-19 outbreak and subsequent lockdown, the
cited by respondents for their fall in income was a government introduced short-term work schemes
lack of customers since the re-opening (from 28.3 which included a wage subsidy of DT 200 per month
percent in May to 47.6 percent in October). On the in April and May 2020 and a one-off cash transfer
other hand, the lockdown and subsequent closure of DT 200 for micro-enterprises (forfaitaire). About
of workplaces was the main reason for the reduction 110,000 micro-enterprises received the transfer,
in income for 49.8 percent of self-employed in while about 140 000 retirees whose monthly pension
early May (round 1) and 53.4 percent in late May is below TND 180 received 100 TND pension top-
(round 2). up. In addition, about 1 million poor and vulnerable
FIGURE 9 • Varying Reasons for the Decline in FIGURE 10 • The Deterioration of Welfare Felt
Business Income among Everyone
Male household head **
Round 5 47.3 16.8 29.0 6.5 **
35–44
45–64 ***
1.7 65+ ***
Round 4 50.4 10.8 37.1 Primary education **
Secondary education **
Tertiary education ***
Round 3 10.1 38.3 5.6 10.8 20.9 14.3 Not employed ***
Private sector employee **
Self employed/employer ***
4.8
Partial salary ***
Round 2 53.4 28.4 8.0 5.4 *
No salary
Lower/No business income ***
1.9 2nd consumption quintile ***
Round 1 49.8 28.3 6.7 13.3 3rd consumption quintile ***
4th consumption quintile ***
0% 20% 40% 60% 80% 100% 5th consumption quintile ***
Percent Round 4 ***
Round 5 ***
Closure of the establishment Lack of customers –0.2 0.0 0.2 0.4 0.6
Lack of raw Inability to
materials/manpower move/transport goods Welfare deterioration
Lack of liquidity Other reasons Note: Probability of declaring a deterioration in living standards, as compared to the
month before the interview. Estimation coefficients of the linear probability model.
Source: Alfani et al., 2021. Estimation based on data from the Enquête téléphonique Reference categories: 15–34; no education; public sector employee; full salary,
auprès des ménages pour étudier et suivre l’impact du COVID19 sur le quotidien des business income as usual or more than usual; Quintile 1; Round 3. Robust standard
Tunisiens, Institut national de la statistique (INS) and World Bank. errors in parentheses. Statistical significance: *** p < 0.01, ** p< 0.05, * p < 0.1.
Recent Economic Developments 7You can also read