TURNING ROUND A HIGH-GRADE COPPER/GOLD MINE IN CANADA AS A PLATFORM TO PROFITABLE FUTURE GROWTH
←
→
Page content transcription
If your browser does not render page correctly, please read the page content below
TURNING ROUND A HIGH-GRADE COPPER/GOLD MINE IN CANADA AS
            A PLATFORM TO PROFITABLE FUTURE GROWTH

INVESTOR PRESENTATION
         OCTOBER 2020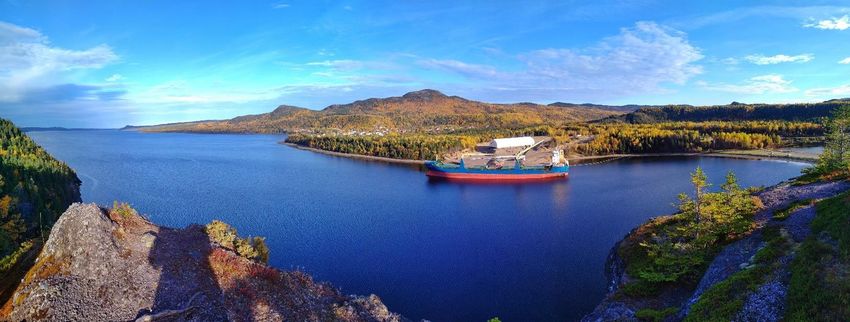
Disclaimer

This presentation, the information and data herein and the accompanying verbal presentation (together the “Presentation") is for general information only and has been prepared by and is the sole
responsibility and property of Rambler Metals and Mining plc (the "Company"). Making this Presentation available in no circumstances whatsoever implies the existence of a commitment or contract by
or with the Company, or any of its affiliated entities, or any of its or their respective subsidiaries, directors, officers, representatives, employees, advisers or agents ("Affiliates") for any purpose.

This Presentation does not constitute or form part of an offer or invitation to issue or sell, or the solicitation of an offer to subscribe for or purchase, any securities to any person in any jurisdiction to
whom or in which such offer or solicitation is unlawful. This Presentation and the information contained herein is restricted and is not for release, publication or distribution, in whole or in part, directly or
indirectly, and may not be taken or transmitted, in, into or from the United States of America (including its territories and possessions, any state of the United States and the District of Columbia (the
"United States"), Australia, Japan, New Zealand or the Republic of South Africa and may not be copied, forwarded, distributed or transmitted in or into the United States, Australia, Japan, New Zealand,
the Republic of South Africa, or any other jurisdiction in which such release, publication or distribution would be unlawful. The distribution of this Presentation in other jurisdictions may be restricted by
law, and persons into whose possession this Presentation comes should inform themselves about, and observe, any such restrictions. Any failure to comply with these restrictions may constitute a
violation of the laws of the relevant jurisdiction.

The information and any opinions contained in this Presentation are being provided as at the date of this Presentation and are subject to updating, completion, revision, amendment. This Presentation as
well as any other related documents or information do not purport to be all inclusive or to contain all the information that you may need. There is no obligation of any kind on the Company or any of its
Affiliates to update or revise this Presentation. No undertaking, representation or warranty or other assurance, express or implied, is or will be made or given in relation to, and no responsibility or
liability is or will be accepted by the Company or their respective Affiliates as to, or in relation to, the accuracy, reliability, or completeness of any information or opinions contained in this Presentation
and the Company (for itself and on behalf of its affiliates) hereby expressly disclaims any and all responsibility or liability, whether arising in tort, contract or otherwise (other than in respect of a
fraudulent misrepresentation), for the accuracy, reliability and completeness of such information. Information contained in this Presentation may relate to an arrangement, commitment or transaction
that is not suitable for you personally.

This Presentation may contain statements that are, or may be deemed to be, "forward-looking statements". These forward-looking statements may involve substantial risks and uncertainties and actual
results and developments may differ materially from those expressed or implied by these statements by a variety of factors. Forward-looking statements are sometimes identified by the use of forward-
looking terminology such as "believe", "expects", "may", "will", "could", "should", "shall", "risk", "intends", "estimates", "aims", "plans", "predicts", "continues", "assumes", "positioned" or "anticipates"
or the negative thereof, other variations thereon or comparable terminology. These forward-looking statements speak only as at the date of this Presentation. In addition, all projections, valuations and
statistical analyses provided in this Presentation may be based on subjective assessments and assumptions and may use among alternative methodologies that produce different results and should not be
relied upon as an accurate prediction of future performance. No statement in this Presentation is intended to be nor may be construed as a profit forecast or estimate, and no statement in this
Presentation should be interpreted to mean that earnings per share of the Company for the current or future financial years would necessarily match or exceed the historical published earnings per share
of the Company. No representations or warranties, express or implied, are given by the Company, nor any of their respective Affiliates as to the achievement or reasonableness of, or any projection of
the future, budgets, forecasts, management targets or estimates, prospects or returns and no reliance should be placed on, statements pertaining to financial performance, including (but not limited to)
any estimates, forecasts or targets contained in the Presentation. You are cautioned not to rely on such statements. The achievability of the Company’s proposed strategy set out in this Presentation
cannot be guaranteed.

                                                                                                                                                                                         2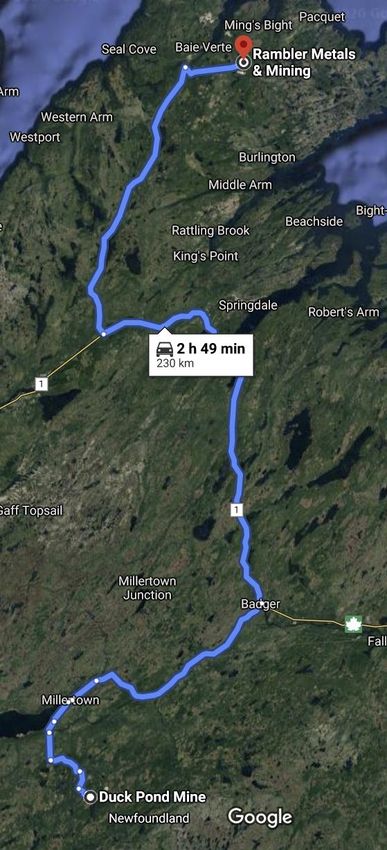
Disclaimer

 Certain industry, market and competitive position data contained in this Presentation may have come from the Company's own internal research and estimates based on the knowledge and experience
 of the Company's management in the market in which the Company operates. While the Company believes that such research and estimates are reasonable, they, and their underlying methodology and
 assumptions, have not been verified by any independent source for accuracy or completeness and are subject to change without notice. Accordingly, undue reliance should not be placed on any of the
 industry, market and competitive position data contained in this Presentation. Certain percentages and amounts in this Presentation may not sum due to rounding.

 The Company expressly reserves the right, without giving reasons therefore, at any time and in any respect, to amend or terminate discussions with you without prior notice and hereby expressly
 disclaims any liability for any losses, costs or expenses incurred.

 Tim Sanford, P.Eng., is the Qualified Person responsible for the technical content, verification and quality assurance of the exploration data and the analytical results set forth in this presentation. Mr.
 Sanford is a Vice President and employee of Rambler Metals and Mining Canada Limited and the Company Secretary of the Company.

                                                                                                                                                                                  2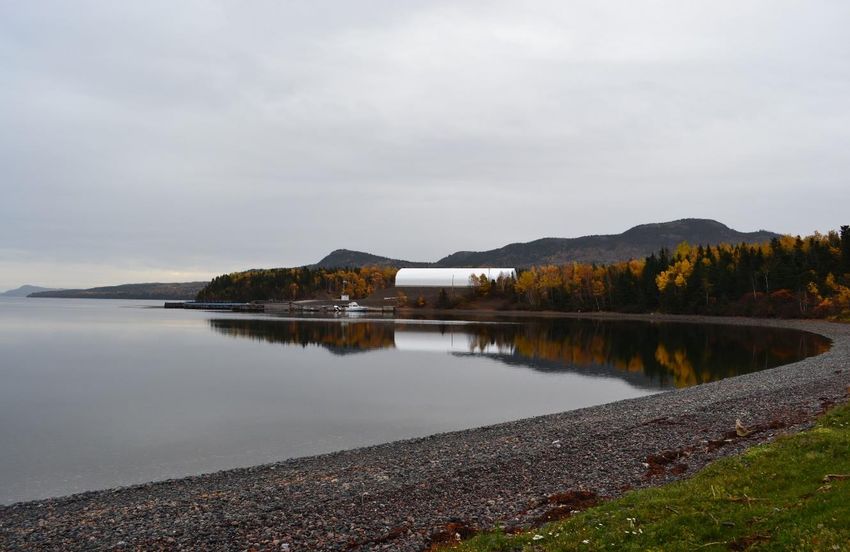
A Strong Investment Proposition at a Low Cost Entry Point

                                                   PROVEN METALLURGY & PREMIUM
           FULLY OPERATIONAL                                                                                      NEW MANAGEMENT
                                                          CU CONCENTRATE
       In production since November 2012              +27% Copper Gold concentrate                Proven mining operations turn-around expertise,
                                                                                                   creating business stability and growth options

                                                                                                 Toby Bradbury     Peter Mercer    Tim Sanford    Sanjay Swarup
                                                                                                President & CEO     VP & MGM      VP & Corp Sec        CFO

            ROBUST MINERAL                             FAVOURABLE UPSIDE AND                                  ATTRACTIVE MINING
         RESOURCES & RESERVES                              GROWTH PLAN                                           JURISDICTION
   20+ year life of mine with exploration upside     Capacity of 1,350 tpd @ 2% Cu with plans        Supportive government, low tax regime, & long
                                                         to expand to 2,400tpd @ 2% Cu                            history of mining

                                                                           4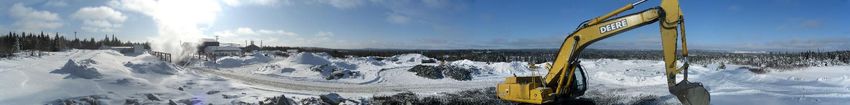
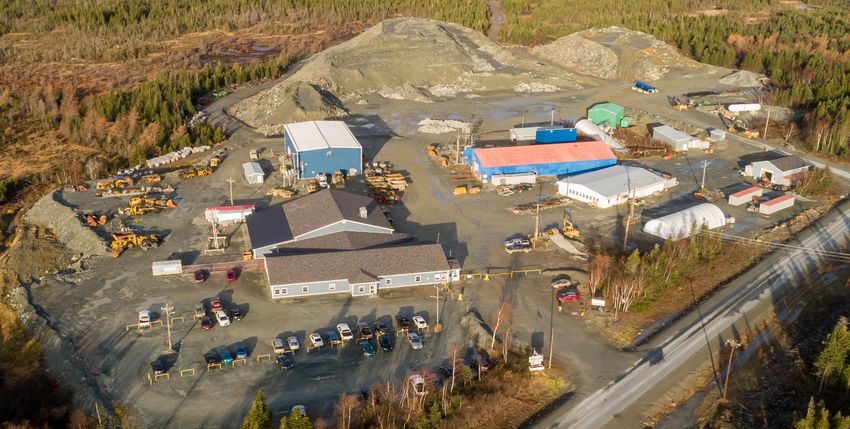
Rambler Overview
Operational underground Ming Mine, high grade Cu-Au, plant, and port in Newfoundland, Canada
Currently exporting approximately 27% Copper/Gold Concentrate with offtake arrangements in place
Proven metallurgy with recovery of 95-97% delivering 9,500 tpa Cu.
High grade resource targeting 2% copper ore
Current plant design capacity of 1,350 tpd.
Potential +20 years mine life based on internal company mine plan
Permits and major infrastructure
(power, water, roads, port)
Attractive exploration upside
Large scale deposit with expansion potential
Excellent mining jurisdiction
Additional local tenements in the portfolio
5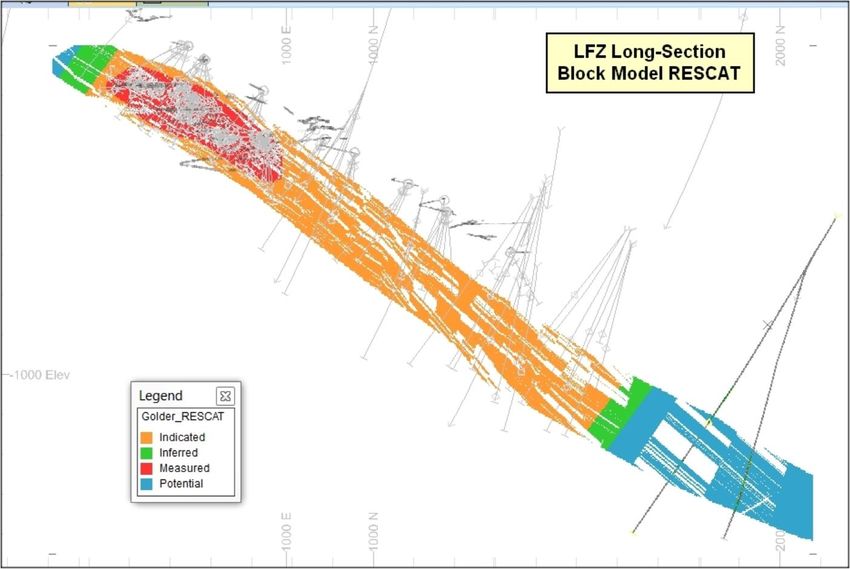
The Ming Mine High Grade Resource Endowment
Exploitable Measured and Indicated mineral resource (Dec 31, 2019) of 24.5M tonnes @1.7% Copper with
0.34 g/t Gold (@ 1% Cu cut-off)
Measured and Indicated contained Copper of 920 million pounds / 417,000tonnes with 264k ounces of Gold
Lower Footwall Zone: Resource Categories and Existing Drill Holes
MEASURED and INDICATED
1807 Zone 1.00 % Cu 535 2.25 2.51 18.90 26,578,538 12,056 43,186 325,123
1806 Zone 1.25 g/t Au 250 0.48 2.96 15.07 2,648,143 1,201 23,859 121,314
Ming South Zone 1.00 % Cu 660 2.12 2.06 13.08 30,890,696 14,012 43,643 277,451
Ming North Zone 1.00 % Cu 1,030 2.73 1.34 8.35 62,036,853 28,140 44,289 276,471
Unmined Levels -- 125 2.43 1.99 0 6,693,469 3,036 7,989 0
Remnant Pillars -- 259 3.96 2.00 0 22,603,146 10,253 16,656 0
Sub-Total Massive Sulphides 2,859 2.40 1.95 10.88 151,450,846 68,698 179,623 1,000,359
Upper Footwall Zone 1.00 % Cu 678 2.63 0.22 2.75 39,296,733 17,825 4,890 60,010
Lower Footwall Zone 1.00 % Cu 20,969 1.58 0.12 1.57 729,382,996 330,846 79,619 1,061,011
Sub-Total Stringer Sulphides 21,647 1.61 0.12 1.61 768,679,729 348,671 84,509 1,121,021
Total Measured and Indicated 24,506 1.70 0.34 2.69 920,130,575 417,368 264,131 2,121,380
INFERRED
1807 Zone 1.00 % Cu 103 1.75 2.12 16.10 3,988,823 1,809 7,044 53,454
1806 Zone 1.25 g/t Au 149 0.66 2.63 10.67 2,181,199 989 12,576 51,100
Ming South Zone 1.00 % Cu 117 1.86 0.62 2.93 4,816,618 2,185 2,329 11,072
Ming North Zone 1.00 % Cu 685 4.64 1.04 8.26 70,043,743 31,772 22,830 181,822
Unmined Levels --
Remnant Pillars --
Sub-Total Massive Sulphides 1,054 3.49 1.32 8.78 81,030,384 36,755 44,780 297,448
Upper Footwall Zone 1.00 % Cu 50 2.46 0.16 1.86 2,693,956 1,222 248 2,959
Lower Footwall Zone 1.00 % Cu 3,920 1.45 0.15 1.72 125,297,534 56,835 18,501 217,053
Sub-Total Stringer Sulphides 3,969 1.46 0.15 1.72 127,991,490 58,057 18,749 220,013
Total Inferred 5,023 1.89 0.39 3.20 209,021,874 94,812 63,529 517,461
6
Delivering Value for Investors
Operations
Mine grades to improve from historical 1.5% Cu to ≈2% based on updated drilling results, new resource model, and
new mine plan
Underground mined production increase from current 700tpd progressively to 2000tpd by 2022
Ore sorting preconcentration from 2022 to improve feed grade (approx. 30% waste removed at mine)
Oversight
New leadership with successful turn-around experience
Focused management
Exploration
Further exploration to build on 2019 success
Long life mine potential >20 years
Financial
Refinance with loan from West Face Capital
Supportive suppliers
7
Exciting Exploration Upside
Exploration Exploration
Upgrade Indicated Resources in the Lower Potential to extend resources in the Ming
Footwall Zone – Target A North Zone with exciting targets already
Upgrade Inferred Resources in the Lower identified – Target C
Footwall Zone – Target B
8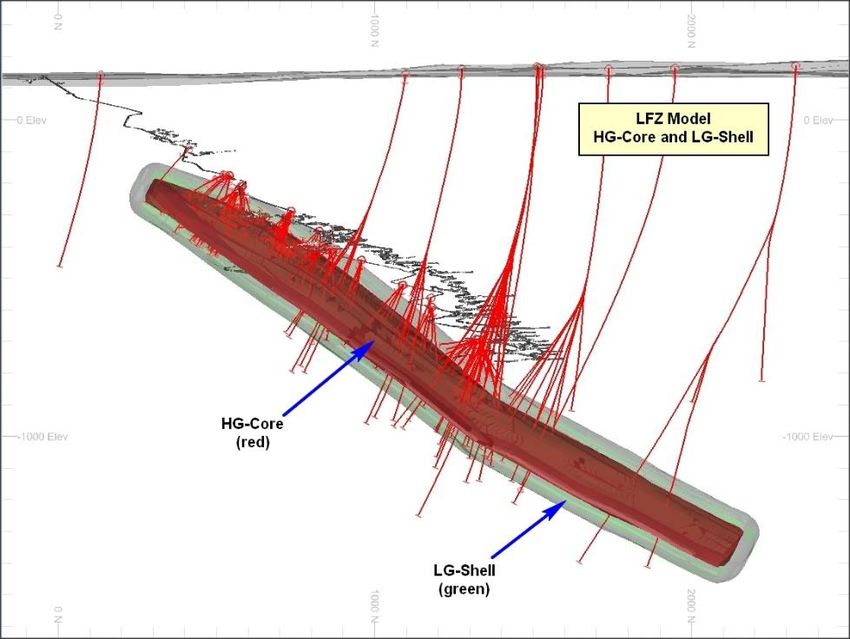
The Next 12 Months
Operations
Accelerate mine development with engagement of contractor
Upgrade run-down mining and mill assets; purchase of Duck Pond Mill
Stepwise sustainable mine production from 700 – 1000 – 1400 tpd @ 2% Cu
Ore sorting plant design as a key value add opportunity. Construction to the end of 2021
Exploration
Infill drilling to improve resource definition for planning and control
Exploration drilling to upgrade inferred resources
Further exploration aimed at specific targets
Oversight
Cultural shift to shareholder returns with risk management philosophy
Performance management and upgraded management information systems
Recruit/train key roles in mine operations, technical, engineering and finance
Financial
Improved balance sheet
9
Funding and Use of Proceeds
Use of
Rambler is proposing to raise new funding of US$15 million: USE OF PROCEEDS Equity
US$5.0 million loan from West Face Capital; binding, US$ (mil)
conditional on: Mine Capital Development 5.4
US$6.5 million new equity; Mine/Mill Remedial Work 1.8
US$3.5 million from sale of assets; agreement in principle Mine Sustaining Capital 1.8
Duck Pond Mill Purchase 0.9
The primary purpose of the capital raise is:
Infill and exploration drilling 0.3
to re-establish mine/mill operations at sustainable 9,500 tonnes Ore Sorting Study 0.1
per year Cu (1,350 tpd @ 2% copper grade) by Q2 of 2021; Sub-total operations 10.3
Secure the purchase of the Duck Pond Mill; Current Adjustments Revised
Follow-up testing and design work for ore sorting to start in DEBT ITEMS US$ (mil) US$ (mil) US$ (mil)
2022;
To upgrade and expand the resource base of the mine. Creditors 14.1 2.0 12.1
SF short term loan 1.8 1.8 0
A portion of the funds will be used to strengthen the Balance Sheet. Sandstorm 0.9 0.9 0
Including accrued interest, convertible notes (US$7.7m) and related Convertible notes / related party loans 9.6 0 0
party loans (US$1.9m) to convert to equity at new equity price Sub-total Debt Items 26.4 4.7 12.1
Total Use of Proceeds 15.0
10NPV Upside: – US$200m* vs Current Market Capitalisation of ≈US$14m
Build up to existing mill capacity - 1,350 tpd mined @ 2% Cu
From 2022, introduction of ore sorting - 2,000 tpd mined @ 2% Cu
Average LOM C1 cost = US$2.13/lb of saleable copper
Operating Margin – Ore Sorting Cash Flow – Ore Sorting
$US / Mined Tonne $US
$140.00 $60,000,000 $600,000,000
$120.00
$50,000,000 $500,000,000
US$, Cumulative Cash Flow
$100.00
US$, Annual Cash Flow
$40,000,000 $400,000,000
$80.00
$60.00 $30,000,000 $300,000,000
$40.00 $20,000,000 $200,000,000
$20.00
$10,000,000 $100,000,000
$0.00
2020 20212022202320242025202620272028202920302031203220332034203520362037203820392040 $0 $0
H2
Mining OPEX US$/t Surface Ore Haulage US$/t -$10,000,000 -$100,000,000
2020 H2
2021
2022
2023
2024
2025
2026
2027
2028
2029
2030
2031
2032
2033
2034
2035
2036
2037
2038
2039
2040
Milling OPEX US$/t Overhead OPEX US$/t
Concentrate OPEX US$/t Royalties (ex-Sandstorm) OPEX US$/t
Net Revenue (after Sandstorm) US$/t Cashflow After Funding (ann) US$ Cashflow After Funding (cum) US$
* NPV8% - Detailed Company assumptions in Appendix, Slide 22
11Expansion Blue Sky: New (Duck Pond) Mill – NPV US$298m*
Relocated (Duck Pond) mill at Ming Mine site
From 2025: 2,400 tpd mined @ 2% copper
Average LOM C1 cost = US$2.03/lb of saleable copper
Operating Margin – Expansion with New Mill Cash Flow – Expansion with New Mill
$US / Mined Tonne $US
$160.00 $90,000,000 $900,000,000
$140.00 $80,000,000 $800,000,000
US$, Cumulative Cash Flow
$120.00 $70,000,000 $700,000,000
US$, Annual Cash Flow
$100.00 $60,000,000 $600,000,000
$80.00 $50,000,000 $500,000,000
$60.00 $40,000,000 $400,000,000
$40.00 $30,000,000 $300,000,000
$20.00 $20,000,000 $200,000,000
$0.00 $10,000,000 $100,000,000
2020 20212022202320242025202620272028202920302031203220332034203520362037203820392040 $0 $0
H2
-$10,000,000 -$100,000,000
Mining OPEX US$/t Surface Ore Haulage US$/t
2020 H2
2021
2022
2023
2024
2025
2026
2027
2028
2029
2030
2031
2032
2033
2034
2035
2036
2037
2038
2039
2040
Milling OPEX US$/t Overhead OPEX US$/t
Concentrate OPEX US$/t Royalties (ex-Sandstorm) OPEX US$/t
Net Revenue (after Sandstorm) US$/t Cashflow After Funding (ann) US$ Cashflow After Funding (cum) US$
* NPV8% - Detailed Company assumptions in Appendix, Slide 22
12The Right Macro Environment
Lloyd Blankfein, former chairman and chief executive officer of Goldman Sachs Group (quoted 17 September 2020):
“Now Would Be a Good Time to Invest in Commodities”
“From an inflation point of view, as an investor, I think investing in material sectors while they’re
under-appreciated is not a bad thing now”
Commodities as an inflation hedge
Commodities have not been cheaper compared
to equities in decades (Ratio of S&P GSCI to S&P 500
hit a low of 0.09 earlier in 2020, ~27% of its 30y average)
Central banks remain committed to implement traditional
and unconventional measures to support demand and
improve inflation outlook
Fiscal response to the pandemic translating into expanding
fiscal deficits and climbing debt levels create stimulus for
governments to favour inflationary environment
13Copper as a Key Commodity
Copper has strong fundamentals:
Concern regarding supply deficit on the back of declining global grades exacerbated by coronavirus
Increasing and sustained demand driven by economic growth and stimulus packages
Emerging uses (led by electrification mega-trends): wind turbines, solar panels, EVs, charging points… in addition to
Traditional uses: home wiring, power cables, autos, smart phones,
TVs, laptops, ACs
Cumulative demand over next 30 years expected to more than
double (2.1x) compared to the previous 30 years led by the
decarbonisation and electrification trends (BHP)
Robust pricing scenario
14Commitment to a Sustainable Business
Highest standards in
Safety
Health
Environment
Secure community and government
support to protect Rambler’s Social
Licence to Operate
Access to government funding for economic development to be evaluated
Fundamental belief that these key risks, when well-managed, protect the
investment, creating opportunity and value for the business
15Investment Proposition Summary
Fundamentally sound high-grade resources
Excellent exploration potential
Long life (20 years) operation with expansion opportunity
Established and operating with no new mine development risk
New leadership with appropriate turn-around experience
In excellent jurisdiction
Supportive commodity market
Opportune macro environment
Current market capitalisation ≈US$14m
Project valuation >US$200m
16Appendix
17Corporate
Board of Directors
Bradford Mills – Director, Chair
+30 years in the resource industry. Founder and managing director of Plinian. Director at
Mandalay Resources. Turn-around experience.
Toby Bradbury – President & CEO, Director
PhD in mining, Masters Degree in Business Leadership. 40+ years in the resource
industry. Formerly CEO at Shanta Gold. Turn-around experience.
Terrell Ackerman – Non-Executive Director
40+ years in the resource industry. Former interim CEO at Stillwater Mining.
Eason Chen – Non-Executive Director
Extensive knowledge and experience in Canadian and cross-border listings, corporate
governance and internal controls. Top 10 shareholders 15-Sep-20 %
CE Mining II Rambler (George Town) 828,295,686 63.89
Belinda Labatte – Non-Executive Director Lombard Odier Asset Mgt (London) 229,434,599 17.70
MBA from Rotman School of Management and CFA charter holder. Chief Development Officer Aether Real Assets Co-Investment I L.P (Denver) 124,138,495 9.58
at Mandalay Resources. Tinma International (China) 22,736,992 1.75
Hargreaves Lansdown Asset Mgt (Bristol) 13,886,515 1.07
Glenn Poulter – Non-Executive Director Barclays Wealth (London) 8,624,400 0.67
Executive MBA, Cass Business School, specializing in finance and strategy. +30 years of Interactive Investor (Glasgow) 6,674,055 0.51
experience with financial services in the UK. Zila Corporation (Monte Carlo) 6,499,999 0.50
TD Waterhouse Canada (Toronto) 5,354,078 0.41
Mark Sander – Non-Executive Director Charles Stanley (London) 5,185,295 0.40
PhD in Ore Deposits and Exploration and active in the mineral resource industry for +25 years. TOTAL 1,250,830,114 96.48
Previously President and CEO at Mandalay Resources. ISSUED CAPITAL 1,296,411,642 100.00
18Business Plan Assumptions
Ore Sorting: Valuation Assumptions Expansion with New Mill: Valuation Assumptions
2020 2021 Long Term Avg 2020 2021 Long Term Avg
Commodity Prices Commodity Prices
Copper ($/lb) 2.69 2.90 3.00 Copper ($/lb) 2.69 2.90 3.00
Gold ($/oz) 1,900 1,935 1,700 Gold ($/oz) 1,900 1,935 1,700
Silver ($/oz) 26.71 26.71 25.00 Silver ($/oz) 26.71 26.71 25.00
Operating Parameters Operating Parameters
Processing Rate tpd 744 1,325 1,355 Processing Rate tpd 744 1,325 2,263
Copper Grade 2.14% 2.04% 2.86% Copper Grade 2.14% 2.04% 2.21%
Gold Grade (g/t) 0.83 0.41 0.25 Gold Grade (g/t) 0.83 0.41 0.19
Silver Grade (g/t) 5.74 3.25 3.12 Silver Grade (g/t) 5.74 3.25 2.40
Copper Recovery 95.5% Copper Recovery 95.5%
Gold Recovery 70.0% Gold Recovery 70.0%
Silver Recovery 70.0% Silver Recovery 70.0%
Concentrate tonnes 7,704 30,115 44,089 Concentrate tonnes 7,704 30,115 56,271
Copper Grade 28.5% 28.5% 28.5% Copper Grade 28.5% 28.5% 28.5%
Gold Grade (g/t) 7.38 4.33 1.82 Gold Grade (g/t) 7.38 4.33 1.75
Operating Costs US$/t Operating Costs US$/t
Mining 52.63 Mining 44.60
Ore Sorting 1.50 Ore Sorting 1.50
Milling 16.53 Milling 16.53
G&A and other 5.48 G&A and other 3.43
Concentrate Transport 57.08 Concentrate Transport 57.08
Concentrate Treatment 54.19 Concentrate Treatment 54.33
Concentrate Refining 0.06/lb Concentrate Refining 0.06/lb
19Cu metal increases significantly within potentially feasible lower copper cut-off grades
At a 1.6% cut-off, the mine is targeting a mineral resource base of 7.7M tonnes from the Lower Footwall Zone.
This resource base doubles to 15.2M tonnes at 1.2% Cu cut-off.
Options to test Cu cut-off with reduced operating cost through efficiencies, mine and mill expansion.
Lower Footwall Zone: Resource sensitivity table
Quantity Grades Contained Metal
Copper
Copper Gold Silver Copper Copper Gold Silver
Cutoff
(000't) % g/t g/t M lbs tonnes oz oz
0.6 37,861 1.22 0.10 1.26 1,022 463,620 120,106 1,528,239
0.8 28,521 1.40 0.11 1.41 879 398,521 99,405 1,293,757
1.0 20,969 1.58 0.12 1.57 729 330,846 79,619 1,061,011
1.2 15,178 1.76 0.13 1.74 589 267,386 62,101 848,771
1.4 10,830 1.95 0.14 1.90 465 211,092 47,233 663,169
1.6 7,728 2.13 0.14 2.06 363 164,749 35,618 511,765
1.8 5,431 2.32 0.15 2.22 277 125,799 26,458 386,942
2.0 3,705 2.51 0.16 2.39 205 93,102 19,416 284,454
20Lower Footwall Zone: Resource Categories and Existing Drill Holes
21Duck Pond 2,200 TPD Processing Plant
MOU with Teck Resources Limited for purchase of the plant and spare parts
Main components include:
Jaw crusher – Terex Cedar Rapids 150 hp (110kW), 36 x 48
SAG mill – 2,250 hp (1,680 kW) Hardinge, 20 ft x 6 ft (6.1 m x 1.8 m)
Ball mill – 2,250 hp (1,680 kW) Nordberg, 14 ft x 20.8 ft (4.3 m x 6.3 m)
Ball mill – 900 hp (670 kW) Dominion, 11 ft x 14 ft (3.4 m x 4.3 m)
Ball mill – 600 hp (450 kW) Allis Chalmers, 9 ft x 14 ft (2.7 m x 4.3 m)
Outokumpu flotation cells x 48
Outokumpu thickeners x 3
Larox filter press – PF32/38 AH1 x 4
Paste fill preparation system
All associated equipment, systems, and spare parts
22Rambler Peer Comparison
Cu producers Rambler Metals & Mining Adventus Mining Sandfire Resources America
Ticker RMM LN ADZN CN SFR CN
Project Ming Mine El Domo Black Butte
Ownership 100% 75% 100%
Location Newfoundland and Labrador Ecuador Montana, US
Fraser Institute Inv Att Rating (2019) 28/76 57/76 49/76
Enterprise Value (EV) US$m 29 109 166
M&I CuEq contained kt CuEq 499 534 316
M&I CueEq grade pp 2.03 6.00 2.9
Mining method UG OP/UG UG
Size tpd 1,325 1,750 3,288
LOM years >20 15 11
Payable CuEq per annum ktpa 10 19 28
EV/M&I (att) US$ 57 273 524
EV/Production (att) US$ 2,860 7,756 5,880
Source: Company, SP Angel
23Rambler CEO Leadership Experience
Toby Bradbury leadership period for Shanta Gold
Business turn around Transition to Underground Low-cost and “Sustainable”
$80m capital project incl. Consistent, safe, reliable production performance
power, water, tailings
35.0 1,600
29 1,400
30.0
25 24 24 24 1,200
25.0 22 23 22
21 20 21 21
20 20 20 20 20 1,000
19 18
20.0 18
15 800
15.0 14
600
10.0
400
5.0 200
0.0 0
Mar-15 Jun-15 Sep-15 Dec-15 Mar-16 Jun-16 Sep-16 Dec-16 Mar-17 Jun-17 Sep-17 Dec-17 Mar-18 Jun-18 Sep-18 Dec-18 Mar-19 Jun-19 Sep-19 Dec-19 Mar-20 Jun-20
Production (LHS) koz AISC (ex royalty) $/oz
Initiation of Bankable Start of Completion of Commercial
underground Feasibility & u/g surface u/g stope
feasibility LOM Plan decline mining production
US$40m Investec Luika River Launch of Solar power US$40 m Investec Senior
Senior Secured Dam Agriculture project Secured loan fully repaid,
Loan Construction program commissioned on schedule
24You can also read