IDF Spain - Investor Presentation - November 2020 - Mintos
←
→
Page content transcription
If your browser does not render page correctly, please read the page content below

IDF Spain – Investor Presentation
                                                         November 2020

  Top 2 fastest-          The most              Top 50 fastest-    Europe’s 100           The most          Top-250 fintech   Innovation
growing fintech in   innovative financial      growing private    Hottest Startups   innovative in credit     companies         leader
     Europe            service for 2020      European companies                        scoring services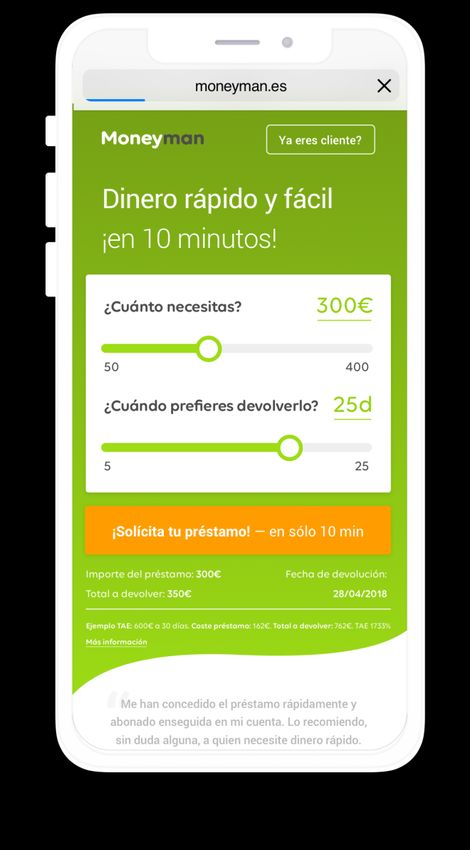
Disclaimer
THIS DOCUMENT, ITS PRESENTATION AND ITS CONTENTS ARE CONFIDENTIAL AND ARE BEING PROVIDED TO YOU SOLELY FOR YOUR INFORMATION AND MAY NOT BE COPIED, RECORDED, RETRANSMITTED OR FURTHER DISTRIBUTED
TO ANY OTHER PERSON OR PUBLISHED, IN WHOLE OR IN PART, BY ANY MEDIUM OR IN ANY FORM FOR ANY PURPOSE. FAILURE TO COMPLY WITH THIS RESTRICTION MAY CONSTITUTE A VIOLATION OF APPLICABLE SECURITIES LAWS.
This document and any question and answer session that follows the oral presentation do not contain all of the information that is material to an investor. By attending the meeting where this presentation is made, or by receiving and using this presentation
and/or accepting a copy of this document, you agree to be bound by the following limitations and conditions and, in particular, will be taken to have represented, warranted and undertaken that you have read and agree to comply with the contents of this
disclaimer including, without limitation, the obligation to keep this document and its contents confidential.
This presentation does not constitute an offer or invitation to sell, or any solicitation of any offer to subscribe for or purchase any securities, and nothing contained herein shall form the basis of any contract or commitment whatsoever. No reliance may be placed
for any purposes whatsoever on the information contained in this presentation or on its completeness, accuracy or fairness. This presentation has not been approved by the Central Bank of Ireland or any other competent authority.
This presentation has been prepared by ID Finance Spain, S.A.U. (the ''Company”) solely for use at a presentation to be held in connection with the proposed offering (the "Offering") of Bonds (the “Bonds”). By reading the presentation slides, you agree to be
bound by the following limitations and undertakings and acknowledge that you understand the legal sanctions attached to the misuse, disclosure or improper circulation of this presentation. This presentation does not purport to be all-inclusive or to contain all the
information that you may desire in analysing the Company or otherwise. This presentation is strictly confidential and, save as by prior approval in writing, this presentation or the information it contains may not, in whole or in part, be reproduced or redistributed,
whether in print, electronic or any other format, to any other party. All rights to the material are reserved. The information contained in this document is only current as of the date of the presentation and is subject to further verification and amendment in any way
without liability or notice to any person. The opinions presented herein are based on general information gathered at the time of writing and are subject to change without notice. We rely on information obtained from sources believed to be reliable but do not
guarantee its accuracy or completeness. In giving the presentation, neither the Company nor its respective advisers and/or agents undertake any obligation to provide the recipient with access to any additional information or to update this presentation or any
additional information or to correct any inaccuracies in any such information which may become apparent.
Investors and prospective investors in securities of the Company are required to make their own independent investigation and appraisal of the business and financial condition of the Company and the nature of the securities. Any decision to purchase securities
in the context of the proposed Offering, if any, should be made solely on the basis of information contained in the listing particulars published in relation to such Offering. No reliance may be placed for any purpose whatsoever on the information contained in this
presentation, or any other material discussed verbally, or on its completeness, accuracy or fairness. This presentation does not constitute a recommendation regarding securities of the Company.
This presentation is not for public release, publication or distribution, directly or indirectly, in or into the United States (including its territories and possessions, any State of the United States and the District of Columbia), or to, or for the account or benefit of, U.S.
persons (as defined in Regulation S under the U.S. Securities Act of 1933 (“Regulation S”) (the “Securities Act”). This presentation does not constitute or form a part of any offer of, or solicitation to purchase or subscribe for, any securities in the United States.
The Bonds have not been and will not be registered under the Securities Act and the Bonds are subject to U.S. tax law requirements. Subject to certain exceptions, the Bonds may not be offered, sold or delivered within the United States or to U.S. persons. Any
failure to comply with these restrictions may constitute a violation of U.S. securities laws. The distribution of this document in other jurisdictions may also be restricted by law, and persons into whose possession this document comes should inform themselves
about, and observe, any such restrictions.
Solely for the purposes of each manufacturer’s product approval process, the target market assessment in respect of the Bonds has led to the conclusion that: (i) the target market for the Bonds is eligible counterparties and professional clients only, each as
defined in Directive 2014/65/EU (as amended, “MiFID II”); and (ii) all channels for distribution of the Bonds to eligible counterparties and professional clients are appropriate. Any person subsequently offering, selling or recommending the Bonds (a “distributor”)
should take into consideration the manufacturers’ target market assessment; however, a distributor subject to MiFID II is responsible for undertaking its own target market assessment in respect of the Bonds (by either adopting or refining the manufacturers’
target market assessment) and determining appropriate distribution channels.
The Bonds are not intended to be offered, sold or otherwise made available to and should not be offered, sold or otherwise made available to any retail investor in the EEA or in the United Kingdom. For these purposes, a retail investor means a person who is
one (or more) of: (i) a retail client as defined in point (11) of Article 4(1) of MiFID II; or (ii) a customer within the meaning of Directive 2016/97/EU, where that customer would not qualify as a professional client as defined in point (10) of Article 4(1) of MiFID II.
Consequently no key information document required by Regulation (EU) No 1286/2014 (as amended, the “PRIIPs Regulation”) for offering or selling the Bonds or otherwise making them available to retail investors in the EEA or in the United Kingdom has been
prepared and therefore offering or selling the Bonds or otherwise making them available to any retail investor in the EEA or in the United Kingdom may be unlawful under the PRIIPs Regulation.
The proposed offer of the Bonds has not been registered with the Comisión Nacional del Mercado de Valores (the “CNMV”). Accordingly, the Bonds can only be sold, offered or distributed in Spain in circumstances which do not require the registration of a
prospectus with the CNMV and complying with all legal and regulatory requirements under Spanish securities laws.
In member states of the European Economic Area (the “EEA”), this presentation is directed only at persons who are "qualified investors" within the meaning of Regulation (EU) 2017/1129.
This communication is only being distributed to and is only directed at (i) persons who are outside the United Kingdom or (ii) to investment professionals falling within Article 19(5) of the Financial Services and Markets Act 2000 (Financial promotion) Order 2005
(the “Order”) or (iii) high net worth entities, and other persons to whom it may lawfully be communicated, falling within Article 49(2)(a) to (d) of the Order or (iv) persons to whom any invitation or inducement to engage in investment activity can be communicated
in circumstances in which section 21(1) of the Financial Services and Markets Act 2000, as amended (the “FSMA”) does not apply (all such persons together being referred to as “relevant persons”). Any securities described herein are only available to, and any
invitation, offer, or agreement to subscribe, purchase or otherwise acquire such securities will be engaged in only with, relevant persons. Any person who is not a relevant person should not act or rely on this document or any of its contents.
Information in this presentation is not an offer, or an invitation to make offers, sell, purchase, exchange or transfer any securities in Russia or to or for the benefit of any Russian person and does not constitute an advertisement or offering of securities in Russia
within the meaning of Russian securities laws and must not be passed on to third parties or otherwise be made publicly available in Russia. The securities have not been and will not be registered in Russia or admitted to “placement” and/or “public circulation” in
Russia. The securities are not intended for "placement" or "circulation" in Russia, except and to the extent permitted by Russian law.
Forward-looking statements
Certain statements in this presentation are not historical facts and are “forward-looking”. Examples of such forward-looking statements include, but are not limited to:
∙ projections or expectations of revenues, income (or loss), earnings (or loss) per share, dividends, capital structure or other financial items or ratios;
∙ statements of our plans, objectives or goals, including those related to products or services;
∙ statements of future economic performance; and
∙ statements of assumptions underlying such statements
Words such as “believes”, “anticipates”, “expects”, “estimates”, “intends”, “plans”, “outlook” and similar expressions are intended to identify forward-looking statements but are not the exclusive means of identifying such statements.
By their very nature, forward-looking statements involve inherent risks and uncertainties, both general and specific, and risks exist that the predictions, forecasts, projections and other forward-looking statements will not be achieved. You should be aware that a
number of important factors could cause actual results to differ materially from the plans, objectives, expectations, estimates and intentions expressed in such forward-looking statements. You should therefore carefully consider the foregoing factors and other
uncertainties and events, especially in light of the political, economic, social and legal environment in which we operate. Such forward-looking statements speak only as of the date on which they are made, and we do not undertake any obligation to update or
revise any of them, whether as a result of new information, future events or otherwise. We do not make any representation, warranty or prediction that the results anticipated by such forward-looking statements will be achieved, and such forward-looking
statements represent, in each case, only one of many possible scenarios and should not be viewed as the most likely or standard scenario. Certain data in this presentation has been rounded. As a result of such rounding, the totals of data prescribed in this
presentation may vary slightly from the arithmetic total of such data. A rating is not a recommendation to buy, sell or hold securities and may be subject to revision, suspension or withdrawal at any time by the assigning rating organisation.

                                                                                                                                          2
Agenda

                                          page

  1   IDF SPAIN OVERVIEW                   4

  2   LEADING ALTERNATIVE FINANCE BRAND    8

  3   FINANCIAL PERFORMANCE               15

  4   APPENDICES:                         21

      1. Management team
      2. Group structure
      3. Financial statements

                                3
Section 1

IDF Spain overview

                     4
IDF Spain is a part of the leading international fintech group

        One of the fastest growing                   EUR 390m +
        International FinTech group                  Loans issued

                                                                            Revenue, EUR m
        4.8m +                                       400+                                              81
        Users                                        Professionals                                              76

                                                                                             41
        EUR 76m +                                    EUR 123m +
        Revenue for 9M 2020                          Issuance for 9M 2020       13

                                                                               2017       2018        2019    9M 2020
                                                                                             EUROPE   LATAM
▪ Focused on consumer lending in Spain and Latin America
                                                                            Operating income, EUR m
▪ Artificial Intelligence is core of the business - team professionals
  globally use proprietary state-of-the-art AI and Data Science
                                                                                                                 7.4
  technologies
                                                                                                        5.5

                                                                                             1.0

▪ Robust data science and credit scoring capabilities built on
  proprietary State-of-the-Art IT Platform                                     -1.1
                                                                               2017       2018         2019   9M 2020

                                                                  5
IDF Spain showed fast growth since 2015 and became the leading player in Spain

                                                                                           2019-2020

                                                                               ▪ Record-breaking EUR5.5m equity
                                                                                 crowdfunding round in 2019 in Spain
                                                                                 at EUR 95m post-money valuation
                                                                               ▪ ID Finance named the leading
                                                      2017-2018                  alternative lending brand in Spain
                                                                               ▪ Insurance product was launched
                                        ▪ The second fastest growing fintech
                                          in the region by Financial Times     ▪ Surpassed 1 million registered users
                                        ▪ In 2018, achieved positive net       ▪ Top 10 Barcelona tech-companies
                                          income                               ▪ Issued bonds in amount of EUR40m
                2015-2016               ▪ Local funding raised                   on Frankfurt Stock Exchange
                                        ▪ Awarded by reputable media: Wired,
  ▪ In 2015 launched operations in        Financial Times                                                  257
    Spain
  ▪ Product-market fit reached
  ▪ Positive unit economics achieved                                                170

                                                                       70

                                                26
           1                      7

         2015                    2016          2017                  2018          2019                  9M 2020
                                        Loans issued, cumulative, EURm

                                                          6
IDF Spain in brief

                                              Key financial highlights
     Fastest growing
                                              EUR m                            9M 2020      2019               2018
     fintech company in Spain
                                              Key metrics
                                              Revenue                           47.5         48.5              23.0
                                              Net Income                         3.4            3.3            0.1
     Leading brand
                                              Total assets                      43.9         33.0              14.8
     among alternative lenders by number of
                                              Loans and borrowings              31.2         23.4              12.7
     brand search
                                              Equity                             8.8            5.4            -0.9

                                              Key ratios
                                              ROAE                             64.3%       143.9%               -
     Well capitalized                         ROAA                             11.9%        13.7%              0.7%
     20.1% equity-to-assets ratio             Net income margin                 7.2%        6.7%               0.3%
                                              Equity ratio                     20.1%        16.4%               -

                                              Registered users, m
     +47% YoY
     Revenue growth (9M 2020)                   1.5m+
                                                Registered users (9M 2020)
                                                                                                                      1.5
                                                                                                       1.3
                                                                                          1.1
     +92% YoY                                                                    0.8
     Net income growth (9M 2020)                                       0.6
                                                              0.4
                                                 0.3
                                               Jan-18        Jun-18   Dec-18    Jun-19   Dec-19       Jun-20        Sep-20

                                               7
Section 2

Leading alternative finance brand

                             8
Attractive product proposition

                         ▪ Leading alternative lending brand according to brand search statistics

                         ▪ Fully automated lending service operating online 24/7

                         ▪ Fast and convenient financial services via web and mobile platforms

                         ▪ Focus on solving short-term cash flow needs of our customer

                         ▪ Customized product for clients who use alternative financial services

                         ▪ Industry-beating NPS of 68, which is higher than the NPS of traditional
                           banks (32 on average for the banks)

                                 Loan amount:                      Term:
                                 Up to EUR1,300                    Up to 4 months

                                             9
Deep understanding of target customers

                                                            Sex                                              Marital status
               20 - 45 years old
                                                                                                              1.8%
                                                                                                                        6.7%
                                                                                                                                                Single
                                                                                                                10.5%
                                                                                                                                                             1
                                                            36.9%                                                                               Married
                                                                                           Male
               Demand convenience                                                                                                               Divorced
                                                                                           Female                                      56.9%
                                                                                  63.1%                       24.1%
                                                                                                                                                Widowed
                                                                                                                                                         2
                                                                                                                                                Other

               EUR 1-1.5k disposable
               income
                                                            Employment                                       Age

                                                                                          Full-time
                                                                      9%                                              16.6%
                                                                                          Part-time                              17.4%          18-25
               Tech-savvy                                        9%
                                                            4%                            Temporary work                                        26-30
                                                                                          Self-employed                                 14.4%   31-40
                                                             8%                                                22.6%
                                                                                   56%
                                                                                          General employee                                      41-50
                                                               10%
                                                                     4%                   Pensioner                                             51+
               Loan users / clients                                                                                            29.0%

               without credit history                                                     Other

* Data of customers to whom the loan was granted in 1H 2020
1 – including civil marriage; 2 – including clients who left the question blank    10
Efficient customer acquisition and retention
Acquisition Channels Structure
Marketing strategy
(% of new loans issued)
5%
▪ Omni-channel marketing provides seamless customer 5%
experience across all channels, across multiple touch points CPA
7%
PPC
▪ Well-diversified strategy of online marketing
▪ CPA (Cost-per-action) - global relationship with key affiliates Organic
51%
▪ PPC (Pay-per-click) - continuous optimization of acquisition 32% Direct Marketing
costs via Google and Facebook
Mobile
▪ Organic - key acquisition channel which provides the most
loyal clients with the lowest CAC. Moneyman is now one of the
most popular finance brands
▪ Direct Marketing - the most important channel to generate Loyal customer base with high retention rate
repeat business. Continuous “dialogue” with clients and
propensity scoring insures high CLV 68
80%
▪ Mobile marketing – mobile app driven marketing increases Net Promoting Score
Recurring clients
retention rate (NPS) above peers
▪ Dedicated team per each marketing channel 68
17 32 62
▪ Clear KPIs for marketing split, cost and retention
Low Average High
Source: delighted.com/nps-benchmarks
11Fully online underwriting process
Application Client identification (KYC) Credit policy & Antifraud Loan disbursement
▪ Product selection ▪ Name check vs. internal and ▪ Behaviour stats and external databases (incl. ▪ Disbursement to the
external DBs AntiFraud, Sanctions & Terrorist lists) bank account
▪ Basic customer information:
▪ Client ID ▪ Categorisation of clients into several groups
– personal data
▪ Bank Account validation ▪ Several score models
– employment
– bank account information
2-3 min
from application to disbursement
Higher approval rates for customers with proven credit history with the Company
New clients 22%
Recurring
clients 74%
12Established automated collection process
Pre- Outsourced Debt Legal
In-house collections Debt–Sales
collection Collections Agencies Collections
Due date Due date 60 DPD’s 180+ days
-5 delay
Reminders are sent: ▪ Automatic SMS/email/ ▪ Competitive tender process for Highly automated and New process being
robo-caller reminders; outsource debt collection efficient legal collection introduced and
▪ Automatic
SMS/email ▪ Reaching clients using all ▪ For the next 16 weeks agencies process implemented:
reminders available contact info contact centres try to recover the ▪ Competitive tenders
debts; will be run to sell
▪ Pre-collection ▪ Automated Direct debit
calls for risky process in place till 60 ▪ Incentive program tailored to NPL portfolios
client segment DPD’s stimulate agency performance and
competition
84%+ of all cash collected is done
in-house within the first 60 DPD’s
13Core of Our Business – Artificial Intelligence (AI)
IDF Technology: IT team IDF Lab: Risk and Data analytics team
186 Chief Technical Officer 39 Chief Risk Officer
people people
employed employed
Quality assurance
Portfolio management
Developers
Business Analysts Data science
Security
System Administration Financial modelling
AI expertise
14Section 3
Financial performance
15Solid growth and superior risk-adjusted margins
Strong revenue growth (EUR m) Loan issuance (EUR m)
+111% +47% +129% +24%
48.5 47.5
100.4
87.1
32.3 70.2
23.0
43.9
2018 2019 9M 2019 9M 2020 2018 2019 9М 2019 9М 2020
Best-in class risk-adjusted NIM... (%) …well above the peers
Risk-adjusted NIM1, %
91.5% 92.6% 93.3% 93.3%
75.0%
23.5% 23.5% 20.3%
12.4%
2018 2019 9М 2020
1– IDF Spain data as of 9М 2020, for other companies – as of 1H 2020. Risk-adjusted NIM is defined as net interest margin after provisions,
divided by the portfolio 16Strong operating efficiency and profitability
High operating margin Leading Cost / Income ratio1
34.2%
70.5%
25.3% 25.9% 26.6% 63.8%
59.6%
11.7 12.1 51.5%
47.5%
2.6 2.5
7.5 8.0
1.2 1.7
9.0 9.6 26.6%
6.3 6.3
2018 2019 9M 2019 9M 2020
Administrative expenses, EUR m
Marketing and issue expenses, EUR m
Cost / Income, %
Robust profitability Maintained profitability during the crisis
ROAE Net profit margin1, %
143.9% 64.3% 12.6%
7.2%
3.3 3.4
1.8 -1.9%
-5.3%
-8.9%
0.1
-15.1%
2018 2019 9M 2019 9M 2020
Net income, EUR m xx ROAE, %
1 – IDF Spain data as of 9M 2020, for other companies – as of 1H 2020
17Healthy asset quality and conservative provisioning
NPL ratios (Stage 3 / Gross loans, %)1
43.7%
▪ Stable asset quality metrics and conservative
38.6%
provisioning
28.4%
▪ To address economic turmoil amid COVID-19
outbreak IDF Spain instantly adopted
precautious measures:
2018 2019 9M 2020
− Tighten credit policy and loan underwriting
NPL coverage (%)
− Decreased approval rates
149.0% − Enhanced portfolio monitoring
127.5% 120.9%
▪ These allowed the Company to maintain
portfolio quality and decrease NPLs in
9M 2020 even lower than expected
2018 2019 9M 2020
1 – includes loans with 90+ days delay
18Strong liquidity profile and capital position
Equity / Assets Cash and Cash equivalents / Assets
13.9%
20.1%
11.0%
16.4%
8.4%
min. requirement 5%
n/a
2018 2019 9M 2020
2018 2019 9M 2020
Strong capital adequacy vs. peers Highest interest coverage vs. peers
Equity / Assets1, % EBIT / Interest expenses1, %
33.0%
3.2
20.0% 2.7
17.0% 16.0%
12.0%
8.0% 0.9 0.9
0.6
-0.7
1 – IDF Spain data as of 9M 2020, for other companies – as of 1H 2020
19Resilient performance amid COVID-19 outbreak
1 Resilient performance 2 Asset quality intact
9M 2020 financial results ✓ Tighter credit policy during the COVID-19
outbreak and respective lockdown
EUR 47.5m 47% YoY 27%
Revenue Revenue growth Cost / Income ✓ No deteriorations signs in the portfolio seen
through the crisis
EUR 3.4m
93%
64% ✓ No impact of loan moratorium measures
Risk-adjusted
Net Income ROAE
NIM ✓ NPLs are lower than expected and continue to
improve
3 Strengthened capital adequacy and funding profile
Debt / Equity Equity / Total Assets Share of long-term debt
4.3x
3.5x 20% 58%
16%
29%
Dec-19 Sep-20 Dec-19 Sep-20 Dec-19 Sep-20
20APPENDICES
21Appendix 1. Highly qualified global management team
Boris Batin, PhD Alexander Dunaev, CFA
Co-founder, CEO Co-founder, COO
15+ years of experience 10+ years of experience
Finance Risk management Marketing Legal
Javier Lopez Tim Kostin Alessandro Ceschel Jose Manuel Novo
Chief Financial Officer (CFO) Chief Risk Officer (CRO) Chief Marketing Officer (CMO) Global Head of Legal and
Compliance
20+ years of experience 12+ years of experience 11+ years of experience 11+ years of experience
22Appendix 1. Dedicated team of local professionals
Management Operations Finance Legal Marketing
Carlos Lopez Marco Silva Alex Calvo Helena Fuentes Carlos Martin
Country manager Chief Operating Officer CFO IDF Spain Head of Legal & Marketing Director IDF
IDF Spain (COO) Moneyman Spain Compliance IDF Spain Spain
17+ years of experience 15+ years of experience 11+ years of experience 15+ years of experience 5+ years of experience
23Appendix 2. Corporate and shareholder structure
Venture capital Boris Batine, CEO
Angel Investors Management Crowdcube
(Zilencium Limited) Alex Dunaev, COO
20.6% 29.4% 40.2% 4.2% 5.6%
ID Finance
Investments, S.L.
(Spain)
IT and Risk
IDFinance IDF
ID Finance Brazil IDF CAPITAL
Spain S.L.U. Technology
(OpCo) (Subholding)
(OpCo) (Belarus)
0.1% 1% Branch
(Mexico)
IDF LAB
IDF Servisios Online
FIDC (Russia)
(OpCo) Collect
Debt
management
partners S.L.UAppendix 3. IDF Spain: financial statements
Income statement 9M 2020 results
EUR m 9M 2020 9M 2019 2019 2018
▪ 47% revenue growth vs 9M 2019
Issuance 87.1 70.2 100.4 43.9
▪ Maintained strong profitability 7.2%
Revenue 47.5 32.3 48.5 23.0
Impairment Charges -28.8 -21.0 -30.2 -14.3 ▪ Although clients quality have not
Operating Expenses -9.6 -6.3 -9.0 -6.3 deteriorated through 9M 2020, we
Operating profit 9.2 5.0 9.3 2.5 maintain conservative approach to
-2.1 -1.5 -2.2 -1.1 provisioning due to market uncertainty
Interest expense
Admin and Other Expenses -2.5 -1.7 -2.7 -1.2 ▪ Net profit of EUR 3.4m in 9M 2020
Profit before tax 4.6 1.8 4.4 0.1
▪ Strict cost control and improvement of
Tax -1.1 -0.0 -1.1 0.0
cost/revenue ratios despite decreasing
Net Income 3.4 1.8 3.3 0.1
issuance volumes in Apr-May 2020
KPIs
Revenue growth, % 47% 127% 111% 135%
Operating margin, % 19.3% 15.5% 19.1% 10.8% IDF Spain is audited by
PBT margin, % 9.6% 5.5% 9.0% 0.5%
Net income margin, % 7.2% 5.5% 6.7% 0.3%
Interest coverage 3.2 2.2 3.0 1.1
25Appendix 3. IDF Spain: financial statements
Balance sheet 9M 2020 results
€m 9M 2020 2019 2018
Cash 4.8 4.6 1.2 ▪ Liquidity buffer: keep liquidity at a level over
Net portfolio 24.4 23.3 11.4 10% of assets
Other assets 14.7 5.1 2.2
▪ Control for portfolio quality: decrease from
Total assets 43.9 33.0 14.8
43.7% to 28.4% in 9M 2020
Loans and borrowings 31.2 23.4 12.7
▪ Strengthening equity/asset ratio of 20.1% for
incl. Intercompany loans 0.0 4.9 7.0
9M 2020 vs 16.4% in 2019
Other liabilities 3.8 4.2 2.9
Equity 8.8 5.4 -0.9 ▪ Leverage keeps decreasing from 4.3 to 3.5
Total liabilities and equity 43.9 33.0 14.8 debt/equity ratio
KPIs
▪ Strong income/asset ratio of 16%
Cash / Assets 11.0% 13.9% 8.4%
(annualized) despite the crisis
Equity / Assets 20.1% 16.4% neg.
Debt / Equity 3.53 4.33 neg.
Net Debt / Equity 2.99 3.48 neg.
Pre-tax income / av.assets 15.9% 18.2% 1.0%
26You can also read