UBS Swiss Real Estate Bubble Index 2Q 2021
←
→
Page content transcription
If your browser does not render page correctly, please read the page content below

10 August 2021, 07:00AM UTC
                                                                                               Chief Investment Office GWM
                                                                                               Investment Research

UBS Swiss Real Estate Bubble Index 2Q 2021
UBS Swiss real estate bubble index
Authors: Matthias Holzhey, Economist, UBS Switzerland AG; Maciej Skoczek, CFA, CAIA, Economist, UBS Switzerland AG; Katharina Hofer, Economist,
UBS Switzerland AG; Claudio Saputelli, Economist, UBS Switzerland AG

 • The UBS Swiss Real Estate Bubble Index measures
     the risk of a real estate bubble in the Swiss
     residential housing market.
 • The index rose to 1.90 points in the second quarter
     of 2021, driven by a rapid rise in prices in the Swiss
     residential housing market.
 • Growth in household mortgage debt has also
     gradually increased in recent months. However, the
     index is forecast to fall back slightly by the end of
     the year.

                                                                            Quellen: Mauro Mellone, UBS

The UBS Swiss Real Estate Bubble Index rose slightly
from 1.78 to 1.90 points in the second quarter of 2021,                     UBS Swiss Real Estate Bubble Index
remaining in the risk zone. The increase was driven by
large price increases in the residential housing market and
accelerated growth in household mortgage volumes.

Households going deeper into debt
Residential housing prices rose 5.4 percent year-on-year in
the second quarter of 2021. This is the largest increase in
eight years. Income growth was unable to match that pace.
Pre-COVID-19, the average price of a residential property
was just under 6.5 times annual income. Today, it probably
runs around 7.1 times annual income. Home affordability
has thus deteriorated further.

Growth in outstanding mortgages to private households has                   Quelle: UBS
accelerated constantly in recent months. Mortgage volumes                   Index calculation: The UBS Swiss Real Estate Bubble
are nearly 3 percent higher today than they were a year                     Index comprises six sub-indices. It is calculated as the
ago. The growth rates are still well below their historical all-            weighted average of standardized indicators, using primary
time highs, but any further acceleration would be a warning                 component analysis, and shows the deviation in standard
signal: A combination of debt increased boom and rapid                      deviations from the average, which is standardized to
price growth has almost always been a harbinger of growing
                                                                            zero.The index uses the following classification: Slump
imbalances, whether in Switzerland or worldwide.
                                                                            (below -1), Balance (from -1 to less than 0), Boom (from 0
                                                                            to less than1), Risk (from 1 to less than 2) and Bubble (2 and
                                                                            upwards).

This report has been prepared by UBS Switzerland AG. Please see important disclaimers and disclosures at the end of
the document.
UBS Swiss real estate bubble index

Investment demand remains strong                                 UBS Swiss Real Estate Bubble Index
At the same time, offering rents have fallen 3.2 percent
year-on-year—the steepest drop since 1996. The widening
gap between residential property prices and apartment
rents has exacerbated risks, particularly in the buy-to-let
segment. Achievable returns have fallen to record lows, but
investment demand remains buoyant. The expectation of
further price increases is the main motivation for investing
in buy-to-let properties.

The economic recovery in the second half of the current
year should prevent the index from rising into the bubble
risk zone for now, in our view. We currently expect an
index level of 1.69 for the final quarter of 2021, which is
below the current level. This year-end forecast value was
introduced due to the volatility in current data (see comment
below). However, once the pandemic fades, we expect the
residential housing market imbalances to be considerably
higher than before the crisis.

Comment: Business restrictions due to COVID-19 continue
to cause considerable volatility in the economic
performance. This has led to major fluctuations in our
model-based assessment of the real estate bubble risk for
the Swiss residential housing market. Due to this volatility,
we will, for the time being, present the expected trend in the
UBS Swiss Real Estate Bubble Index until the end of the year
based on our forecasts for the performance of the economy
and the real estate market.

                                                                 k
                                                                 k
                                                                 k
                                                                 k
                                                                 k
                                                                 kk
                                                                 k
                                                                 k
                                                                 kk
                                                                 k

                                                                                                      02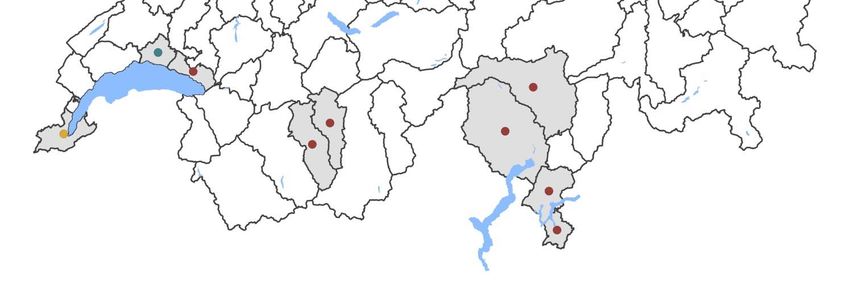
UBS Swiss real estate bubble index

     Sub-indexes of the UBS Swiss Real Estate Bubble Index

     Home prices to annual rents                                 Level
                                                                 37.5
     An above-average price-to-rent ratio indicates a high                                                          Bubble
     dependency on sustained low interest rates or implies       34.2
     expectations of price increases.                                                                               Risk
                                                                 31.0
                                                                                                                    Boom
                                                                 27.7
                                                                                                                    Balance
                                                                 24.5

                                                                 21.2                                               Slump

                                                                 17.9
                                                                     1981 1986 1991 1996 2001 2006 2011 2016 2021

                                                                 Sources: SNB, UBS                 Forecast

     Home prices to household income                             Level
                                                                 7.8
     The indicator shows whether the price behavior of the                                                          Bubble
     owner-occupied housing market is supported by a change in   7.0
     household income. A decoupling of prices from average                                                          Risk
     household income can be interpreted as a sign of interest   6.1
     rate risks.                                                                                                    Boom
                                                                 5.3
                                                                                                                    Balance
                                                                 4.5

                                                                 3.6                                                Slump

                                                                 2.8
                                                                    1981 1986 1991 1996 2001 2006 2011 2016 2021

                                                                 Sources: SNB, FSO, UBS            Forecast

     Construction relative to gross domestic product (GDP)       Share of total
                                                                 15.0
     The construction sector gaining weighting within the                                                           Bubble
     national economy can signal an overheating of the real      13.4
     estate market.                                                                                                 Risk
                                                                 11.7
                                                                                                                    Boom
                                                                 10.1
                                                                                                                    Balance
                                                                  8.5

                                                                  6.9                                               Slump

                                                                  5.3
                                                                     1981 1986 1991 1996 2001 2006 2011 2016 2021

                                                                 Sources: SECO, FSO, UBS           Forecast

                                                                                                                              03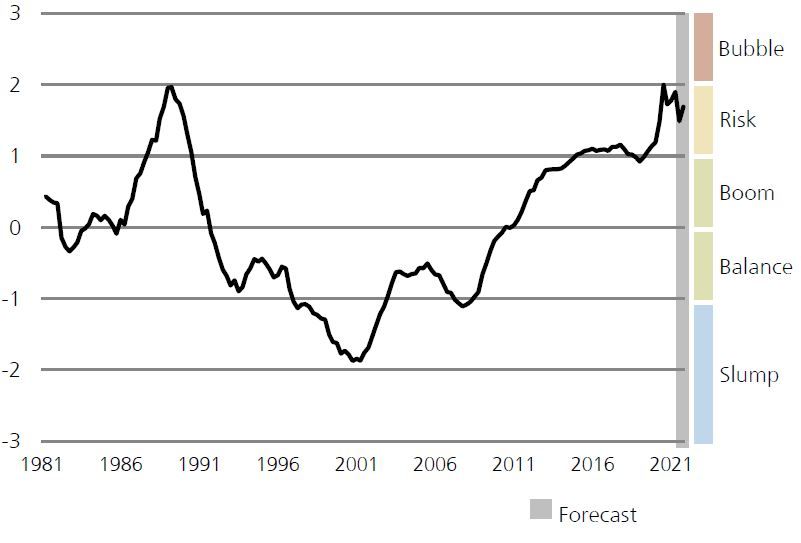
UBS Swiss real estate bubble index

     Sub-indexes of the UBS Swiss Real Estate Bubble Index

     Home prices relative to consumer prices                           Real owner-occupied housing price index (CHF/m2)
                                                                      7,793
     Over the long term, owner-occupied housing prices are likely                                                                       Bubble
     to relate to construction costs and general inflation. A sharp   6,856
     and lasting increase in inflation-adjusted owner-occupied                                                                          Risk
     housing prices is thus a warning signal for a possible           5,919
     correction.                                                                                                                        Boom
                                                                      4,982
                                                                                                                                        Balance
                                                                      4,045

                                                                      3,108                                                             Slump

                                                                      2,171
                                                                           1981 1986 1991 1996 2001 2006 2011 2016 2021

                                                                       Sources: SNB, FSO, UBS                        Forecast

     Mortgage volume relative to disposable income of                  Mortgages of private households relative to income (trend-adjusted,
     private households                                                standardized)
     Any sharp growth in mortgage debt is a clear indication of        3
     the owner-occupied housing market overheating. If interest                                                                         Bubble
     rates rise or owner-occupied housing prices correct, high         2
     household debt increases the negative consequences for the                                                                         Risk
     national economy.                                                 1
                                                                                                                                        Boom
                                                                       0
                                                                                                                                        Balance
                                                                       -1

                                                                       -2                                                               Slump

                                                                       -3
                                                                         1981 1986 1991 1996 2001 2006 2011 2016 2021

                                                                       Sources: SNB, FSO, UBS                        Forecast

     Credit applications for residential real estate not               Share of total
     intended for self-occupancy (UBS clients)
                                                                      26.0
     High demand for residential property for the purpose of                                                                           Bubble
     leasing (buy-to-let) indicates greater speculative demand.       22.7
                                                                                                                                       Risk
                                                                      19.4
                                                                                                                                       Boom
                                                                      16.2
                                                                                                                                       Balance
                                                                      12.9

                                                                       9.6                                                             Slump

                                                                       6.3
                                                                          2007   2009    2011   2013   2015   2017     2019     2021

                                                                       Source: UBS                                   Forecast

                                                                                                                                                  04
UBS Swiss real estate bubble index
Regional risk map
The regional risk map shows the regions with the most
pronounced risks in the housing market. Regionally, three types
of risks can be distinguished. There has been an increase in
fundamental risk – decoupling home prices from household
income and rental price levels. In addition, the boom in the
housing market in some regions has caused a sharp rise in the
risk of overheating – a significant overhang in demand causes
prices to overshoot. There are also regions where liquidity risk –
a lot of supply with little demand making it difficult to sell – is
elevated. This map replaces the previous regional risk map and is
updated every six months.
Risk regions in the Swiss residential real estate market
Fundamental risk
Overheating risk
Liquidity risk
Source: UBS
05UBS Swiss real estate bubble index
Appendix
UBS Chief Investment Office's ("CIO") investment views are prepared and published by the Global Wealth Management business of UBS Switzerland
AG (regulated by FINMA in Switzerland) or its affiliates ("UBS").
The investment views have been prepared in accordance with legal requirements designed to promote the independence of investment research.
Generic investment research – Risk information:
This publication is for your information only and is not intended as an offer, or a solicitation of an offer, to buy or sell any investment or other
specific product. The analysis contained herein does not constitute a personal recommendation or take into account the particular investment
objectives, investment strategies, financial situation and needs of any specific recipient. It is based on numerous assumptions. Different assumptions
could result in materially different results. Certain services and products are subject to legal restrictions and cannot be offered worldwide on an
unrestricted basis and/or may not be eligible for sale to all investors. All information and opinions expressed in this document were obtained from
sources believed to be reliable and in good faith, but no representation or warranty, express or implied, is made as to its accuracy or completeness
(other than disclosures relating to UBS). All information and opinions as well as any forecasts, estimates and market prices indicated are current
as of the date of this report, and are subject to change without notice. Opinions expressed herein may differ or be contrary to those expressed by
other business areas or divisions of UBS as a result of using different assumptions and/or criteria.
In no circumstances may this document or any of the information (including any forecast, value, index or other calculated amount ("Values")) be
used for any of the following purposes (i) valuation or accounting purposes; (ii) to determine the amounts due or payable, the price or the value of
any financial instrument or financial contract; or (iii) to measure the performance of any financial instrument including, without limitation, for the
purpose of tracking the return or performance of any Value or of defining the asset allocation of portfolio or of computing performance fees. By
receiving this document and the information you will be deemed to represent and warrant to UBS that you will not use this document or otherwise
rely on any of the information for any of the above purposes. UBS and any of its directors or employees may be entitled at any time to hold long
or short positions in investment instruments referred to herein, carry out transactions involving relevant investment instruments in the capacity of
principal or agent, or provide any other services or have officers, who serve as directors, either to/for the issuer, the investment instrument itself or
to/for any company commercially or financially affiliated to such issuers. At any time, investment decisions (including whether to buy, sell or hold
securities) made by UBS and its employees may differ from or be contrary to the opinions expressed in UBS research publications. Some investments
may not be readily realizable since the market in the securities is illiquid and therefore valuing the investment and identifying the risk to which
you are exposed may be difficult to quantify. UBS relies on information barriers to control the flow of information contained in one or more areas
within UBS, into other areas, units, divisions or affiliates of UBS. Futures and options trading is not suitable for every investor as there is a substantial
risk of loss, and losses in excess of an initial investment may occur. Past performance of an investment is no guarantee for its future performance.
Additional information will be made available upon request. Some investments may be subject to sudden and large falls in value and on realization
you may receive back less than you invested or may be required to pay more. Changes in foreign exchange rates may have an adverse effect on
the price, value or income of an investment. The analyst(s) responsible for the preparation of this report may interact with trading desk personnel,
sales personnel and other constituencies for the purpose of gathering, synthesizing and interpreting market information.
Tax treatment depends on the individual circumstances and may be subject to change in the future. UBS does not provide legal or tax advice and
makes no representations as to the tax treatment of assets or the investment returns thereon both in general or with reference to specific client's
circumstances and needs. We are of necessity unable to take into account the particular investment objectives, financial situation and needs of
our individual clients and we would recommend that you take financial and/or tax advice as to the implications (including tax) of investing in any
of the products mentioned herein.
This material may not be reproduced or copies circulated without prior authority of UBS. Unless otherwise agreed in writing UBS expressly prohibits
the distribution and transfer of this material to third parties for any reason. UBS accepts no liability whatsoever for any claims or lawsuits from
any third parties arising from the use or distribution of this material. This report is for distribution only under such circumstances as may be
permitted by applicable law. For information on the ways in which CIO manages conflicts and maintains independence of its investment views and
publication offering, and research and rating methodologies, please visit www.ubs.com/research. Additional information on the relevant authors
of this publication and other CIO publication(s) referenced in this report; and copies of any past reports on this topic; are available upon request
from your client advisor.
Options and futures are not suitable for all investors, and trading in these instruments is considered risky and may be appropriate only for
sophisticated investors. Prior to buying or selling an option, and for the complete risks relating to options, you must receive a copy of "Characteristics
and Risks of Standardized Options". You may read the document at https://www.theocc.com/about/publications/character-risks.jsp or ask your
financial advisor for a copy.
Investing in structured investments involves significant risks. For a detailed discussion of the risks involved in investing in any particular structured
investment, you must read the relevant offering materials for that investment. Structured investments are unsecured obligations of a particular
issuer with returns linked to the performance of an underlying asset. Depending on the terms of the investment, investors could lose all or a
substantial portion of their investment based on the performance of the underlying asset. Investors could also lose their entire investment if the
issuer becomes insolvent. UBS Financial Services Inc. does not guarantee in any way the obligations or the financial condition of any issuer or the
accuracy of any financial information provided by any issuer. Structured investments are not traditional investments and investing in a structured
investment is not equivalent to investing directly in the underlying asset. Structured investments may have limited or no liquidity, and investors
should be prepared to hold their investment to maturity. The return of structured investments may be limited by a maximum gain, participation
rate or other feature. Structured investments may include call features and, if a structured investment is called early, investors would not earn any
further return and may not be able to reinvest in similar investments with similar terms. Structured investments include costs and fees which are
generally embedded in the price of the investment. The tax treatment of a structured investment may be complex and may differ from a direct
investment in the underlying asset. UBS Financial Services Inc. and its employees do not provide tax advice. Investors should consult their own tax
advisor about their own tax situation before investing in any securities.
Important Information About Sustainable Investing Strategies: Sustainable investing strategies aim to consider and incorporate
environmental, social and governance (ESG) factors into investment process and portfolio construction. Strategies across geographies and styles
06UBS Swiss real estate bubble index
approach ESG analysis and incorporate the findings in a variety of ways. Incorporating ESG factors or Sustainable Investing considerations may
inhibit the portfolio manager’s ability to participate in certain investment opportunities that otherwise would be consistent with its investment
objective and other principal investment strategies. The returns on a portfolio consisting primarily of sustainable investments may be lower or
higher than portfolios where ESG factors, exclusions, or other sustainability issues are not considered by the portfolio manager, and the investment
opportunities available to such portfolios may differ. Companies may not necessarily meet high performance standards on all aspects of ESG
or sustainable investing issues; there is also no guarantee that any company will meet expectations in connection with corporate responsibility,
sustainability, and/or impact performance.
External Asset Managers / External Financial Consultants: In case this research or publication is provided to an External Asset Manager or
an External Financial Consultant, UBS expressly prohibits that it is redistributed by the External Asset Manager or the External Financial Consultant
and is made available to their clients and/or third parties.
USA: This document is not intended for distribution into the US and / or to US persons.
For country information, please visit ubs.com/cio-country-disclaimer-gr or ask your client advisor for the full disclaimer.
Version A/2021. CIO82652744
© UBS 2021.The key symbol and UBS are among the registered and unregistered trademarks of UBS. All rights reserved.
07You can also read


