United States Virgin Islands - COMPREHENSIVE HOUSING MARKET ANALYSIS U.S. Department of Housing and Urban Development, Office of Policy ...
←
→
Page content transcription
If your browser does not render page correctly, please read the page content below

COMPREHENSIVE HOUSING MARKET ANALYSIS

 United States Virgin Islands

U.S. Department of Housing and Urban Development,
Office of Policy Development and Research
As of August 1, 2019

Share on:
United States Virgin Islands Comprehensive Housing Market Analysis as of August 1, 2019 Executive Summary 2
Executive Summary
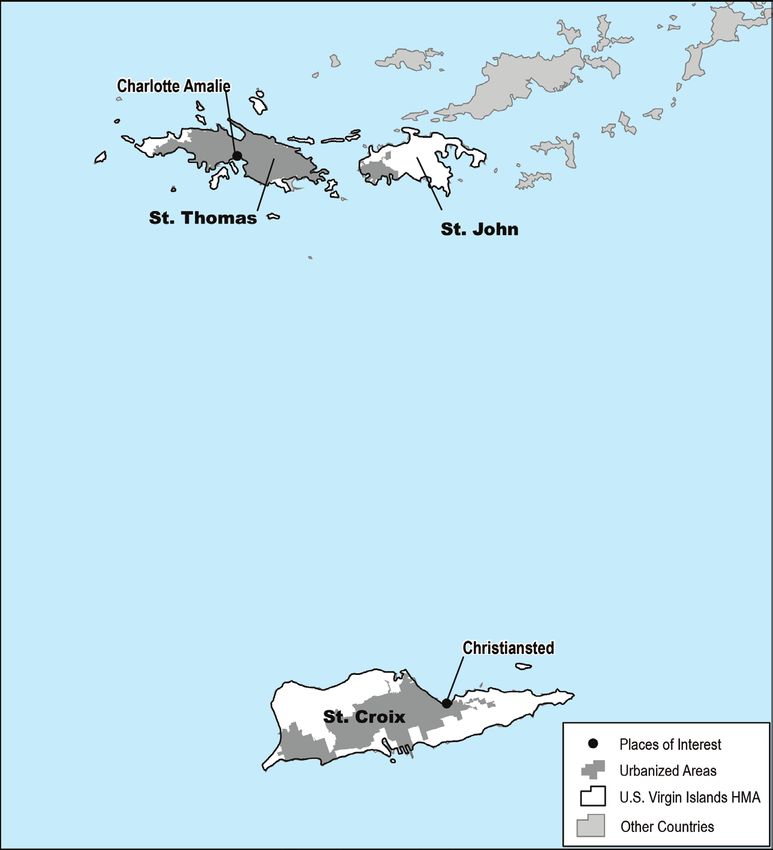
Housing Market Area Description
The United States Virgin Islands (hereafter, USVI) is approximately
40 miles east of Puerto Rico in the Caribbean Sea.
The current population of the USVI is estimated at 101,900.
During September 2017, two hurricanes, Irma and Maria, impacted
the USVI, with Maria being the more damaging storm. More
than one-half of all households in the territory reported damage
associated with the hurricanes, with more than 10 percent of
all households reporting major or severe damage. Significant
work remains, although recovery efforts have resulted in notable
Tools and Resources
improvements throughout the territory since late 2017.
Find interim updates for this territory, and select geographies nationally,
(Federal Emergency Management Agency, as of March 30, 2018). at PD&R’s Market-at-a-Glance tool.
Additional data for the HMA can be found in this report’s supplemental tables.
For information on HUD-supported activity in this area, see the Community Assessment Reporting Tool.
Comprehensive Housing Market Analysis United States Virgin Islands
U.S. Department of Housing and Urban Development, Office of Policy Development and Research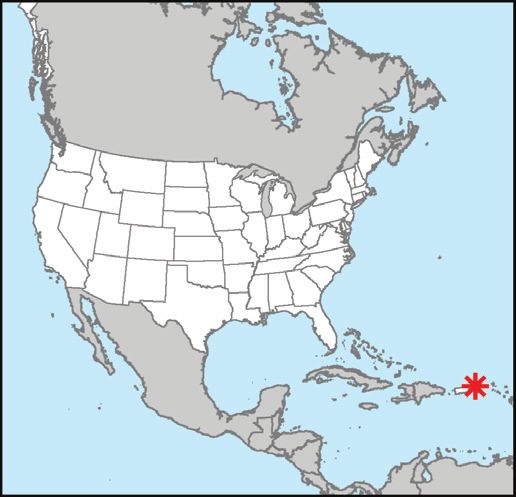
United States Virgin Islands Comprehensive Housing Market Analysis as of August 1, 2019                                                                                                 Executive Summary 3

Market Qualifiers
Economy                                                               Sales Market                                                                  Rental Market
             Weak but improving: with 400 jobs                                       Balanced: with a total of 380 homes                                           Tight: with rents more than doubling
             added during the 12 months ending                                       sold during the first 7 months of 2019,                                       for many one-, two-, and three-
             July 2019.                                                              a 31-percent increase from the same                                           bedroom units since late 2017.
                                                                                     period a year ago.

Economic conditions in the USVI are improving                         The sales market in the HMA is currently balanced.                            The rental housing market in the HMA is currently
following the impact of Hurricanes Maria and Irma in                  Reduced inventory associated with hurricane                                   tight because an influx of workers associated with
September 2017. During the 12 months ending July                      damage continues to limit available supply, and                               recovery efforts and the reopening of the Hovensa,
2019, nonfarm payrolls increased by 400 jobs, or                      renewed demand for seasonal and second homes                                  now known as the Limetree Bay, petroleum refinery
1.2 percent, after declining 11.7 percent during the                  contributed to a 10-percent increase in the average                           on St. Croix have absorbed a significant share of
previous 12 months. The unemployment rate in the                      home sales price during the past year. As of                                  the available inventory since late 2018. The overall
territory averaged 6.6 percent during the 12 months                   August 1, 2019, the overall sales vacancy rate was                            rental vacancy rate is currently estimated at 6.5
ending July 2019, well below the 11.6-percent rate                    estimated at 3.4 percent, down from 3.7 percent                               percent, down from 13.8 percent in April 2010.
during the 12 months ending July 2018. During the                     in April 2010. Population growth and improving                                During the next 3 years, demand in the HMA is
3-year forecast period, nonfarm payroll growth in the                 economic conditions are expected to contribute to                             expected for 940 new rental units. The 90 units
territory is expected to average 2.2 percent annually,                demand for an estimated 800 new for-sale units                                currently estimated to be under construction will
as tourism revenue increases and significant                          (primary residences) during the next 3 years. The 240                         satisfy some of that demand.
infrastructure development efforts continue.                          homes currently estimated to be under construction
                                                                      will absorb some of that demand.

TABLE OF CONTENTS
Economic Conditions 4                                                                                                   3-Year Housing Demand Forecast
Population and Households 9                                                                                                                                       Sales Units                    Rental Units
Home Sales Market Conditions 13                                                                                            Total Demand                                800                            940
                                                                         United States Virgin Islands HMA
                                                                                                                           Under Construction                          240                              90
Rental Market Conditions 17                                             Notes: Total demand represents estimated production necessary to achieve a balanced market at the end of the forecast period. Units under
Terminology Definitions and Notes 20                                    construction as of August 1, 2019. The forecast period is August 1, 2019, to August 1, 2022.
                                                                        Source: Estimates by the analyst

                                                                                                                      Comprehensive Housing Market Analysis United States Virgin Islands
                                                                                                          U.S. Department of Housing and Urban Development, Office of Policy Development and Research
United States Virgin Islands Comprehensive Housing Market Analysis as of August 1, 2019 Economic Conditions 4
Economic Conditions Figure 1. Share of Nonfarm Payroll Jobs in the United States
Virgin Islands HMA, by Sector
Largest sector: Government
Mining, Logging, & Construction 7%
Manufacturing 2%
Economic conditions in the territory are weak due in part to the Wholesale 2%
impact of Hurricanes Irma and Maria; however, conditions improved State 28%
notably during the past year.
Retail 15%
Primary Local Economic Factors Government
31% Trade 17%
Tourism is significant to the economic foundation of the USVI. Despite the Total
34.2
lingering effects of Hurricanes Irma and Maria, the territory welcomed 1.94
Transportation & Utilities 4%
million visitors and received $1.0 billion in tourism-related revenue in 2018 Federal 3%
Information 2%
(USVI Bureau of Economic Research [VIBER]). The number of jobs in the
Other Services 3%
leisure and hospitality sector, which benefits most directly from tourism, Financial Activities 5%
declined dramatically following the hurricanes but still accounted for 13
Leisure & Hospitality 13%
percent of total nonfarm payrolls in the territory during the 12 months ending Professional & Business Services 10%
Education & Health Services 6%
July 2019 (Figure 1). The sector includes many resorts. Marriott’s Frenchman’s
Cove (St. Thomas), The Buccaneer Hotel (St. Croix), and The Westin St. John
Notes: Total nonfarm payroll is in thousands. Percentages may not add to 100 percent due to rounding.
are currently among the largest employers on their respective islands Based on 12-month averages through July 2019.
Source: U.S. Bureau of Labor Statistics
(Table 1).
Table 1. Major Employers in the United States Virgin Islands HMA
Current Conditions—Nonfarm payrolls
Number of
The territory added jobs during the past year mostly because of Name of Employer Nonfarm Payroll Sector Employees
redevelopment efforts. Nonfarm payrolls in the USVI increased by 400 jobs, Government of U.S. Virgin Islands Government 9,700
or 1.2 percent, to an average of 34,200 jobs during the 12 months ending U.S. Government Government 900
July 2019 (Table 2). The largest job gains were in the mining, logging, and Gov. Juan F. Luis Hospital & Medical Center Education & Health Services 501-700
construction sector, which increased by 300 jobs, or 13.6 percent. Ongoing Kmart Wholesale & Retail Trade 501-700
repairs of structures damaged by the hurricanes and work associated with PSI Tire Supply LLC Wholesale & Retail Trade 501-700
Schneider Regional Medical Center Education & Health Services 501-700
the reopening of the Limetree Bay refinery facility on St. Croix, which began
Westin Resorts Leisure & Hospitality 501-700
in late 2018, contributed to gains in the sector. Work at Limetree Bay also
Buccaneer Hotel, Inc. Leisure & Hospitality 301-500
contributed to gains in the manufacturing sector, which added 100 jobs, or Marriott Frenchman’s Cove Leisure & Hospitality 301-500
20.0 percent, and the professional and business services sector, which Note: Data include military personnel, who are generally not included in nonfarm payroll survey data.
added 200 jobs, or 6.1 percent. Sources: U.S. Virgin Islands Department of Labor; field work by the analyst
Comprehensive Housing Market Analysis United States Virgin Islands
U.S. Department of Housing and Urban Development, Office of Policy Development and ResearchUnited States Virgin Islands Comprehensive Housing Market Analysis as of August 1, 2019 Economic Conditions 5
Table 2. Nonfarm Payroll Jobs (1,000s) in the July 2018, and less than one-half the 13.4-percent peak unemployment rate during
United States Virgin Islands HMA, by Sector 2013. By comparison, the unemployment rate for the nation was 3.8 percent
12 Months 12 Months
Absolute Percentage during the 12 months ending July 2019, down from 4.1 percent during the previous
Ending Ending Change Change
July 2018 July 2019 12 months and well below the recent peak of 9.6 percent in 2010 (Figure 2).
Total Nonfarm Payroll Jobs 33.8 34.2 0.4 1.2
Goods-Producing Sectors 2.7 3.0 0.3 11.1 Figure 2. 12-Month Average Unemployment Rate in the United States
Mining, Logging, & Construction 2.2 2.5 0.3 13.6 Virgin Islands HMA and the Nation
Manufacturing 0.5 0.6 0.1 20.0
Service-Providing Sectors 31.1 31.1 0.0 0.0 United States Virgin Islands HMA Nation
Wholesale & Retail Trade 5.5 5.7 0.2 3.6 16
Transportation & Utilities 1.3 1.3 0.0 0.0
14
Information 0.7 0.6 -0.1 -14.3
Financial Activities 1.9 1.9 0.0 0.0 12
Unemployment Rate
Professional & Business Services 3.3 3.5 0.2 6.1
10
Education & Health Services 2.1 2.2 0.1 4.8
8
(%)
Leisure & Hospitality 4.8 4.4 -0.4 -8.3
Other Services 0.9 1.0 0.1 11.1 6
Government 10.6 10.6 0.0 0.0
4
Notes: Based on 12-month averages through July 2018 and July 2019. Numbers may not add to totals due to
rounding. Data are in thousands. 2
Source: U.S. Bureau of Labor Statistics
0
Current Conditions—Unemployment
0
Ju 5
Ju 6
Ju 2
Ju 8
9
Ju 3
Ju 4
Ju 7
Ju 1
0
5
6
8
9
2
3
4
7
1
l-0
l-0
l-0
l-0
l-0
l-0
l-0
l-0
l-0
l-0
l-1
l-1
l-1
l-1
l-1
l-1
l-1
l-1
l-1
l-1
Ju
Ju
Ju
Ju
Ju
Ju
Ju
Ju
Ju
Ju
Ju
Ju
The unemployment rate in the territory was 6.6 percent during the 12 months
ending July 2019, well below the 11.6-percent rate during the 12 months ending Sources: U.S. Bureau of Labor Statistics; U.S. Virgin Islands Department of Labor
Economic Periods of Significance education and health services sector, which has been the fastest growing sector
in the territory since 2000 (Figure 3). From 2004 through 2007, the sector added
2004 through 2010 an average of 100 jobs, or 2.7 percent, annually, including the jobs created at
The territory added an average of 1,000 jobs, or 2.2 percent, each year from The Charlotte Kimelman Cancer Institute on St. Thomas, which opened in 2005.
2004 through 2007. The mining, logging, and construction sector led job gains The USVI had a shorter and modestly less severe economic downturn in the late
during the period and expanded at an average annual rate of 400 jobs, or 18.9 2000s than the nation. Nonfarm payrolls in the territory declined by an average
percent. Increased construction activity contributed significantly to job growth of 1,000 jobs, or 2.3 percent, a year during 2008 and 2009 compared with an
in the sector. The total value of all construction permits issued averaged $357.3 average annual decline of 2.5 percent each year in the United States during the
million a year during the period, up nearly 60 percent from an average of $226.3 period. The number of jobs in the United States declined 0.7 percent in 2010,
million a year from 2001 through 2003. Notable growth also occurred in the while the territory added 500 jobs, or 1.1 percent (Figure 4).
Comprehensive Housing Market Analysis United States Virgin Islands
U.S. Department of Housing and Urban Development, Office of Policy Development and ResearchUnited States Virgin Islands Comprehensive Housing Market Analysis as of August 1, 2019 Economic Conditions 6
Figure 3. Sector Growth in the United States Figure 4. 12-Month Average Nonfarm Payrolls in the
Virgin Islands HMA, 2001 to Current United States Virgin Islands HMA
National Recession Nonfarm Payrolls
Total Nonfarm Payroll Jobs
Goods-Producing Sectors 50
Mining, Logging, & Construction
Nonfarm Payrolls (in Thousands)
Manufacturing
Service-Providing Sectors 45
Wholesale & Retail Trade
Transportation & Utilities
Information 40
Financial Activities
Professional & Business Services
Education & Health Services 35
Leisure & Hospitality
Other Services
Government
-80 -60 -40 -20 0 20 40 30
Change in Jobs (%)
0
Ju 5
Ju 2
Ju 6
Ju 8
9
Ju 3
Ju 4
Ju 7
Ju 1
0
5
6
2
8
9
3
4
7
1
l-0
l-0
l-0
l-0
l-0
l-0
l-0
l-0
l-0
l-0
l-1
l-1
l-1
l-1
l-1
l-1
l-1
l-1
l-1
l-1
Ju
Ju
Ju
Ju
Ju
Ju
Ju
Ju
Ju
Ju
Ju
Ju
Note: The current date is August 1, 2019. Note: 12-month moving average.
Source: U.S. Bureau of Labor Statistics Sources: U.S. Bureau of Labor Statistics; National Bureau of Economic Research
2011 through 2016 Improving economic conditions throughout much of the world, particularly in
A decline of 400 jobs, or 0.9 percent, in 2011 largely offset the gains in the USVI the United States, contributed to an increase in tourism and a modest economic
during the previous year. The Hovensa petroleum refinery, which employed recovery in the territory in 2015 and 2016. During the period, nonfarm payrolls
as many as 2,200 workers while in operation and was the largest private increased by an average of 200 jobs, or 0.5 percent annually. Nearly all those
employer in the territory in 2011, closed in 2012, laying off 2,000 workers, which gains were associated with tourism when total visitor expenditures rose an
contributed to nonfarm payrolls declining by an average of 2,000 jobs, or 4.8 average of 1 percent a year and the leisure and hospitality sector added an
percent, each year from 2012 through 2014. Most of the jobs at the Hovensa average of 200 jobs, or 3.0 percent a year.
facility were in the manufacturing sector, which declined by an average of 500 Hurricanes Irma and Maria
jobs, or 32.7 percent, annually during the period. The impact of the closure was The territory continued to add jobs at a modest pace during early 2017, and
also notable in the government sector, which declined by an average of 600 nonfarm payrolls increased by 200 jobs, or 0.5 percent, during the 12 months
jobs, or 5.0 percent, annually from 2012 through 2014. All those losses were ending July 2017. Those gains were dwarfed, however, by the impact of
associated with layoffs by the territorial government whose operating budget Hurricanes Irma and Maria, which made landfall in September 2017. In the
declined an average of 6 percent a year in 2012 and 2013. In total, the Hovensa immediate aftermath of the storms, 95 percent of the territory was without
closure contributed to a 15-percent decline in the gross product of the territory, power, while a similar percentage of U.S. Virgin Islands Waste Management
which fell from $4.2 billion in 2011 to $3.6 billion in 2014 (VIBER). Authority (WMA) customers experienced disruptions in wastewater service.
Comprehensive Housing Market Analysis United States Virgin Islands
U.S. Department of Housing and Urban Development, Office of Policy Development and ResearchUnited States Virgin Islands Comprehensive Housing Market Analysis as of August 1, 2019 Economic Conditions 7
The main airports on both St. Croix and St. Thomas were closed for 2 weeks The trade sector was also significantly impacted by the decline in tourism and
because of extensive damage, and all seaports were closed for 3 weeks decreased by 1,000 jobs, or 15.8 percent, during the 12 months ending July 2018,
because 400 vessels were sunk. Major roadways were obstructed by mudslides, with the retail trade subsector accounting for nearly all the decline.
flooding, downed power lines, and debris for more than a month while healthcare
facilities, schools, and more than one-half of all households reported damage. In Recovery Efforts
total, the storms resulted in an estimated $10.8 billion of damage and thousands Significant work remains, although recovery efforts, which were supported by
of residents leaving the territory. (USVI Housing Finance Authority [VIHFA]). $459 million in federal funding during the fourth quarter of 2017 alone, have
resulted in notable improvements throughout the territory. Wastewater service
The impact of the hurricanes continued throughout much of 2018. Nonfarm
was restored to all customers within 30 days of the hurricanes, and partly
payrolls declined by 4,500 jobs, or 11.7 percent, during the 12 months ending July
because of the clearing of 22.3 million cubic feet of debris, power has been
2018, while the unemployment rate rose sharply. Job losses were widespread,
restored to all eligible residents in the territory since March 2018 (WMA, VIHFA,
although sectors associated with tourism decreased significantly, including the
Virgin Islands Water and Power Authority). Several healthcare facilities remain
leisure and hospitality sector, which lost 2,900 jobs, a decline of 37.8 percent.
closed or are operating at less than full capacity in the territory, although the
Nearly all major resorts were closed for at least part of the period with several
Myrah Keating Smith Clinic (St. John) reopened in March 2019, and the first
damaged severely. The Ritz-Carlton, as well as Frenchman’s Reef and Morningstar
phase of repairs at the Schulterbrandt Living Facility (St. Thomas) was completed
Beach Resort on St. Thomas, Divi Carina Resort on St. Croix, and the Caneel Bay
in April 2019. Significant repair work is still necessary at many schools; however,
Resort, which was the largest employer on St. John prior to the hurricanes, have
nearly all have returned to full sessions in 2019 after only having partial sessions
yet to reopen. Those closures exacerbated an already steep decline in tourism
expenditures, which fell 10 percent in 2017 and 13 percent in 2018 (Figure 5). in 2018. Several major resorts also resumed operations during the past year,
contributing to increased tourism. From January through July of 2019, airline
Figure 5. Total Tourism Expenditures in the passenger activity to the territory rose 52 percent from the same period in 2018
United States Virgin Islands HMA partly because of renewed operations at The Buccaneer Hotel and Marriott’s
Frenchman’s Cove, both of which returned to full capacity in mid-2018, as well
1.4
as The Westin St. John, which reopened in early 2019.
1.3
Employment Forecast
Economic conditions in the USVI are expected to improve significantly during the
Billions
1.2
($)
next 3 years due in large part to an estimated average nonfarm payroll growth of
2.2 percent a year. The reopening of the Limetree Bay refinery will continue to
1.1 contribute to the economy of the territory, particularly on the island of St. Croix.
Construction at the facility currently supports approximately 1,300 jobs, with 700
permanent jobs expected to be created when production resumes in early 2020.
1.0
2010 2011 2012 2013 2014 2015 2016 2017 2018 The leisure and hospitality sector is also expected to expand during the forecast
Source: U.S. Virgin Islands Bureau of Economic Research
period, with job growth stemming from the reopening of several major resorts.
Comprehensive Housing Market Analysis United States Virgin Islands
U.S. Department of Housing and Urban Development, Office of Policy Development and ResearchUnited States Virgin Islands Comprehensive Housing Market Analysis as of August 1, 2019 Economic Conditions 8
The Ritz Carlton is scheduled to reopen in December 2019, followed soon after work on a $500 million infrastructure project, which includes improvements
by the Divi Carina Resort (St. Croix), Frenchman’s Reef and Morningstar Beach to roadways, drainage, utilities, signage, lighting, and traffic management
Resort (St. Thomas), and The Renaissance St. Croix Carambola Beach Resort & control during the next decade. In March 2019, the U.S. Economic Development
Spa in 2020. The total economic impact of those openings is currently unknown, Administration awarded the Virgin Islands Port Authority $27 million in funds for
although the four resorts combined to account for more than 1,000 jobs prior expansions of both the Cyril E. King Airport (St. Thomas) and Henry E. Rohlsen
to the hurricanes. Airport (St. Croix). On completion, the two expansions are expected to create as
The territory is also expected to benefit substantially from continued investment many as 160 permanent jobs. In addition to those projects, in early 2018, the
in infrastructure. Construction associated with the St. Thomas’ Veteran’s U.S. Department of Housing and Urban Development (HUD) awarded nearly
Drive Improvement Project, which includes widening a 3-mile long stretch of $1.9 billion in Community Development Block Grant Disaster Relief funds for the
the primary roadway running through the capital city of Charlotte Amalie, is purpose of unmet needs in housing, infrastructure, and economic revitalization
expected to intensify during the next 2 years with completion scheduled for from the 2017 hurricanes and for mitigation activities to protect the territory from
2021. The Virgin Islands Department of Public Works is also expected to increase damage in future events.
Comprehensive Housing Market Analysis United States Virgin Islands
U.S. Department of Housing and Urban Development, Office of Policy Development and ResearchUnited States Virgin Islands Comprehensive Housing Market Analysis as of August 1, 2019 Population and Households 9
Population and Households 2005, the population of the territory declined by an average of 160, or 0.1 percent,
each year (2000 Census Bureau and United Nations [UN] population estimates
Current Population—USVI: 101,900 as of July 1). Strong job growth in the United States attracted residents from the
territory, and average net out-migration of 1,030 people a year exceeded net
Hurricanes Irma and Maria exacerbated a long-term trend of out- natural change (resident births minus resident deaths) of 870 people a year during
migration, although many displaced residents have since returned the period. Population decline accelerated to an average of 300 a year, or 0.3
to the territory. percent, from 2005 to 2014 when the combined effects of the Great Recession in
the late 2000s and the closure of the Hovensa refinery contributed to an average
Population Trends annual net out-migration of 1,100 (UN population estimates and 2010 Census
The territory encompasses more than 50 islands, although the islands of St. Croix, data). Modestly improving economic conditions slowed out-migration from 2014 to
St. John, and St. Thomas account for almost all of the population. The population 2017 to 580 a year, although the population of the territory continued to decline at
of the USVI has declined for much of the past two decades because of significant an average annual rate of 0.1 percent, or 70 people, during the period.
out-migration stemming from weak economic conditions (Figure 6). From 2000 to In the immediate aftermath of Hurricanes Irma and Maria, thousands of residents
left the USVI, particularly those with homes located in the hardest hit parts of St.
Figure 6. Components of Population Change in the United States Croix and St. Thomas (Map 2). Outbound passengers from the two major airports
Virgin Islands HMA, 2000 Through the Forecast in the territory exceeded the number of inbound passengers by more than 26,150
Net Natural Change Net Migration
during 2017 (Figure 7). A significant number of residents returned the following
Population Growth
year, however, when inbound passengers exceeded outbound passengers
1,000 by 8,700 during 2018. That trend is estimated to have continued during 2019,
500 although the population of the territory is currently estimated at only 101,900, an
average annual decline of 1,450, or 1.4 percent, since July 2017 (Table 3).
0
-500 Age Trends
-1,000 Due in part to a general scarcity of high-paying jobs in the USVI, out-migration
from the territory has been heavily concentrated among the working-age
-1,500
population. As a result, the median age has risen sharply relative to the United
-2,000 States. From 2000 to 2010, the median age in the USVI rose from 33.4 to 39.2,
an increase of 5.8 years, while the median age for the United States rose from
st
06 06
09 09
05 05
03 03
04 04
07 07
08 08
01 01
10 10
02 02
re t
2 16 16
15 15
13 13
14 14
rre -Cu 17
11 11
12 12
-Fo n
ca
nt rre
20 -20
20 -20
20 -20
Cu 017 -20
20 -20
20 -20
20 -20
20 -20
20 -20
20 -20
20 -20
20 -20
20 -20
20 -20
20 -20
20 -20
20 -20
35.3 to 37.2, an increase of only 1.9 years (Table 4). That trend continued into the
00
20
early 2010s, with significant job losses further limiting opportunities for skilled
Notes: Net natural change and net migration totals are average totals over the time period.
workers. As of 2014, the median age in the territory was 43.5 years, nearly 6 years
Sources: U.S. Census Bureau; current to forecast—estimates by the analyst older than the median age of 37.7 years in the United States (2014 Virgin Islands
Comprehensive Housing Market Analysis United States Virgin Islands
U.S. Department of Housing and Urban Development, Office of Policy Development and ResearchUnited States Virgin Islands Comprehensive Housing Market Analysis as of August 1, 2019 Population and Households 10
Map 2: Households Reporting Major or Severe Hurricane Damage in the Community Survey [VICS] and 2014 American Community Survey [ACS] 1-year data).
United States Virgin Islands HMA, 2012–2017
Out-migration associated with the hurricanes is likely to have further exacerbated
that trend because younger residents were more likely to have relocated to areas
outside the territory.
Figure 7. Net Inbound Air Passengers to the United States Virgin Islands HMA
10,000
St. Thomas St. John
5,000
0
!
! -5,000
Cruz Bay
-10,000
Charlotte Amalie
-15,000
-20,000
-25,000
-30,000
2010 2011 2012 2013 2014 2015 2016 2017 2018
Source: Virgin Islands Port Authority
St. Croix Christiansted Table 3. United States Virgin Islands HMA
Population and Household Quick Facts
!
2010 Current Forecast
Population Population 106,405 101,900 104,400
Quick Facts Average Annual Change -220 -480 830
Percentage Change -0.2 -0.5 0.8
2010 Current Forecast
Households with Major or Severe Damage Household Households 43,214 42,150 43,500
by Census Tract Quick Facts Average Annual Change 260 -110 450
Less than 250 Percentage Change 0.6 -0.3 1.0
250 - 649 Note: Average annual changes and percentage changes are based on averages from 2000–2010, 2010 to
650 - 1,075 current, and current to forecast.
Sources: 2000 and 2010—2000 Census and 2010 Census; current and forecast—estimates by the analyst
Source: FEMA, 2012-2017
Comprehensive Housing Market Analysis United States Virgin Islands
U.S. Department of Housing and Urban Development, Office of Policy Development and ResearchUnited States Virgin Islands Comprehensive Housing Market Analysis as of August 1, 2019 Population and Households 11
Table 4. Selected Population and Household Demographics in the in 2000 to $37,254 in 2010, compared with an average annual increase of 2
United States Virgin Islands HMA percent from $41,851 in 2000 to $50,046 in 2010 for the nation (2000 and 2010
United States Census data). The income gap widened significantly from 2010 to 2014 when
Nation
Virgin Islands HMA economic conditions weakened in the territory where the median household income
2000 2010 2000 2010
declined an average annual 3 percent to $33,057. The median household income
for the nation increased an average of 2 percent annually to $53,657 (VICS, ACS
Median Age 33.4 39.2 35.3 37.2
1-year data). Median household income in the USVI was estimated at only $31,000
Households with 5+ persons 13.0% 8.0% 11.0% 11.0%
Average Household Size 2.64 2.41 2.59 2.58
before the hurricanes in 2017, while the median household income in the nation
Median Household Income $24,704 $37,254 $41,851 $50,046 was $60,336 (Federal Reserve Bank of New York, ACS 1-year data).
Source: U.S. Census Bureau Low incomes, combined with relatively high home prices stemming from strong
demand by nonresidents, have contributed to notably low homeownership rates
Household Trends in the territory. The homeownership rate in the USVI increased from 46.0 percent
Despite the population decline, the territory had modest household growth from in 2000 to 47.9 percent in 2010 partly because weak economic conditions in the
2000 to 2010, due in large part to a long-term trend of decoupling by larger nation limited demand for seasonal and second homes during the late 2000s,
households. Household growth in the territory averaged 0.6 percent a year which allowed some residents to purchase homes. Homeownership began to
from April 2000 to April 2010. As the population decreased during the period, decline in the early 2010s, however, a trend that is estimated to have accelerated
the formation of smaller sized households accounted for the positive household in the aftermath of the hurricanes. As of August 1, 2019, the homeownership
growth with the average household size declining from 2.64 in April 2000 to rate in the territory is estimated at 42.8 percent (Figure 8). By comparison, the
2.41 in April 2010. The percentage of households in the USVI that had five or Figure 8. Households by Tenure and Homeownership Rate in the
more people declined from 13 percent in April 2000 to 8 percent in April 2010, United States Virgin Islands HMA
while the figure for the United States remained largely unchanged at 11 percent
Owner Renter Homeownership Rate
(2000 and 2010 Census data). The average household size in the territory
has continued to decline since the early 2010s, and although the number of 45,000 49.0
households has decreased since 2010, the rate of decline has been less than that 40,000 48.0
Homeownership Rate
of the population. As of August 1, 2019, the number of households in the USVI was 35,000 47.9 47.0
estimated at 42,150, an average annual decline of 0.3 percent since April 2010, Households 30,000 46.0
25,000 46.0 45.0
(%)
compared with an average annual decline of 0.5 percent for the population.
20,000 44.0
Income & Tenure 15,000
42.8
43.0
42.0
10,000
Incomes in the USVI have historically been lower than the nation as a whole.
5,000 41.0
The income gap narrowed during the 2000s but has become significantly more 40.0
0
pronounced during the past decade. From 2000 to 2010, the median household 2000 2010 Current
income in the territory increased an average of 4 percent annually from $24,704 Sources: 2000 and 2010—2000 Census and 2010 Census; current—estimates by the analyst
Comprehensive Housing Market Analysis United States Virgin Islands
U.S. Department of Housing and Urban Development, Office of Policy Development and ResearchUnited States Virgin Islands Comprehensive Housing Market Analysis as of August 1, 2019 Population and Households 12
homeownership rate for the nation declined from 67.2 percent during the second to net in-migration, including the continued return of displaced residents. The
quarter of 2000 to 66.9 percent during the second quarter of 2010 and was number of households is expected to increase at a faster average annual rate
64.1 percent during the second quarter of 2019 (Current Population Survey). of 1.1 percent, to 43,500, during the forecast period with the average household
size expected to continue to decline.
Forecast
During the next 3 years, population growth is expected to average 830, or 0.8
percent, annually, in the USVI, with improving economic conditions contributing
Comprehensive Housing Market Analysis United States Virgin Islands
U.S. Department of Housing and Urban Development, Office of Policy Development and ResearchUnited States Virgin Islands Comprehensive Housing Market Analysis as of August 1, 2019 Home Sales Market Conditions 13
Home Sales Market Conditions half of all home sales in the territory, contributed to relatively strong demand
for sales housing in the early and mid-2010s. The number of home sales on
Market Conditions: Balanced the islands of St. Thomas and St. Croix, which compose more than 95 percent
of the USVI’s population and housing stock, increased by an average of 34
The average price of homes on St. Croix and St. Thomas rose to percent annually, from 260 in 2012 to 470 in 2014 (Virgin Islands Territorial
$368,000 during the first seven months of 2019, a 10-percent Association of Realtors Multiple Listing Service [MLS]). Home sales increased
increase from the same period in 2018. despite the significant job losses associated with the closure of the Hovensa
refinery because many former workers, particularly on the island of St. Croix,
Current Conditions were forced to leave the territory and sell their homes, often to nonresidents.
The sales housing market in the USVI is currently balanced. Demand for sales The average home price fell from $359,000 in 2012 to $318,600 in 2013, but
housing, particularly by nonresidents, declined dramatically following the subsequently rose to $374,800 in 2014 (Figure 9). The combined number of
hurricanes but has since resumed. Supply remains limited, however, with some home sales on the two islands declined 4 percent in 2015 but subsequently
severely damaged for-sale units yet to return to the market and many other units increased 16 percent to 520 in 2016. The average sales price declined 11 percent
being converted to rental units in response to tight rental market conditions. to $326,700 in 2016 mostly because of a 21-percent increase in the number
As a result, the inventory of for-sale homes declined in the territory, and home of condominium sales, which are generally smaller and less expensive than
prices have increased during the past year. As of August 1, 2019, the overall single-family homes.
sales vacancy rate was estimated at 3.4 percent, down from 3.7 percent in April
2010, and well below the 12.8-percent rate in April 2000 (Table 5). Figure 9. Annual Sales Totals and Average Sales Prices
in the United States Virgin Islands HMA
Table 5. Home Sales Quick Facts in the United States Virgin Islands HMA
Total Sales Average Sales Price
2018 2019 600 380,000
Vacancy Rate NA 3.4% 500 365,000
Home Sales
Total Home Sales 290 380
Quick Facts
Average Sales Price
1-Year Change -15% 31% 400 350,000
Average Home Sales Price $335,800 $368,000 Sales 300 335,000
($)
1-Year Change 3% 10%
NA = data not available. 200 320,000
Notes: The vacancy rate is as of the current date. Home sales and prices are for January through July and
exclude the island of St. John. 100 305,000
Sources: Sales—Virgin Islands Territorial Association of Realtors; vacancy rate—estimates by the analyst
0 290,000
Early and Mid-2010s 2012 2013 2014 2015 2016
Despite weak economic conditions and declining homeownership, a significant Note: Data exclude the island of St. John.
amount of demand by nonresidents, which typically account for approximately Source: Virgin Islands Territorial Association of Realtors
Comprehensive Housing Market Analysis United States Virgin Islands
U.S. Department of Housing and Urban Development, Office of Policy Development and ResearchUnited States Virgin Islands Comprehensive Housing Market Analysis as of August 1, 2019 Home Sales Market Conditions 14
2017 to Current first 7 months of 2017. The average home sales price also increased 10 percent
to $368,000. The increase in demand during the past year also contributed to
Sales market conditions were relatively stable in early and mid-2017, although
significant absorption of available inventory, with the number of active listings
sales activity declined dramatically after the hurricanes as damage was
declining from 220 in July 2018 to only 160 in July 2019.
assessed and recovery efforts began. From January through July 2017, the
number of homes sold on St. Croix and St. Thomas totaled 340, up 6 percent Seasonal Homes, Second Homes
from the same period in 2016, while the average sales price was largely
unchanged at $327,000 (Figure 10). Very little sales activity occurred in late 2017, & Condominiums
and home sales, particularly to nonresidents, remained limited through much Seasonal and second homes constitute a significant part of the sales market
of 2018. From January through July 2018, only 290 homes were sold on St. in the USVI, with demand by nonresidents putting upward pressure on home
Croix and St. Thomas, a 15-percent decline from the same period in 2017. The prices. Prior to the hurricanes, from January through July 2017, sales for a
average sales price increased 3 percent to $335,800 as the decline in home purpose other than primary residence (which include seasonal and second
sales was heavily concentrated in condominium unit sales, which fell 27 percent. homes) accounted for 49 percent of all home sales in the territory, which
Home sales activity increased sharply during the past year, with home prices was generally consistent with historical levels. That figure declined to only
continuing to rise in response to renewed demand for second homes. From 39 percent during the same period in 2018, due in large part to uncertainty
January through July 2019, 380 homes were sold on St. Croix and St. Thomas, regarding hurricane damage, but rose to 45 percent during the first 7 months
up 31 percent from the same period a year ago and 19 percent higher than the of 2019, due in part to increased buyer confidence associated with recovery
efforts. Seasonal and second homes have historically been more expensive
Figure 10. Sales by Type and Average Sale Price in the than primary residences in the territory. The average sales price for seasonal
United States Virgin Islands HMA and second homes on St. Croix and St. Thomas was $352,300 during January
through July 2017, 16 percent higher than the average price for primary
Primary Residence Other Sales Average Sales Price residences—$303,000. Prices for seasonal and second homes fell much faster
250 377,500 than prices for primary residences following the hurricanes but have since
increased at a relatively rapid rate as recovery efforts have helped assuage
200 360,000 concerns about the future of the market among prospective investors. Primary
Average Sales Price
residences sold for an average of $358,300, or 16 percent more than $300,600,
150 342,500 the average price for seasonal and second homes, during January through July
Sales
($)
2018. Conversely, during the first 7 months of 2019, the average sales price for
100 325,000
seasonal and second homes, $395,400, was 14 percent higher than the average
sales price of a primary residence, which declined to $345,800 due in large part
50 307,500
to an increased number of condominium sales.
0 290,000 Condominiums, which are particularly popular with nonresidents due to
2016 2017 2018 2019
the relatively minimal amount of maintenance required, have a substantial
Note: Data are for January through July and exclude the island of St. John.
impact on the housing market in the territory. Approximately 18 percent of
Source: Virgin Islands Territorial Association of Realtors all owner-occupied housing units in the USVI are currently estimated to be
Comprehensive Housing Market Analysis United States Virgin Islands
U.S. Department of Housing and Urban Development, Office of Policy Development and ResearchUnited States Virgin Islands Comprehensive Housing Market Analysis as of August 1, 2019 Home Sales Market Conditions 15
condominium units (in multi-unit structures), more than triple the 5-percent insurance, home sales in the USVI are often cash transactions among family and
figure for the United States in 2017 (ACS 1-year data). During January through friends. More than two-thirds of all owner-occupied homes in the USVI do not
July of 2017, approximately 170 condominiums sales occurred on St. Croix and have a mortgage. By comparison, only 37 percent of owner-occupied homes
St. Thomas. That figure declined to only 120 units during same period in 2018, in the United States did not have a mortgage in 2017 (ACS 1-year data).
but subsequently increased to 180 units during the first seven months of 2019.
The average sales price for condominium units was $228,500 during January Sales Construction Activity
through July 2019, up 1 percent from a year ago. Significant recovery efforts have resulted in increased permitting of sales units
in the USVI during the past 2 years, although large-scale development remains
St. John difficult due in part to high material costs and geographic limitations. An estimated
The sales market on the island of St. John typically accounts for less than 190 for-sale units were permitted during the 12 months ending July 2019, up
10 percent of all home sales in the territory. The Virgin Islands National Park 6 percent from the previous 12 months. Annual totals of 150 and 200 units were
covers approximately 60 percent of the island, making developable land scarce permitted in 2017 and 2018, respectively (Figure 11). By comparison, an average
but very desirable. As a result, home prices are generally much higher than of 400 for-sale units were permitted each year from 2010 through 2016, a period
elsewhere in the territory but fluctuate significantly from year to year given when condominiums, timeshares, and duplexes accounted for a relatively high
the low number of sales. From 2013 through 2016, home sales on the island share of the for-sale development activity. Such units accounted for an estimated
averaged 50 homes a year, with median home sales prices ranging from a low 44 percent of all for-sale units permitted in the USVI during 2010 through 2016,
of $643,600 in 2015 to a high of $765,000 in 2014. During the first seven up from 31 percent from 2000 through 2009. Seasonal homes and second homes,
months of 2017, 30 homes were sold, with a median sales price of $658,800,
although home sales activity has been extremely limited since the hurricanes. Figure 11. Sales Permitting Activity in the United States Virgin Islands HMA
Affordability 600
Single-Family Homes/Townhomes Condominiums
Relatively low incomes, high construction costs, limited developable land, and
strong demand by nonresidents have contributed to an ongoing affordability 500
problem for residents of the territory seeking to purchase a home. During 2017,
the median home price was approximately 7 times higher than the median 400
household income in the USVI, compared with 5 times higher for the nation. 300
The ratio is likely to have increased significantly in the territory during the past
2 years because home prices have risen since the hurricanes despite severely 200
weakened economic conditions.
100
Homeownership in the territory is also limited by significant barriers associated
with financing. The largest of these barriers is the high cost of homeowner’s 0
insurance, which was approximately four times more expensive than for the nation
10
15
16
18
19
12
13
14
17
11
20
20
20
20
20
20
20
20
20
20
as a whole before the hurricanes and is estimated to have increased as much Notes: Includes single-family homes, townhomes, and condominiums. Data for 2019 are through July 2019.
as 20 percent since 2017. To avoid the lender requirement to purchase home Sources: Virgin Islands Department of Planning and Natural Resources; estimates by the analyst
Comprehensive Housing Market Analysis United States Virgin Islands
U.S. Department of Housing and Urban Development, Office of Policy Development and ResearchUnited States Virgin Islands Comprehensive Housing Market Analysis as of August 1, 2019 Home Sales Market Conditions 16
including resort condominiums and timeshares, contributed significantly to the Forecast
increase, which coincided with the economic recovery of the United States.
Demand for primary residences is expected at an estimated 800 new sales
Construction is extremely expensive in the territory because materials such as units in the HMA during the 3-year forecast period (Table 6). Population growth
concrete are routinely more than three times as expensive as in the continental associated with improving economic conditions will contribute to sales demand.
United States and much of the undeveloped land is mountainous. As a result, The 240 units currently under construction will satisfy some of the estimated demand.
building large-scale developments is extremely difficult, although efforts are
being made to promote homeownership by permanent residents. Several Table 6. Demand for New Sales Units in the United States
moderately-sized new home developments are in planning, with the largest, Virgin Islands HMA During the Forecast Period
a currently unnamed 57-home development, targeted for the western part of Sales Units
St. Croix. Prices have yet to be released, but completion is currently targeted Demand 800 Units
for the first quarter of 2021, with the initial occupants to be selected by VIHFA Under Construction 240 Units
from a waiting list of more than 200 qualified first-time homebuyers. Source: Estimates by the analyst
Comprehensive Housing Market Analysis United States Virgin Islands
U.S. Department of Housing and Urban Development, Office of Policy Development and ResearchUnited States Virgin Islands Comprehensive Housing Market Analysis as of August 1, 2019 Rental Market Conditions 17
Rental Market Conditions Apartment Market Conditions
Apartment market conditions in the territory are also tight, although apartments
Market Conditions: Tight compose a relatively small share of the overall rental market. Prior to the
The overall rental vacancy rate in the USVI is estimated to have fallen hurricanes, approximately 69 percent of renter households, including those in
by more than one-half since the hurricanes, with rents estimated to market-rate and affordable units, resided in structures with four or fewer units.
have more than doubled for some unit types. That figure has likely increased during the past 2 years because the recent
spike in rental demand has resulted in many small multifamily buildings and
Overall Rental Market Conditions single-family homes being converted to long-term rental units. By comparison,
The overall rental market in the USVI is currently tight. An influx of workers, only 52 percent of renter households resided in such structures in the United
particularly those associated with recovery efforts and the reopening of the States in 2017 (ACS 1-year data).
Limetree Bay facility, has contributed to a significant increase in demand since The few large apartment communities in the territory are almost all income-
the hurricanes. Supply is limited, however, due in part to severely damaged units restricted or subsidized. Those properties generally have much lower vacancy
that remain off the market. As a result, the current overall rental vacancy rate is rates than the overall rental market, a trend that has become more pronounced
historically low. As of August 1, 2019, the overall rental vacancy rate is estimated since the hurricanes. Of the 26 apartment communities managed by the Virgin
at 6.5 percent, well below the 10.1-percent rate in 2000 and less than one-half Islands Housing Authority (VIHA), 24 sustained damage. Notably, on St. Thomas,
the 13.8-percent rate in April 2010 (Table 7). the 304-unit Estate Tutu community and the 85-unit Lucinda Williams Home were
evacuated due to severe damage and are currently scheduled for demolition.
Table 7. Rental and Apartment Market Quick Facts in the
United States Virgin Islands HMA Rents
Percent Data regarding market-rate rental units in the USVI are severely limited because
Overall Rental Vacancy Rate of the general absence of large apartment complexes and subsequently private
2000 10.1 apartment surveys, although rents are estimated to have more than doubled
2010 13.8
for some unit types since the hurricanes. Studio units, which rented for $600 a
Rental Market Current 6.5
Quick Facts month prior to the hurricanes, are currently estimated to rent for up to $1,000 a
Rental Units by Units Structure
Single-Family 40 month, while rents for one-bedroom units, which previously rented for $1,100 a
2 Units 11 month, are currently as high as $2,500 a month. Two- and three-bedroom units,
3 or 4 Units 18 which rented for approximately $1,800 and $2,500, currently rent for as much
5 or More Units 29 as $3,000 and $6,000 a month, respectively.
Apartment
Unit Type
Studio
Estimated Rents
$800–$1,000
Affordability
Market One-Bedroom $1,200–$2,500
Renter households in the USVI have historically spent a notably larger share of
Quick Facts Two-Bedroom $2,500–$3,000 their income on rent than those in the rest of the nation, an issue that has been
Three-Bedroom $4,000–$6,000 compounded by rapidly rising rents since the hurricanes. Based on the most recent
Sources: U.S. Census Bureau; Virgin Islands Community Survey; field work by the analyst data available, the median gross monthly rent in the territory was $848, which
Comprehensive Housing Market Analysis United States Virgin Islands
U.S. Department of Housing and Urban Development, Office of Policy Development and ResearchUnited States Virgin Islands Comprehensive Housing Market Analysis as of August 1, 2019 Rental Market Conditions 18
represented 39 percent of the median monthly income for renter households, Rental Construction Activity
$2,175, during 2014 (2014 VICS). By comparison, the median gross monthly rent
Construction of affordable units has contributed to much of the recent rental
was $934 in 2014 in the United States, or about 33 percent of the median monthly
development in the territory, particularly since the hurricanes. From 2010 through
income of $2,850 for renter households (ACS 1-year data).
2017, an estimated average of 160 new rental units were permitted each year,
Given the high cost of living and relatively low wages in the territory, subsidized including several affordable apartment properties (Figure 12). Phase 1 and Phase
and other low-income rental housing is particularly important. In total, income- 2 of Louis E. Brown Apartments, which consist of a combined 141 subsidized units
restricted or subsidized housing accounts for approximately 25 percent of the total on St. Croix, opened in 2011 and 2013, respectively. On St. Thomas, the 48-unit first
rental inventory in the USVI compared with approximately 14 percent in the United phase of Magen’s Junction, an LIHTC property that is restricted to households at
States (VIHFA, Harvard Joint Center for Housing Studies, Center on Budget and or below 60 percent of Area Median Income, was permitted prior to the hurricanes
Policy Priorities, Urban Institute). The primary provider of subsidized housing is in 2017 and was completed in 2018. The 90-unit third phase of Louis E. Brown
VIHA, which manages 26 public housing communities with a combined 3,014 units Apartments was also permitted in 2017, although construction was not completed
(Table 8). A 2015 study by the VIHFA estimated a vacancy rate of 8 percent at VIHA until mid-2019 due in part to the hurricanes.
properties, although that figure has declined significantly since the hurricanes, with
During the 12 months ending July 2019, 90 new rental units were permitted in the
nearly all available units currently occupied. Other major sources of subsidized
territory, up from 80 units during the previous 12 months (estimates by the analyst).
rental housing are the Section 8 Project-Based Rental Assistance program, which
Currently, 90 new rental units are under construction. The 68-unit second phase of
provides approximately a combined 1,275 units at 8 complexes, and the U.S.
Magen’s Junction, which was permitted in 2018, accounts for more than three-
Department of Agriculture Rural Development Administration (RDA), which includes
fourths of the units currently being built.
430 units at 11 properties. The vacancy rate at RDA properties has been under 5
percent since 2010. Demand for subsidized rental housing is substantial, with the Figure 12. Rental Permitting Activity in the United States Virgin Islands HMA
waiting list of more than 1,000 households for Section 8 Housing Choice Vouchers,
up from 590 prior to the hurricanes. In addition to subsidized housing, the Low- 250
Income Housing Tax Credit (LIHTC) program funds approximately 1,500 below
market-rate apartment units combined at 31 communities. 200
Table 8. Picture of Affordable Rental Housing Units in the 150
United States Virgin Islands HMA
United States 100
Virgin Islands
HMA 50
Public Housing (VIHA) 3,014
Low-Income Housing Tax Credit (LIHTC) 1,500 0
10
15
12
16
18
19
13
14
17
11
Project-Based Rental Assistance 1,275
20
20
20
20
20
20
20
20
20
20
Rural Development Administration (RDA) 430
Notes: Includes apartments and units intended for rental occupancy. Data for 2019 are through July 2019.
Sources: Virgin Islands Housing Authority (VIHA); Virgin Islands Housing Finance Authority Sources: Virgin Islands Department of Planning and Natural Resources; estimates by the analyst
Comprehensive Housing Market Analysis United States Virgin Islands
U.S. Department of Housing and Urban Development, Office of Policy Development and ResearchUnited States Virgin Islands Comprehensive Housing Market Analysis as of August 1, 2019 Rental Market Conditions 19
Forecast Table 9. Demand for New Rental Units in the United States Virgin Islands
During the Forecast Period
During the 3-year forecast period, demand is estimated for 940 rental units in
Rental Units
the territory (Table 9). A portion of that demand will be met by the 90 apartment
Demand 940 Units
units currently estimated to be under construction. It is also important to note that Under Construction 90 Units
a significant portion of demand will be replacement demand resulting from the
Note: The forecast period is August 1, 2019, to August 1, 2022.
planned demolition of severely damaged affordable apartment units. Source: Estimates by the analyst
Comprehensive Housing Market Analysis United States Virgin Islands
U.S. Department of Housing and Urban Development, Office of Policy Development and ResearchUnited States Virgin Islands Comprehensive Housing Market Analysis as of August 1, 2019 Terminology Definitions and Notes 20
Terminology Definitions and Notes
A. Definitions
Building permits do not necessarily reflect all residential building activity that occurs in an HMA. Some units are constructed or created without a building
permit or are issued a different type of building permit. For example, some units classified as commercial structures are not reflected in the residential building
Building Permits
permits. As a result, the analyst, through diligent fieldwork, makes an estimate of this additional construction activity. Some of these estimates are included in
the discussions of single-family and multifamily building permits.
Cost Burdened Spending more than 30 percent of household income on housing costs.
The demand estimates in the analysis are not a forecast of building activity. They are the estimates of the total housing production needed to achieve a
Demand balanced market at the end of the 3-year forecast period given conditions on the as-of date of the analysis, growth, losses, and excess vacancies. The
estimates do not account for units currently under construction or units in the development pipeline.
Distressed Sales Short sales and real estate owned (REO) sales.
Forecast Period 8/1/2019–8/1/2022—Estimates by the analyst
Home Sales/
Home Sales Includes single-family home, townhome, and condominium sales.
Prices
Comprehensive Housing Market Analysis United States Virgin Islands
U.S. Department of Housing and Urban Development, Office of Policy Development and ResearchUnited States Virgin Islands Comprehensive Housing Market Analysis as of August 1, 2019 Terminology Definitions and Notes 21
In this analysis conducted by the U.S. Department of Housing and Urban Development (HUD), other vacant units include all vacant units that are not available
Other Vacant
for sale or for rent. The term therefore includes units rented or sold but not occupied; held for seasonal, recreational, or occasional use; used by migrant
Units
workers; and the category specified as “other” vacant by the Census Bureau.
Rental Market/
Rental Vacancy Includes apartments and other rental units, such as single-family homes, multifamily homes, and mobile homes.
Rate
Seriously
Delinquent Mortgages 90+ days delinquent or in foreclosure.
Mortgages
B. Notes on Geography
The (metropolitan statistical area) definition noted in this report is based on the delineations established by the Office of Management and Budget (OMB) in
1.
the OMB Bulletin dated February 28, 2013.
2. Urbanized areas are defined using the U.S. Census Bureau’s 2010 Census Urban and Rural Classification and the Urban Area Criteria.
3. The census tracts referenced in this report are from the 2010 Census.
C. Additional Notes
The NAHB Housing Opportunity Index represents the share of homes sold in the HMA that would have been affordable to a family earning the local median
1.
income, based on standard mortgage underwriting criteria.
Comprehensive Housing Market Analysis United States Virgin Islands
U.S. Department of Housing and Urban Development, Office of Policy Development and ResearchYou can also read