Urban Water Management Plan - November 2016 - City of Vallejo
←
→
Page content transcription
If your browser does not render page correctly, please read the page content below
2015
Urban Water Management Plan

Prepared by:
                      November 2016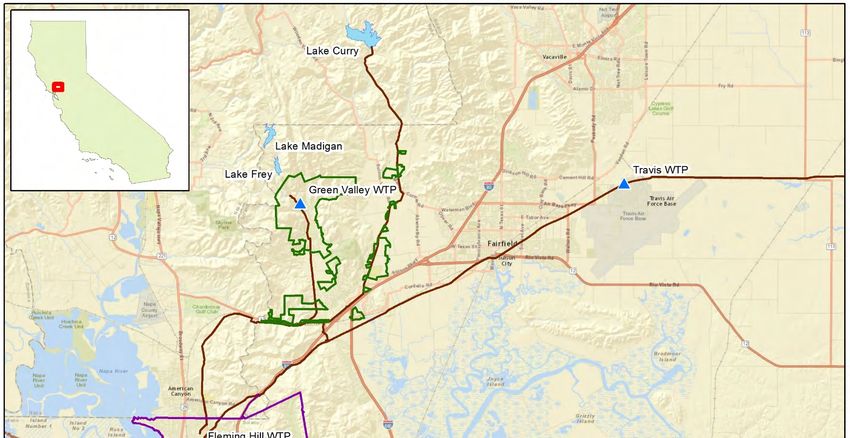
City of Vallejo
2015 Urban Water Management Plan

             Prepared by:

            November 2016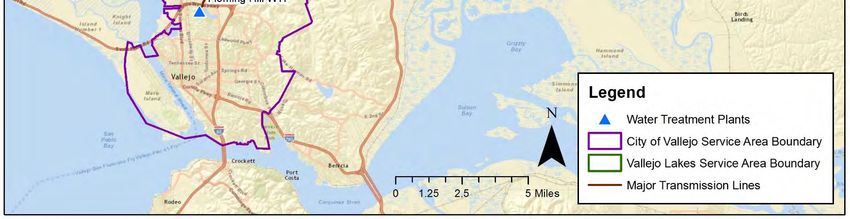
City of Vallejo
2015 Urban Water Management Plan

                              This page intentionally left blank.

                                                                    November 2016
City of Vallejo
2015 Urban Water Management Plan

Table of Contents
Section 1 Introduction and Overview ....................................................................................................... 1‐1
1.1. Urban Water Management Planning and the California Water Code ................................................. 1‐1
1.2. UWMP Organization ............................................................................................................................................... 1‐2
1.3. UWMP Summary ...................................................................................................................................................... 1‐2

Section 2 Plan Preparation ........................................................................................................................... 2‐1
2.1. Basis for Preparing a Plan .................................................................................................................................... 2‐1
2.2. Planning and Compliance Reporting................................................................................................................ 2‐1
2.3. Coordination and Outreach.................................................................................................................................. 2‐2

Section 3 System Description ...................................................................................................................... 3‐1
3.1. Service Area Physical Description..................................................................................................................... 3‐1
3.2. Climate .......................................................................................................................................................................... 3‐3
3.3. Service Area Population ........................................................................................................................................ 3‐5

Section 4 System Water Use ......................................................................................................................... 4‐1
4.1. Water Uses by Sector .............................................................................................................................................. 4‐1
4.2. Distribution System Water Losses .................................................................................................................... 4‐3
4.3. Estimating Future Water Savings ...................................................................................................................... 4‐3
4.4. Water Use for Lower Income Households ..................................................................................................... 4‐5
4.5. Climate Change.......................................................................................................................................................... 4‐6

Section 5 SB X7‐7 Baselines and Targets ................................................................................................. 5‐1
5.1. Updating Calculations from 2010 UWMP ...................................................................................................... 5‐1
5.2. Baseline Periods ....................................................................................................................................................... 5‐1
5.3. Service Area Population ........................................................................................................................................ 5‐2
5.4. Gross Water Use ....................................................................................................................................................... 5‐2
5.5. Baseline and Target Daily Per Capita Water Use ........................................................................................ 5‐5
5.6. 2015 Compliance Daily Per Capita Water Use (GPCD) ............................................................................. 5‐6

Section 6 System Supplies............................................................................................................................. 6‐1
6.1. Purchased or Imported Water ............................................................................................................................ 6‐1
6.2. Groundwater .............................................................................................................................................................. 6‐3
6.3. Surface Water ............................................................................................................................................................ 6‐3
6.4. Stormwater ................................................................................................................................................................. 6‐3
6.5. Wastewater and Recycled Water ...................................................................................................................... 6‐3
6.6. Desalinated Water Opportunities ..................................................................................................................... 6‐9
6.7. Exchanges or Transfers .......................................................................................................................................6‐10
6.8. Future Water Projects ..........................................................................................................................................6‐12
6.9. Summary of Existing and Planned Sources of Water ..............................................................................6‐12
6.10. Climate Change Impacts to Supply ...............................................................................................................6‐14

                                                                                                                                                            November 2016
  Page i
City of Vallejo
2015 Urban Water Management Plan

Section 7 Water Supply Reliability Assessment ................................................................................... 7‐1
7.1. Constraints on Water Sources ............................................................................................................................ 7‐1
7.2. Reliability by Water Year Type .......................................................................................................................... 7‐4
7.3. Supply and Demand Assessment ....................................................................................................................... 7‐6
7.4. Regional Supply Reliability .................................................................................................................................. 7‐8

Section 8 Water Shortage Contingency Plan .......................................................................................... 8‐1
8.1. Stages of Action ......................................................................................................................................................... 8‐1
8.2. Prohibitions on End Use ........................................................................................................................................ 8‐2
8.3. Penalties, Charges, Other Enforcement of Prohibitions ........................................................................... 8‐6
8.4. Consumption Reduction Methods ..................................................................................................................... 8‐6
8.5. Determining Water Shortage Reductions ...................................................................................................... 8‐7
8.6. Revenue and Expenditure Impacts ................................................................................................................... 8‐8
8.7. Resolution or Ordinance ....................................................................................................................................... 8‐9
8.8. Catastrophic Supply Interruption ..................................................................................................................... 8‐9
8.9. Minimum Supply Next Three Years ................................................................................................................8‐12

Section 9 Demand Management Measures ............................................................................................. 9‐1
9.1. Conservation Measure Organization ............................................................................................................... 9‐1
9.2. Demand Management Measures Not Implemented .................................................................................. 9‐2
9.3. Demand Management Measures ....................................................................................................................... 9‐3

Section 10 Plan Adoption, Submittal and Implementation ........................................................... 10‐1
10.1. Inclusion of All 2015 Data ................................................................................................................................10‐1
10.2. Notice of Public Hearing ...................................................................................................................................10‐1
10.3. Notice to the Public .............................................................................................................................................10‐2
10.4. Public Hearing and Adoption ..........................................................................................................................10‐2
10.5. Plan Submittal .......................................................................................................................................................10‐2
10.6. Public Availability ................................................................................................................................................10‐2
10.7. Amending an Adopted UWMP ........................................................................................................................10‐2

Section 11 References ................................................................................................................................. 11‐1

                                                                                                                                                     November 2016
  Page ii
City of Vallejo
2015 Urban Water Management Plan
List of Tables
Table 2‐1: Public Water System (DWR Table 2‐1) ................................................................................................ 2‐1
Table 2‐2: Plan Identification (DWR Table 2‐2) ..................................................................................................... 2‐1
Table 2‐3: Agency Identification (DWR Table 2‐3) ............................................................................................... 2‐2
Table 2‐4: Water Supplier Information Exchange (DWR Table 2‐4) ............................................................. 2‐2
Table 3‐1: Climate Characteristics for the City of Vallejo ................................................................................... 3‐3
Table 3‐2: Population – Current and Projected by Region ................................................................................. 3‐6
Table 3‐3: Population – Current and Projected (DWR Table 3‐1) .................................................................. 3‐6
Table 4‐1: 2015 Demands for Potable and Raw Water (DWR Table 4‐1) ................................................... 4‐1
Table 4‐2: Project Demands for Potable and Raw Water (DWR Table 4‐2) ............................................... 4‐2
Table 4‐3: Total Water Demands (DWR Table 4‐3) .............................................................................................. 4‐3
Table 4‐4: AWWA Water Loss Audit (DWR Table 4‐4)........................................................................................ 4‐3
Table 4‐5: Inclusion in Water Use Projections (DWR Table 4‐5) .................................................................... 4‐5
Table 5‐1: Baseline Period Ranges (SBX7‐7 Table 1) ........................................................................................... 5‐2
Table 5‐2: Gallons per Capita Per Day (GPCD) (SBX7‐7 Table 5) .................................................................... 5‐4
Table 5‐3: Baselines and Targets Summary (DWR Table 5‐1) ......................................................................... 5‐6
Table 5‐4: 2015 Compliance (DWR Table 5‐2) ....................................................................................................... 5‐6
Table 6‐1: 2015 Purchased/Imported Water Supplies ....................................................................................... 6‐1
Table 6‐2: Groundwater Volume Pumped (DWR Table 6‐1) ............................................................................ 6‐3
Table 6‐3: Wastewater Collected Within Service Area in 2015 (DWR Table 6‐2) ................................... 6‐4
Table 6‐4: Wastewater Treatment and Discharge Within Service Area in 2015 (DWR Table 6‐3) .. 6‐5
Table 6‐5: Current and Projected Recycled Water Direct Beneficial Uses Within Service Area (DWR
Table 6‐4)................................................................................................................................................................................ 6‐7
Table 6‐6: 2010 UWMP Recycled Water Use Projection Compared to 2015 Actual (DWR Table 6‐5)
..................................................................................................................................................................................................... 6‐8
Table 6‐7: Methods to Expand Future Recycled Water Use (DWR Table 6‐6)........................................... 6‐9
Table 6‐8: American Canyon Treated Water Purchase Blocks .......................................................................6‐10
Table 6‐9: Expected Future Water Supply Projects or Programs (DWR Table 6‐7)..............................6‐12
Table 6‐10: Water Supplies – 2015 Actual (DWR Table 6‐8) ..........................................................................6‐12
Table 6‐11: Water Supplies – Projected (DWR Table 6‐9) ...............................................................................6‐13
Table 7‐1: Factors Affecting Reliability of Supply .................................................................................................. 7‐2
Table 7‐2: Basis of Water Year Data – State Water Project (DWR Table 7‐1) ............................................ 7‐5
Table 7‐3: Basis of Water Year Data – Permit Water (DWR Table 7‐1) ........................................................ 7‐5
Table 7‐4: Basis of Water Year Data – Solano Project (Lake Berryessa) (DWR Table 7‐1) .................. 7‐6
Table 7‐5: Basis of Water Year Data – Lakes Frey & Madigan (DWR Table 7‐1) ...................................... 7‐6
Table 7‐6: Normal Year Supply and Demand Comparison (DWR Table 7‐2) ............................................. 7‐6
Table 7‐7: Single Dry Year Supply and Demand Comparison (DWR Table 7‐3) ....................................... 7‐7
Table 7‐8: Multiple Dry Years Supply and Demand Comparison (DWR Table 7‐4) ................................ 7‐7
Table 8‐1: Stages of Water Shortage Contingency Plan (DWR Table 8‐1) ................................................... 8‐1
Table 8‐2: Restrictions and Prohibitions on End Use (DWR Table 8‐2) ....................................................... 8‐5
Table 8‐3: Consumption Reduction Methods (DWR Table 8‐3) ...................................................................... 8‐7
Table 8‐4: Preparation Actions for Catastrophes.................................................................................................8‐10
Table 8‐5 – Minimum Supply Next Three Years (DWR Table 8‐4) ...............................................................8‐12
Table 9‐1: 14 DMMs vs. 2015 Guidebook DMMs .................................................................................................... 9‐2
Table 9‐2: Water Waste Prohibition Activity 2011‐2015 ................................................................................... 9‐4
November 2016
Page iiiCity of Vallejo
2015 Urban Water Management Plan
Table 9‐3: Residential Surveys Performed 2011‐2015 ....................................................................................... 9‐6
Table 9‐4: Plumbing Devices Distributed .................................................................................................................. 9‐6
Table 9‐5: Number of Large Landscape Surveys and Water Budgets Performed .................................... 9‐7
Table 9‐6: Rebates Paid .................................................................................................................................................... 9‐8
Table 9‐7: Public Information Activities .................................................................................................................... 9‐9
Table 9‐8: School Materials and Programs Provided .........................................................................................9‐10
Table 9‐9: CII Surveys Completed ..............................................................................................................................9‐12
Table 9‐10: Residential Toilet Program Summary 2011‐2015 ......................................................................9‐12
Table 9‐11: Turf Removal and Irrigation Controller Rebates Paid ...............................................................9‐14
Table 10‐1: Notification to Cities and Counties (DWR Table 10‐1) ..............................................................10‐1
List of Figures
Figure 3‐1: City of Vallejo Water Service Areas ...................................................................................................... 3‐2
Figure 4‐1: Current and Projected Water Use ......................................................................................................... 4‐4
Figure 4‐2: Monthly Water Demand for Vallejo (2011‐2015) .......................................................................... 4‐6
Appendices Click Here For Appendices
Appendix A. DWR UWMP Check List
Appendix B. Demand Forecast Memorandum
Appendix C. AWWA Water Loss Audit
Appendix D. City Ordinance No, 1708 and Chapter 11.54 of the Municipal Code
Appendix E. 2015 SWP Delivery Reliability Report
Appendix F. Draft Water Shortage Contingency Plan Resolution
Appendix G. Water Savings Incentive Program Terms and Conditions
Appendix H. Public and Agency Notices, Meeting Agenda and Comments
Appendix I. UWMP Adoption Resolution
November 2016
Page ivCity of Vallejo
2015 Urban Water Management Plan
List of Abbreviations
AB Assembly Bill
ABAG Association of Bay Area Governments
AF Acre‐foot or Acre‐Feet
AFY Acre‐foot per Year
AWWA American Water Works Association
BMP Best Management Practice
BO Biological Opinion
Caltrans California Department of Transportation
CCF 100 cubic feet of water
CDPH California Department of Public Health Services
CII Commercial, Industrial and Institutional
CIMIS California Irrigation Management Information System
CUWCC California Urban Water Conservation Council
CWC California Water Code
DMMs Demand Management Measures
DOF Department of Finance
DWR Department of Water Resources
ERP Emergency Response Plan
ETo Evapotranspiration
FY Fiscal Year
GPCD Gallons Per Capita Per Day
gpm Gallons Per Minute
HET High Efficiency Toilet
HEU High Efficiency Urinal
HOA Home Owners Association
IRWMP Integrated Regional Water Management Plan
MG million gallons
MGD million gallons per day
MOU Memorandum of Understanding
MPN Most Probably Number
NBA North Bay Aqueduct
NMFS National Marine Fisheries Service
NOD North of Delta
PDA Priority Development Area
PG&E Pacific Gas & Electric
SB Senate Bill
SBX7‐7 Water Conservation Bill of 2009
SCWA Solano County Water Agency
SID Solano Irrigation District
SWP State Water Project
SWRCB State Water Resources Control Board
November 2016
Page vCity of Vallejo
2015 Urban Water Management Plan
Abbreviations (cont’d)
TDS Total Dissolved Solids
TOC Total Organic Carbon
USBR U.S. Bureau of Reclamation
USFWS U.S. Fish and Wildlife Service
UWMP Urban Water Management Plan
VA Vulnerability Assessment
VSFCD Vallejo Sanitation and Flood Control District
WSCP Water Shortage Contingency Plan
WTP Water Treatment Plant
WWTP Wastewater Treatment Plant
November 2016
Page viCity of Vallejo
2015 Urban Water Management Plan
Section 1 Introduction and Overview
The City of Vallejo (City) has prepared this Urban Water Management Plan (UWMP) following
California state requirements, as defined in the California Water Code (CWC). This chapter discusses
the requirement for and purpose of an UWMP, and provides a summary of this plan.
1.1. Urban Water Management Planning and the California Water
Code
Urban Water Management Planning Act
The Urban Water Management Planning Act (Act) was created by Assembly Bill (AB) 797 which was
signed into law by Governor Deukmejian on September 21, 1983. The Act requires that urban water
suppliers (i.e., municipal water suppliers providing water for municipal purposes to more than 3,000
customers or supplying more than 3,000 acre‐feet (AF) annually) prepare and adopt Urban Water
Management Plans (UWMPs) containing certain specified elements.
The Act was subsequently amended by AB 2661, which was signed into law by Governor Deukmejian
on July 18, 1990. AB 2661 deleted the January 1, 1991 termination date specified in AB 797. AB 2661
also expanded the elements which are to be addressed in Urban Water Management Plans.
The Act was also amended by AB 1869, which was signed by Governor Wilson on October 13, 1991.
AB 1869 requires that urban water suppliers update (not just review) Urban Water Management
Plans every five years to include projections of both potable and recycled water use, identify current
reclamation practices, address additional alternative conservation measures, and describe findings,
actions, and planning related to a number of water conservation and reclamation measures.
The Act was further amended by AB 11X signed by Governor Wilson on October 13, 1991. AB 11X
requires that urban water suppliers prepare an Urban Water Shortage Contingency Plan as an
amendment to its Urban Water Management Plan. Water Shortage Contingency Plans (WSCPs) must
be updated every five years and specify proposed measures for response to short‐ and long‐term
water shortages.
Water Conservation Bill of 2009
On November 10, 2009, the state legislature passed the Water Conservation Bill of 2009 (also
referred to as Senate Bill (SB) X7‐7) as a water conservation component to the Sacramento‐San
Joaquin River Delta (Delta) legislative package. The bill seeks a 20 percent statewide reduction in
urban per capita water use in California by December 31, 2020. SB X7‐7 requires that each retail
agency preparing a 2010 UWMP to calculate baseline water use as well as an interim (for 2015) and
final (for 2020) water use reduction target. The methodologies used to calculate both the baseline
per capita water use and targets were outlined in the Draft and Final UWMP guidelines published by
the California Department of Water Resource (DWR) in December 2010 and March 2011,
respectively. Updates to those methodologies were released with the guidelines for the 2015
UWMPs.
November 2016
Page 1-1City of Vallejo
2015 Urban Water Management Plan
1.2. UWMP Organization
This UWMP was prepared based upon the recommended organization presented in DWR’s 2015
UWMP Guidebook for Urban Water Suppliers (UWMP Guidebook). Chapter titles are included below
and a DWR checklist, including the location of all required components of the UWMP, is included in
Appendix A.
Section 1 Introduction and Overview
Section 2 Plan Preparation
Section 3 System Description
Section 4 System Water Use
Section 5 SB X7‐7 Baselines and Targets
Section 6 System Supplies
Section 7 Water Supply Reliability Assessment
Section 8 Water Shortage Contingency Plan
Section 9 Demand Management Measures
Section 10 Plan Adoption, Submittal and Implementation
Section 11 References
1.3. UWMP Summary
The City provides water delivery to over 3,000 services, therefore requiring the preparation and
adoption of an UWMP in compliance with the Act, as amended by ABs 2661, 1869 and 11X, and SB
X7‐7 of 2009.
Vallejo, located at the southern end of Solano County, uses surface water as its sole supply source to
provide service to the City of Vallejo and surrounding unincorporated areas. The City consistently
meets all drinking water standards, despite some water quality concerns during storm events. As
such, constraints due to water source quality is considered to be unlikely. Due to a conservative total
water supply volume, the City expects to have sufficient water supplies to meet projected future
demands through 2040, during normal, single‐dry and multiple‐dry water year conditions. Using the
California Department of Water Resources (DWR) population tool and SB X7‐7 verification tables,
the City’s baseline per capita water use was determined to be 156 gallons per capita per day (gpcd)
with a 2015 target of 140 gpcd and a 2020 target of 124 gpcd (a 20% reduction from the baseline).
Thanks in part to the aggressive conservation programs employed by the City in light of the statewide
drought, the City’s 2015 per capita water use was calculated as 114 gpcd, well below its 2015 and
2020 targets.
Looking ahead to the City’s development and water needs, the City’s current plan positions it well to
meet any future demands regardless of water year type. California Department of Finance (DOF)
shows that the 2015 population was 116,764; future projections estimate a population slightly above
130,000 in 2040. The most recent Reclaimed Water Study (2014) evaluated the potential of utilizing
recycled water coordination to further supplement and enhance the City’s water supply sources. The
study determined that recycled water is not currently a cost‐effective solution, but may become more
feasible if increased water demand due to development were to occur. Potential future development
projects that are considered in this plan include two Priority Development Areas (PDAs) as well as
Solano 360, which together consists of approximately 375 acres of development within the City’s
November 2016
Page 1-2City of Vallejo
2015 Urban Water Management Plan
service area. However, even with this growth, total demands are actually expected to decrease over
the planning period of this UWMP with the implementation of water codes, conservation programs,
and higher water and sewer rates. The recent drought and state‐mandated restrictions have
demonstrated the effectiveness of the City’s water conservation and efficiency measures.
Additionally, this plan includes a Water Shortage Contingency Plan prepared by the City (Chapter 8)
which lays the foundation for the City’s response to reductions in water availability, as well as the
City’s demand management measures (Chapter 9), which are in place regardless of water year type
and supply availability.
November 2016
Page 1-3City of Vallejo
2015 Urban Water Management Plan
This page intentionally left blank.
November 2016
Page 1-4City of Vallejo
2015 Urban Water Management Plan
Section 2 Plan Preparation
This chapter provides information on the City’s process for developing the 2015 UWMP, including
efforts in coordination and outreach with other agencies in the region.
2.1. Basis for Preparing a Plan
The City acts as an urban, retail public water provider with over 3,000 connections (Table 2‐1),
requiring the preparation of an UWMP. This plan was prepared in compliance with the requirements
of California Water Code, Division 6, Part 2.6.
Table 2-1: Public Water System (DWR Table 2-1)
Number of
Volume of
Public Water System Public Water System Municipal
Water Supplied
Number Name Connections
2015 (MG)
2015
CA4810007 City of Vallejo 36,664 3,925
City of Vallejo – Lakes
CA4810021 848 78
System
TOTAL 37,512 4,003
2.2. Planning and Compliance Reporting
The City of Vallejo’s primary sources of water are the Solano Project (Lake Berryessa), State Water
Project (SWP)/Vallejo Permit Water (California Bay Delta), and Lakes Frey and Madigan. The City
also receives a small amount of water from the City of Fairfield to augment service to the Lakes
System. The City is a wholesale water provider to the cities of American Canyon and Benicia, as well
as Travis Air Force Base. The City prepared this UWMP individually (Table 2‐2), but has notified and
included stakeholders as discussed in the next section.
Table 2-2: Plan Identification (DWR Table 2-2)
X Individual UWMP
Regional UWMP
Information prepared for and presented in this UWMP is reported based on a calendar year and
water volumes are presented in Millions of Gallons (MG), as summarized in Table 2‐3.
November 2016
Page 2-1City of Vallejo
2015 Urban Water Management Plan
Table 2-3: Agency Identification (DWR Table 2-3)
Name of Agency City of Vallejo
X Agency is a wholesaler
X Agency is a retailer
Fiscal or Calendar Year
X UWMP Tables are in Calendar Years
UWMP Tables are in Fiscal Years
Units of Measure
Acre Feet (AF)
X Million Gallons (MG)
Hundred Cubic Feet (CCF)
2.3. Coordination and Outreach
The City of Vallejo participates in regional‐wide planning efforts through the Solano County Water
Agency (SCWA), is an active member of the California water community, and continually coordinates
with neighboring communities and water agencies regarding water‐planning activities. SCWA
members include the Cities of Benicia, Dixon, Fairfield, Rio Vista, Suisun City, Vacaville and Vallejo;
the Solano Irrigation and Maine Prairie Water Districts; and Reclamation District 208. Additionally,
the City coordinates with Travis Air Force Base, Vallejo Sanitation and Flood Control District, and the
City of American Canyon.
The City coordinated the preparation of this urban water management plan with other appropriate
agencies in the area, including the SCWA, Vallejo Sanitation and Flood Control District (VSFCD), the
Cities of Benicia, American Canyon and Fairfield. In June 2016, the City sent out letters to its regional
stakeholders to inform them of the UWMP preparation and to welcome comments or questions they
might have. The City notified both of its wholesale suppliers, Solano County Water Agency and the
State Water Resources Control Board (Table 2‐4), that this UWMP was being prepared. Additionally,
the City encouraged public participation in the development of the 2015 UWMP and provided
opportunities for public review and comment. Additional information regarding outreach and public
participation is included in Section 10.
Table 2-4: Water Supplier Information Exchange (DWR Table 2-4)
The retail supplier has informed the following wholesale supplier(s) of
projected water use in accordance with CWC 10631.
Wholesale Water Supplier Name
Solano County Water Agency
State Water Resources Control Board
November 2016
Page 2-2City of Vallejo
2015 Urban Water Management Plan
Section 3 System Description
The City of Vallejo provides water services to two, geographically distinct areas: the City of Vallejo
jurisdictional limits and adjacent unincorporated areas (termed “Vallejo proper”) and an area in the
unincorporated western part of Solano County and southern Napa County, known as “Vallejo Lakes”.
This chapter describes each portion of the City’s water system, including water supply source and
infrastructure.
3.1. Service Area Physical Description
The City of Vallejo is located approximately 30 miles northeast of San Francisco at the southern end
of Solano County. The City’s water service area is shown in Figure 3‐1 and, as previously described,
encompasses the city limits, unincorporated “Vallejo proper” (i.e., the neighborhoods of Home Acres,
Sandy Beach, and Starr Subdivision), as well as the Vallejo Lakes area (the area in the adjacent
unincorporated western part of Solano County and southern Napa County). The service area is
approximately 31 square miles of land area and includes predominantly residential and commercial
users. Elevations in the existing service area range from approximately 0 feet above mean sea level
to approximately 630 feet above mean sea level.
The water system is owned and operated by the City and governed by a 7‐member City Council. The
water system is operated and maintained by the Water Division of the Public Works Department.
City management staff for the water system consists of a City Manager, Public Works Director,
Assistant Public Works Director – Water, and Assistant Public Works Director – Maintenance.
The Vallejo Water system consists of two water treatment plants (WTPs): Fleming Hill WTP and
Green Valley WTP. The Fleming Hill WTP is a conventional 42 million gallons per day (mgd)
treatment plant with pre‐ozonation that treats water supplied from Lake Berryessa (Solano Project)
and from the Sacramento River Delta as delivered through the North Bay Aqueduct (NBA). Treated
water from this plant is delivered to city customers. The Green Valley WTP was completed in 1998
and is a conventional 1.0 mgd plant that treats water from Lake Berryessa and Lakes Frey and
Madigan. Treated water from this plant is delivered to Vallejo Lakes customers. Although not part
of the City's water service area, by agreement, the City also operates the Travis WTP on behalf of the
Travis Air Force Base. The Travis WTP is a conventional 7.5 mgd plant with pre‐ozonation.
The City water distribution system contains multiple pressure zones. Principal water mains in the
distribution system range in size from 14 to 24 inches in diameter. Most of the distribution grid
piping in the older sections of the City range in size from 4 to 8 inches in diameter, while the newer
areas are served by pipes 8 to12 inches in diameter.
November 2016
Page 3-1City of Vallejo
2015 Urban Water Management Plan
Figure 3-1: City of Vallejo Water Service Areas
November 2016
Page 3-2City of Vallejo
2015 Urban Water Management Plan
3.2. Climate
The City’s climate is typical of other areas in the northern part of the San Francisco Bay area. The
climate is characterized by summers that are dry and warm, and winters that are relatively mild, with
the majority of rainfall occurring during this season. Regional averages of the rate of
evapotranspiration of common turf grass (ETo), rainfall, and temperature are summarized in Table
3‐1.
The average annual rainfall and annual ETo for the region are approximately 13 and 45 inches per
year, respectively. ETo is a measurement of water evaporation combined with plant transpiration
and is expressed in the form of a rate, typically inches per time period. In other words, ETo is the
amount of water needed for common turf to grow in a specific region.
The average annual ETo for the region is approximately 32 inches more than the average annual
precipitation. Because of this difference, and because 90 percent of the annual precipitation occurs
between the months of November and April, growing turf in this region requires a significant amount
of irrigation during the dry season.
Table 3-1: Climate Characteristics for the City of Vallejo
Average Rainfall2, Average Air Temp1
Month Average ETo1, (in)
(in) (°F)
January 1.41 1.87 45.9
February 1.9 2.91 50.1
March 3.05 1.99 52.97
April 4.48 1.18 55.48
May 5.62 0.65 58.03
June 6.04 0.05 62.77
July 6.18 0.00 63.93
August 5.51 0.01 63.57
September 4.54 0.07 63.32
October 3.19 0.40 59.17
November 1.75 1.60 51.05
December 1.17 2.51 46.83
Annual 44.84 13.23 56.09
Table 3‐1 Notes:
1. Data was obtained from California Irrigation Management Information System (CIMIS), Station 109, Carneros,
which was the closest station to Vallejo, located north of San Pablo Bay. Values reflect monthly averages from
1/2010 – 12/2015.
2. Data was obtained from NOAA’s Global Historical Climatology Network, Station 49219, VALLEJO CA US. Values
reflect monthly averages from 1/2000 – 12/2015 (n=7 to n=9 for each month within the date range).
Climate Change
Sea Level Rise and Flooding
The City of Vallejo is bordered on the west by the Napa River and San Pablo Bay, and on the south by
the Carquinez Straits. The City of Vallejo and surrounding areas have been threatened by floods in
the past, such as overflows from the Napa River and insufficient flood control from the Lake Chabot
Dam. Improvements were made to the Lake Chabot Dam in the early 1980s following a harmful 100
November 2016
Page 3-3City of Vallejo
2015 Urban Water Management Plan
year flood event and the City is currently protected from Napa River flooding by Highway 37. The
adjoining wetlands, known as White Slough, also provide flood protection for the City. These flood
control facilities may be at risk from climate change effects such as sea level rise and increased storm
severity.
Although aging levees are a concern in many parts of the Delta system, the City of Vallejo is not
directly protected by levees. A levee failure could affect the portion of the City’s water supply that
comes through the North Bay Aqueduct and some farmland surrounding Vallejo, but would not likely
affect the City itself.
The nearest NOAA tidal gage is located 24 miles from the center of the City in Alameda, CA. This gage
shows that the “100‐year” flood height is 3.1 feet above the mean high tide line, with the highest
observed flood from 1976 to 2015 reaching 3.05 feet above the mean high tide line in 1983 (Climate
Central, 2016). This gage shows a gradual increase in the mean high tide line over the past few
decades, with an average increase of 0.72 mm per year (NOAA, 2016). The National Research Council
and Climate Central predict a local sea level rise of 2.9 feet by 2100 from a 1992 baseline. This
translates to a “34 percent multi‐year risk of at least one flood exceeding 3 feet from 2016 to 2030, a
93 percent risk from 2016 to midcentury, and a 100 percent risk by 2100” (Climate Central, 2016).
Under high‐end projections, these risks of a 3 foot flood all increase and the likelihood of at least one
flood exceeding 6 feet is 100 percent. Within the City of Vallejo, 690 acres of land, 1,854 people, and
$300 million in property are currently below 3 feet above mean high tide, and thus are potentially at
risk of flooding if sea level rises as expected. If floods reached 6 feet above mean high tide, 5,431
people and $672 million are at risk.
Ecosystem and Habitat Vulnerability
The region around the City, particularly the area north of Mare Island, contains aquatic habitats
vulnerable to erosion and sedimentation. Erosion is expected to increase under climate change
conditions and sedimentation is expected to shift, so habitats that are already sensitive to these
issues may be additionally impacted by climate change. Additionally, the coastal areas surrounding
the City may be impacted by the increased risk of storm surges due to seal level rise, making the
already fragile coastal ecosystems more vulnerable.
The Delta is an ecologically sensitive estuarine habitat that is likely to be significantly impacted by
climate change. The Delta relies on freshwater flows from the Sacramento and San Joaquin Rivers,
which are likely to be impacted by the decrease in snowpack and shifts in snowmelt patterns. The
Delta has been identified by the Endangered Species Coalitions Top 10 Habitats Vulnerable to Climate
Change, which points out that 12 of the original 29 indigenous Delta fish are either extinct or
endangered (ESA, 2011). Specifically, salmon populations make their migration run through the
Delta. Salmon require specific water temperatures and salinity levels to survive, so they are likely to
be impacted by changes in the seasonal shifts and overall decrease of cold freshwater in the Delta.
The Delta is also used for recreational, economic, and municipal purposes, so balancing these needs
with ecological needs may continue to become more challenging as the changing climate creates
shifts in freshwater flow patterns.
There are many State and Federally Endangered and Threatened plant and animal species in Solano
County, including Suisun Thistle, Soft Bird’s beak, Contra Costa Goldfields, Colusa Grass, San Joaquin
Valley Orcutt Grass, Solano Grass, Swainson’s Hawk, California Black Rail, California Clapper Rail,
California Tiger Salamander, California Red‐legged Frog, Giant Garter Snake, Slat Marsh Harvest
November 2016
Page 3-4City of Vallejo
2015 Urban Water Management Plan
Mouse, Conservancy Fairy Shrimp, Vernal Pool Fairy Shrimp, Vernal Pool Tadpole Shrimp, Delta
Green Ground Beetle, Valley Elderberry Longhorn Beetle, Callippe Silverspot Butterfly, Green
Sturgeon, Chinook Salmon, Steelhead, and Delta Smelt. The climate change impacts most likely to
affect these species are sea level rise, increased air and water temperature, increased carbon dioxide
concentrations, and changes in precipitation patterns. The Solano Habitat Conservation Plan provides
more details about these endangered species and how they are likely to be affected by climate change
(SCWA, 2012).
One of the sources of the City’s water supply, the Solano Project, is subject to quantified
environmental flow requirements; water is released from Lake Berryessa to Putah Creek to maintain
proper water quality and quantity for Chinook salmon and steelhead trout populations. Although
these requirements have gone unmet in the past, they may be difficult to maintain under climate
change conditions.
Hydropower
The City receives its power from Pacific Gas and Electric (PG&E), which utilizes hydropower as an
energy source. However, there are no hydropower facilities within the City’s region and no
hydropower facilities are planned for the future, so the City will likely not be significantly impacted
by climate change impacts to hydropower production.
3.3. Service Area Population
The City of Vallejo service area can be broken into three distinct population areas, each of which will
be discussed below:
City of Vallejo
Unincorporated Vallejo proper
Vallejo Lakes region
From 2000 to 2010, the City of Vallejo’s population dropped from 116,760 to 115,942, according to
the 2010 Census. California Department of Finance (DOF) data shows that the 2015 population
subsequently rose to 116,764. Future projections of City population were obtained from the
Association of Bay Area Governments (ABAG) 2013 projections by city. Population projections in 5‐
year increments for the City of Vallejo are shown in Table 3‐2.
The unincorporated Vallejo proper area includes the neighborhoods of Home Acres, Sandy Beach,
and Starr Subdivision. To estimate the area’s 2015 population, the area’s 913 single‐family
residential connections were multiplied by 2.78 persons per household (as provided by 2015 DOF
data for unincorporated Solano County) which comes to 2,535 people. For future projections, the
growth rate was assumed to be the same as the City of Vallejo’s population growth rate as determined
in ABAG projections. Population projections for the unincorporated Vallejo proper area in 5‐year
increments are shown in Table 3‐2.
In the Vallejo Lakes service area, most customer accounts are single‐family residential customers,
with a small number of multi‐family residential connections. For 2015, the number of 774 single‐
family residential connections was multiplied by 2.78 persons per household (as provided by 2015
DOF data for unincorporated Solano County) to estimate that portion of the area’s population. The
11 multifamily connections were multiplied by an assumed 5 persons per connection. When summed
together, the total estimated 2015 population for the Lakes region is 2,298. For future projections,
population in the Lakes region was assumed to increase at the rate of one new single‐family service
connection per year, using the same 2.78 persons per household based on 2015 DOF data for
November 2016
Page 3-5City of Vallejo
2015 Urban Water Management Plan
unincorporated Solano County. Population projections for the Vallejo Lakes region in 5‐year
increments are shown in Table 3‐2.
Table 3-2: Population – Current and Projected by Region
Population
2015 2020 2025 2030 2035 2040
Served
City of Vallejo 116,764 121,032 124,222 126,190 128,617 131,790
Unincorporated
2,590 2,685 2,755 2,799 2,853 2,923
Vallejo
Vallejo Lakes 2,298 2,312 2,326 2,340 2,354 2,367
A summary of the entire service area population is shown in Table 3‐3.
Table 3-3: Population – Current and Projected (DWR Table 3-1)
2015 2020 2025 2030 2035 2040
Population
Served
121,652 126,029 129,304 131,328 133,824 137,081
Potential future development projects in the City’s service area are identified below.
Priority Development Areas (PDA) are places identified by Bay Area communities are areas
for investment, new homes, and job growth. 2 PDAs exist within the City of Vallejo:
o The Vallejo Downtown and Waterfront PDA is a 149 acre area located in the City’s old
downtown area and along the City’s waterfront. The PDA consists of residential and
commercial development in the downtown and waterfront areas. This PDA is
included in the 2013 ABAG projections.
o The Sonoma Boulevard PDA is a mixed‐use 75 acre corridor along Sonoma Blvd
stretching from approximately Redwood Street down to Curtola Parkway. This PDA
was submitted to ABAG in 2015 and so it is not currently included in the 2013 ABAG
population projections.
Solano 360. This potential project consists of approximately 150 acres of (conceptualized)
entertainment and mixed‐use commercial development compatible with the adjacent Six
Flags Discovery Kingdom. The land is owned by Solano County, and is currently used for the
Solano County Fairgrounds. More information regarding this proposed development can be
found in the “Solano 360 Specific Plan” prepared by Solano County. A variety of private and
public funding sources will be necessary to support the future project. With the abolishment
of redevelopment agencies, the funding of this project has been impacted. Average water
demand for the Plan Area is estimated at 97.7 million gallons per year and up to 50 housing
units are conditionally permitted (SWA Architects, 2013). The Solano 360 Specific Plan was
updated in 2013, but not likely included in the 2013 ABAG population estimates due to timing
constraints of data availability.
November 2016
Page 3-6City of Vallejo
2015 Urban Water Management Plan
Mare Island. Implementation of the Mare Island Specific Plan involves the redevelopment of
the historic shipyard as a multi‐use community with a balance of industrial, office,
commercial, residential, educational, recreation, cultural, and open space uses, meeting the
needs of future generations. Mare Island is located on the western edge of the City of Vallejo
in southwestern Solano County. This future development project consists of approximately
1,448 acres of Reuse Areas. The City’s General Plan identifies the following Policy Action
(NBE‐2.4A) with respect to Mare Island redevelopment: “Continue to use the Mare Island
Specific Plan to guide development and conservation on Mare Island and support activities
that contribute to the economic and social well‐being of the community.” The Mare Island
Specific Plan was originally adopted in 1999, but has since undergone several revisions, most
recently in August 2013. ABAG population estimates likely consider some redevelopment of
Mare Island, but the extent and timing of such activities continue to evolve.
It is anticipated that there may be other developments approved between now and 2040 which
have not yet been submitted for consideration. For these undefined developments, the UWMP
assumes development consistent with the currently adopted General Plan. For the City’s General
Plan and current Housing Element, see: http://www.ci.vallejo.ca.us. Note that the City is currently in
the process of updating its General Plan. Since the General Plan update has not yet been finalized,
any changes in population projections (or assumptions relating to those projects) in the draft plan
would not have been included in the ABAG population values that were used to project future water
demands for this UWMP.
November 2016
Page 3-7City of Vallejo
2015 Urban Water Management Plan
This page intentionally left blank.
November 2016
Page 3-8City of Vallejo
2015 Urban Water Management Plan
Section 4 System Water Use
This chapter describes the City of Vallejo’s current water use and projected water use through the
year 2040.
4.1. Water Uses by Sector
Vallejo’s water use is limited to treated surface water from Solano Project (Lake Berryessa), State
Water Project (SWP)/Vallejo Permit Water (California Bay Delta), and Lakes Frey and Madigan. The
City’s water demand has historically been primarily attributed to residential use, with roughly 62
percent of all water produced serving residential demands. In 2015, 49 percent of water produced
serviced single family residences and 13 percent served multi‐family homes. Commercial demands
(which includes institutional and industrial demands) is the next largest water user, at 17 percent in
2015. Remaining 2015 water use included irrigation demand (9 percent of water produced), other
demands, such as public facilities, fire hydrants, etc. (3 percent) and water loss (9 percent).
Although water usage has decreased since 2012 due to the drought, the general split of City‐wide
water usage remained roughly the same in 2015 as it has been the previous decade. This can be
attributed to even growth across land use types in the City, with no large commercial or industrial
development that might significantly shift overall water usage. A summary of 2015 water demands
in million gallons (MG) per year can be found in Table 4‐1.
Table 4-1: 2015 Demands for Potable and Raw Water (DWR Table 4-1)
2015 Actual
Use Type Additional Description Level of Treatment
Volume (MG)
(as needed) When Delivered
Single‐Family1 Drinking Water 2,166
1
Multi‐Family Drinking Water 574
Commercial1,2 Drinking Water 727
Irrigation1 Drinking Water 410
Other1 Fire hydrant/services Drinking Water 126
Sales/Transfers/Exchanges to City of American Canyon
Drinking Water 33
other agencies3 treated deliveries
Raw water deliveries to
Sales/Transfers/Exchanges to American Canyon,
Raw Water 850
other agencies3 Benicia, and Travis Air
Force Base
Losses Drinking Water 963
TOTAL 5,849
Table 4‐1 Notes:
1. Values based on study conducted by M. Cubed (2016). Projected water use by use type in each 5‐year increment may
not add up to listed sum due to rounding.
2. Institutional and industrial demands are included in commercial demand.
3. Values based on City of American Canyon 2015 UWMP, City of Benicia 2015 UWMP, and prediction from Travis Air
Force Base 2005 Water Supply Master Plan of 2.9 mgd average with 15% contingency. Includes both raw and treated
water demands.
November 2016
Page 4-1City of Vallejo
2015 Urban Water Management Plan
As discussed in Section 3.3, population growth is estimated to remain low, at around 1 percent,
resulting in a slow increase in residential units. Additional growth in the City is expected to be
proportional to the population projections, meaning that the future water use breakdown by sector
will remain roughly proportional. Demand projections were calculated using population
projections, forecasts of the number of metered connections, historical water use, and anticipated
changes in water use practices. Though there will be some future growth, the implementation of
water codes, conservation programs, and higher water and sewer rates (the effects of which have
all been incorporated into the projections) will limit the increase in total City‐wide demand, with
total demands actually expected to decrease over the planning period of this UWMP. A technical
memorandum describing the methodology used to calculate the demand projections is available in
Appendix B. Table 4‐2 summarizes the projected water demands in the City. Since there is no
recycled water use within the City’s service area, City’s total water demands are equal to the
potable and raw water demands, as summarized in Table 4‐3.
Table 4-2: Project Demands for Potable and Raw Water (DWR Table 4-2)
Additional Projected Water Use (MG)
Use Type Description
(as needed) 2020 2025 2030 2035 2040
Single‐Family1 2,591 2,515 2,428 2,365 2,281
1
Multi‐Family 610 602 593 590 590
Commercial1,2 835 806 770 738 707
Agricultural irrigation1 584 571 547 518 485
Fire
Other1 123 126 128 130 134
hydrant/services
Sales/Transfers/Exchanges (includes raw and
2,599 2,783 2,783 2,783 2,783
to other agencies3 treated)
Losses1 950 711 496 483 466
TOTAL (MG) 8,291 8,114 7,746 7,608 7,447
Table 4‐2 Notes:
1. Values based on study conducted by M. Cubed (2016). Projected water use by use type in each 5‐year increment may
not add up to listed sum due to rounding.
2. Institutional and industrial demands are included in Commercial demand.
3. Values based on City of American Canyon 2015 UWMP, City of Benicia 2015 UWMP, and prediction from Travis Air
Force Base 2005 Water Supply Master Plan of 2.9 mgd average with 15% contingency. Includes both raw and treated
water demands.
November 2016
Page 4-2City of Vallejo
2015 Urban Water Management Plan
Table 4-3: Total Water Demands (DWR Table 4-3)
2015 2020 2025 2030 2035 2040
Potable and Raw
Water
5,849 8,291 8,114 7,746 7,608 7,447
From Tables 4‐1 and
4‐2
Recycled Water
Demand 0 0 0 0 0 0
From Table 6‐4
TOTAL WATER
5,849 8,291 8,114 7,746 7,608 7,447
DEMAND (MG)
4.2. Distribution System Water Losses
City water losses fall into two categories: distribution system losses (real losses) and apparent water
losses. Using the American Water Works Association (AWWA) Water Audit software, the City’s 2015
total water loss was calculated to be approximately 963 MG (Table 4‐4). This calculation is based on
a preliminary version of the City’s 2015 Water Loss Audit which will not be finalized until it has been
validated through DWR’s Water Loss Technical Assistance Program in 2016‐2017. This water loss is
equivalent to a 22 percent loss rate when compared to water supplied and is consistent with the loss
rate observed over the previous few years and in line with the City’s water loss goal. Results of the
Water Audit are available in Appendix C.
Table 4-4: AWWA Water Loss Audit (DWR Table 4-4)
Reporting Period Start Date Volume of Water Loss1
January 2015 963 MG
Notes:
1. Based on the AWWA Water Audit and methods presented in Appendix L of the
DWR Guidebook.
4.3. Estimating Future Water Savings
In order to meet water use targets and continue striving for more efficient water use, the City
anticipates an increase in water savings due to enforcement of new plumbing codes, conservation
programs, water loss management and potentially increased water/sewer rates. The water
demand projections presented in Table 4‐2 (calculated by M.Cubed and included in Appendix B)
accounted for these water savings measures (Table 4‐5). Plumbing codes, water and sewer rate
increases, and demand management measures are projected to reduce demands by roughly 26
percent by 2040 as shown in Figure 4‐1.
November 2016
Page 4-3You can also read