Using "Risk Maps" to visually model & communicate risk
←
→
Page content transcription
If your browser does not render page correctly, please read the page content below
Using “Risk Maps” to visually
 model & communicate risk

                        Martin Neil
                            Agena Ltd &
       Risk Assessment and Decision Analysis Research Group,
   Department of Computer Science, Queen Mary, University of London
                             London, UK
                        Web: www.agenarisk.com
                       Email: martin@agena.co.uk
Contents
•   Problems with current approaches
•   Risk Maps as Solution
•   Risk Map Toolkit
•   Risk Mapping for Enterprise Risk
•   Risk Map Applications
•   Final Remarks

                     All Examples shown using AgenaRisk software
                                                                   2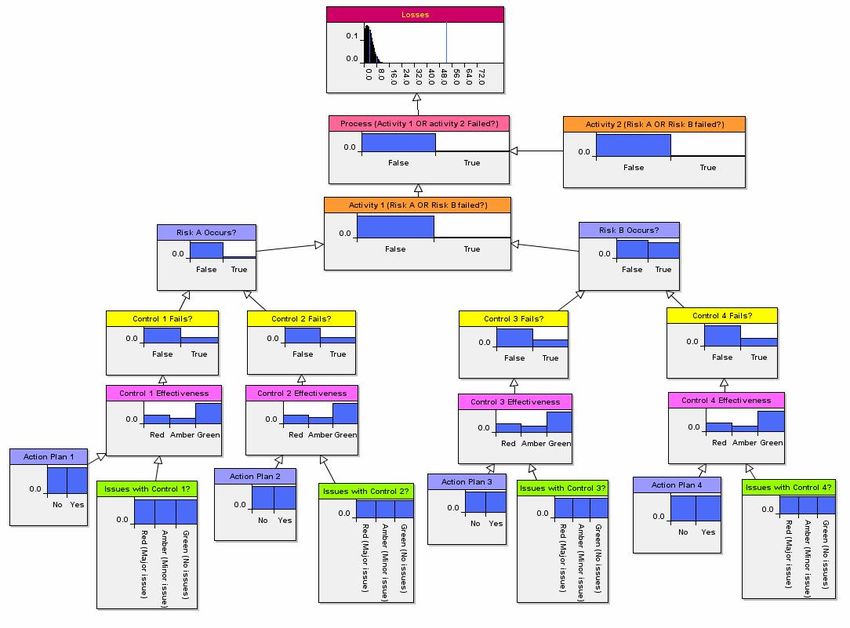
Problems with current
    approaches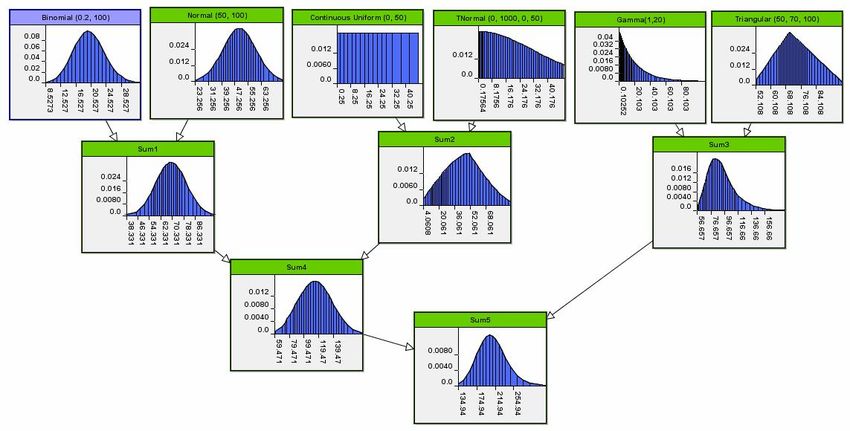
Risk Register
•   “There are tight budget constraints”
•   “The project overruns its schedule”
•   “The company’s reputation is damaged
    externally by publicity about poor final system”
•   “The customer refuses to pay”
•   “The delivered system has many faults”
•   “The requirements are especially complex”
•   “The development staff are incompetent”
•   “Key staff leave the project”
•   “The staff are poorly motivated”
•   “Generally cannot recruit good staff because
    of location”
•   “There is a major terrorist attack”

                                                       4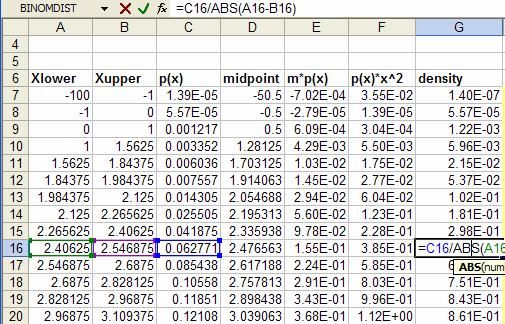
Risk Heat Maps and Profiles

       Risk = Likelihood x Impact
                                    5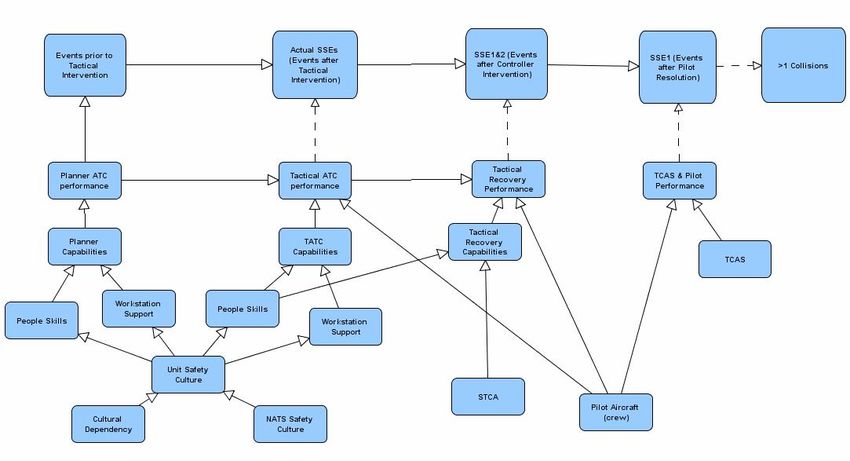
Spreadsheets

               6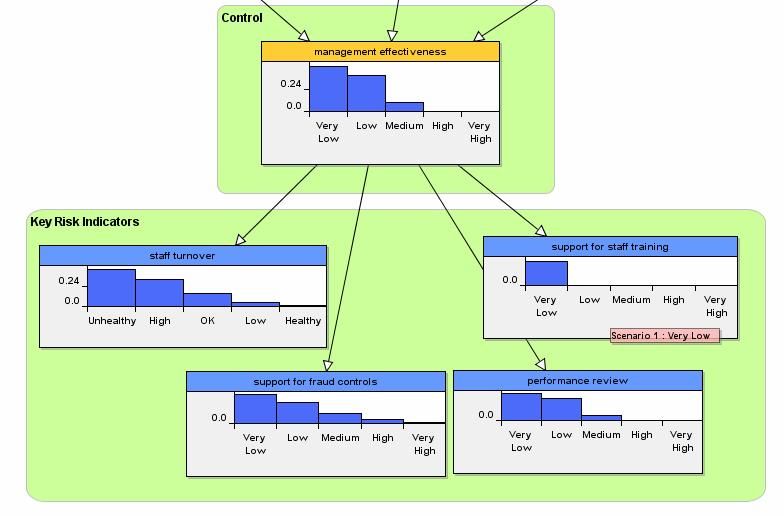
Expert Judgement “I Assume”
• On the one hand….
– Obvious risk of being wrong
– Dangerous if unverified, checked or agreed
– Political
• On the other hand….
– Absolutely necessary
– Unavoidable
– We employ people for a reason!
• Model Risk: If you want to analyse risk
you are going to have to take them….
7
How good are people
               at estimating risk?
• Evidence from psychology is worrying!
    – Availability of more recent cases
    – Emphasis on easier to remember dramatic events
    – Large single consequence often outweighs
      multiple small consequences
•   Framing Problem: Answer you get depends how
    you ask the question!

      “What is the chance of disease?”
      Vs
      “Given positive test result what is the chance of disease?”
      Vs
      “Chance of disease given test positive?”

                                                                    8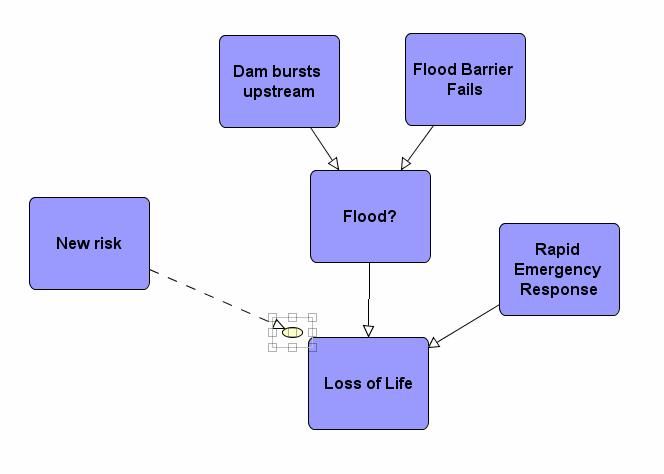
If you cannot trust people
           can you trust the data?
• Statistical validity restricted to controlled
  experiments
• Data sets must represent homogeneous
  samples and correlations clear
   – High correlation between shoe size and IQ!
• Do you even have the data?
   – New business ventures?
   – Rare events?
   ……

                 The lure of objective irrationality

                                                       9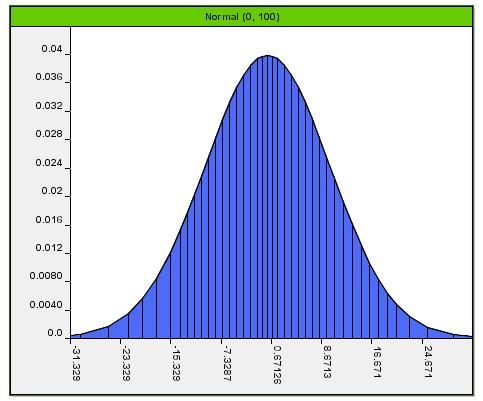
Combining Subjective and
Objective information
• Casino 1 Honest Joe’s.
– You visit a reputable casino at midnight in a good neighbourhood
in a city you know well. When there you see various civic
dignitaries (judges etc.). You decide to play a dice game where
you win if the die comes up six.
– What is the probability of a six?
• Casino 2 Shady Sams.
– More than a few drinks later the Casino closes forcing you to
gamble elsewhere. You know the only place open is Shady
Sam’s but you have never been. The doormen give you a hard
time, there are prostitutes at the bar and hustlers all around. Yet
you decide to play the same dice game.
– What is the probability of a six?
10Risk Maps as a Solution
Assessing Risk of Road Fatalities:
        Naïve Approach

              Season       Colder months

             Number of
                           Fewer fatalities
              Fatalities

                                              12
Assessing Risk of Road
Fatalities: Causal model
Season
Road
Conditions Weather
Number
of journeys
Average
speed
Danger
level
Number of
Fatalities
13Rev Thomas Bayes
14Bayes’ Theorem
A: ‘Person has cancer’ p(A) = 0.1 (priors)
B: ‘Person is smoker’ p(B) = 0.5
What is p(A | B)? (posterior)
p(B | A) = 0.8 (likelihood)
Posterior probability Likelihood Prior probability
p(B | A)p( A )
p( A | B ) =
p(B )
So p(A|B)=0.16
15Decomposing (Exposing) Risk
Measure
• Standard Definition:
Risk = Impact x Probability
• Is this decomposition enough?
• Expose the assumptions!
– What is the context driving the numbers?
– Who’s risk is it?
– Is it a risk to me?
– Is it really a risk?
– An indicator of a risk?
– A mitigant…..?
16Causal Framework for Risk
• Replace oversimplistic measure of risk
with a causal approach
• Characterise risk by event chain involving:
– The risk itself (at least)
– One consequence event
– One or more trigger events
– One or more mitigant events
• Context “tells a story” and depends on
perspective
17Town Flood Example
Trigger Control
Mitigant
Risk Event
Consequence
18Calculation of Town Flood Risk
19Flood Example – Homeowners
Trigger Control
Perspective
Mitigant
Risk Event
Consequence
20Calculation of Home Flood Risk
214 Steps to define a risk map
1. Consider set of events from given
perspective
2. For each event identify triggers and
controls
3. For each event identify consquences and
mitigants
4. Define probabilities for risk nodes
22Connecting Risk Maps using
Building Blocks
• Connect risk maps
via input/output risk
nodes
• Create complex time
based or complex
structural models
23Benefits
• “A picture tells a thousand words”
• Explicitly quantifies uncertainty
• Connecting models “connects
perspectives”
• Dynamic calculation of risk values
• Great for “what if” analysis
24Risk Map Toolkit
Sophistication Spectrum
Dynamic
“Mind” Modelling
Mapping Expertled
Simulation And
Difficult
Accessible Expert
And Systems Statistical
Simple
Causal Learning
modelling from data
26Risk Map
• Nodes represent
– variables
– events
– quantities
• Links represent
relationships
– relevance
– causality
• Easy to support
and understand
27Measuring Scales
• Risk Node Types
– Boolean (Yes/No, True/False)
– Labelled (Red, Blue, Green)
– Numeric (Integer, Continuous, Discrete)
– Ranked (High, Medium, Low)
28Discrete Probabilities
• Prior probabilities
• Conditional Probabilities
• Result viewed as marginal probability distribution
29Continuous Probabilities by Simulation
Model Statistical Distributions E.g. Normal
1 - ( x - m )2 /(2s 2 )
p( X ) = e
s 2p
30Simulation Model
31Backwards Reasoning
• Estimate causes
from effects!
• Useful way to
model uncertain
indicators
32Statistical Learning
33Risk Mapping for Enterprise Risk
Key RCSA* Questions
       •    What risks can occur?
       •    Can they occur in my process?
       •    How rare are they?
       •    How reliable are our controls?
       •    How good is our internal and external data?
       •    What is likely level of losses?
       •    What is worst case scenario?
       •    How can we improve?
       •    What should we improve?

                          * RCSA = Risk Control Self Assessment   35
© Agena Ltd 2005
Assessing Enterprise Risk
• Blend qualitative information with quantitative loss data
• COSO/CRSA style risk and business assessment
• Selfassessment data to predict process reliability in
quantitative terms
• Measure and combine:
– Process, Task reliability
– Risks to reliability
– Action plans
– Issues
• Used to forecast VaR, ROI, capital charge, insurance
levels.
36
© Agena Ltd 2005Risk Map for RCSA
37Risk Map Applications
“Risky” Applications
• Aircraft Midair
collision
• Software defects
• Systems reliability
• Warranty return rates
of electronic parts
• Operational risk in
financial institutions
39Aircraft MidAir Collision Prediction
40Final Remarks
• Structured Method
– Based on 300 year old proven Bayes’ theorem
– Enabled by modern computer power & technology
– Beyond current statistical & Monte Carlo techniques
– Combines subjective judgements with data
• Risk Maps enable Visual Communication
– Managing risk through pictures
– Useable by risk novices as well as experts
– Makes complex risk problems easily communicable
• AgenaRisk is Industrial Strength
– Enables scalable, reusable & auditable risk models
– Integrates easily with DBMS & Excel
– Enables professional developers to build enduser applications
41Next Steps
To build a risk map download and enjoy a FREE
Evaluation copy of AgenaRisk visit:
www.agenarisk.com
42You can also read