Using the QinetiQ Google Earth Interactive File
←
→
Page content transcription
If your browser does not render page correctly, please read the page content below
QinetiQ Proprietary
October 2011
Using the QinetiQ Google Earth Interactive File
This document outlines what is contained within the interactive Google Earth file,
and how to use its features.
Running the Google Earth file
The QinetiQ interactive Google Earth file is entitled Kiton Moor Pre-Planning
Assessment_v0.#.kmz, where the # represents the current version number. To view
the interactive files, you need one of two things:
1. The latest version of Google Earth installed
or
2. A broadband internet connection where you can download and run the latest
version of Google Earth (NOTE: you will need to be connected to the internet whilst
running the interactive Google Earth file)
If you have Google Earth installed then double click the interactive KMZ files to run
them. If you do not have Google Earth installed, then using a web browser go to
http://earth.google.com/ and download and install the latest version. You will then
be able to run them.
Using the Google Earth interactive File
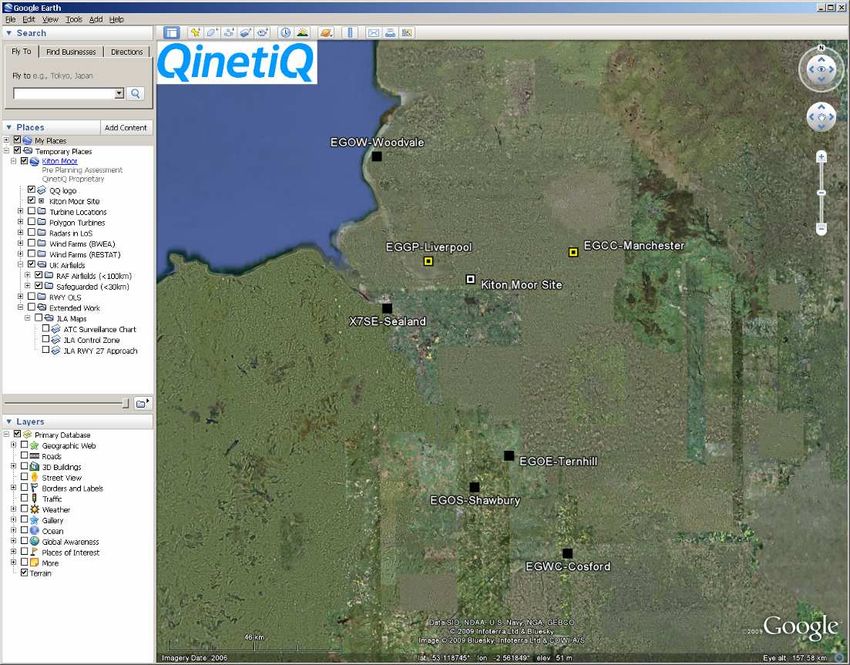
Once the pre-planning assessment interactive Google Earth file has been loaded, the
view should automatically fly to the area of interest. A screen grab of the Google
Earth viewer is shown below and highlights the interactive parts.
To move around the Google Earth terrain, use the Navigation compass on the top
right hand corner of the viewer.
The interactive data can be switched on and off via the places panel on the left hand
side of the viewer. The wind farm and potentially affected airfield locations are on by
default.
It is recommended that when using the example file, switch off all the Google Earth
layers in the layers panel to stop the Google Earth viewer appearing cluttered. You can
however, still keep the terrain option ticked, so that you get the 3D view of the terrain
heights.
Copyright © QinetiQ ltd 2011
Page 1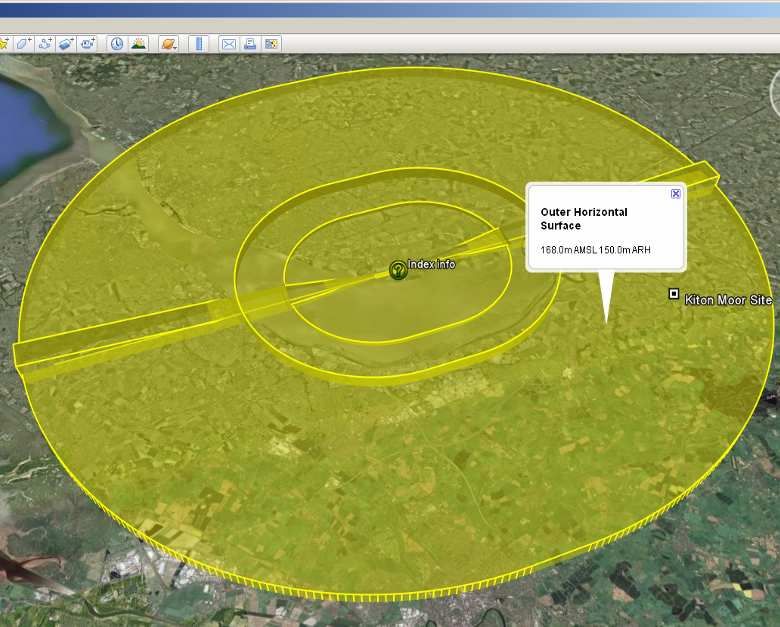
QinetiQ Proprietary

                                                    Navigation

                            Interactive
                               Data

                           Google Earth
                             Layers

The figure below shows a close up of the places panel where the interactive data can
be switched on and off. To switch relevant data on and off, click in the data’s
respective tick box (as indicated below).

    Data tick box

    Transparency
        Slider

                                                                             Page 2
                            QinetiQ Proprietary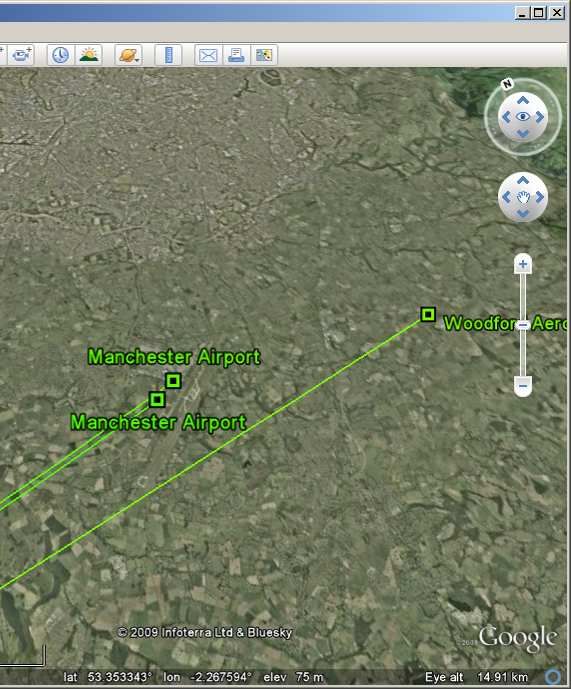
QinetiQ Proprietary

The following list gives an indication of what each tick box of data represents:
      Kiton Moor Site: Shows the central position of the wind farm site. (On by
      default)
      Turbine Locations: Shows the locations of all the turbines in the proposed
      development. (Off by default)
      Polygon Turbines: Shows geometrically correct polygon models of the turbines
      on the Google Earth terrain (Off by default)
      Radars in LoS: Shows all radars that are in line of sight (LoS) to the proposed
      turbines. All the subsequently displayed icons and text are colour coded,
      altering by the radars LoS value. E.g. red means a high value of LoS, dark blue
      means little or no LoS. Clicking on each of the displayed radar icons, displays
      information about the site, and also all the relevant range, bearing and LoS
      information to each individual turbine. An example of this is displayed in the
      image below. (Off by default)

      Wind Farms (RenewableUK): Shows all additional wind farms within a specified
      range of the proposed wind farm, according to the online RenewableUK
      database. Clicking on the additional wind farm icons displays information on
      the development, as well as range and bearing information to the individual
      proposed turbines. Colours of the displayed icons represent their status in the
      planning system, blue – operational, orange – construction phase, green –
      consented, red – in planning, grey – status unknown/abandoned (Off by
      default)
      Wind Farms (RESTATS): Shows all additional wind farms within a specified
      range of the proposed wind farm, according to the renewable energy statistics
      (RESTATS) database. Clicking on the additional wind farm icons displays
      information on the development, as well as range and bearing information to
      the individual proposed turbines. Colours of the displayed icons represent their

                                                                                   Page 3
                             QinetiQ Proprietary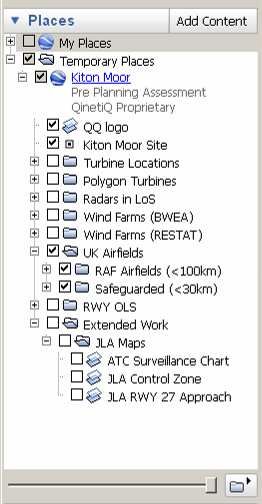
QinetiQ Proprietary

status in the planning system, blue – operational, orange – construction phase,
green – consented, red –in planning, grey – status unknown/abandoned (Off by
default)
UK Airfields: Shows all civil airfields (safeguarded, licensed and unlicensed)
within the consultation distances set out in Civil Aviation Authority (CAA) policy
document CAP 764. Also shown are all RAF airfields out to 100km. Clicking on
the airfield icons displays information on the airfield, as well as range and
bearing information to the individual proposed turbines. Colours of the
displayed icons represent the airfield type, black – RAF airfield, yellow –
safeguarded, orange – licensed, blue – unlicensed. (Off by default)
RWY OLS: Shows the obstacle limitation surfaces (OLS), as defined in the CAA
policy document CAP 168, for any aerodromes that could be affected by the
proposed turbines. The image below shows an example of the surfaces that are
plotted, which are three dimensional. Clicking on any of the surfaces provides
information of the heights of the surface above mean sea level (AMSL) or above
runway height (ARH). To find out about the surface heights directly above the
turbines, simple click on the info icon located at the centre of the affected
aerodrome runway. (Off by default)

Extended Work: Outlines work that is in addition to the baseline pre-planning
type assessment
John Lennon Airport (JLA) Maps: These maps can be used to show the location
of the proposed wind farm with respect to any areas of operational
significance, including en-route air lanes, area of intense aerial activity and
approach/departure paths. These maps, along with modelling evidence, can be
used to determine the impact of a wind farm on air traffic control (ATC)
operations. The transparency slider can be used to fade the maps in and out,
meaning multiple maps can be viewed simultaneously.

                                                                           Page 4
                       QinetiQ Proprietary
QinetiQ Proprietary
Closing the Google Earth Files
When you have finished your session, click the cross in the top right hand corner of
the Google Earth viewer. The following box will appear:
Click No and then the program will shutdown. Or simply click on the objects in the
Temporary Places folder, and press delete.
Page 5
QinetiQ ProprietaryYou can also read