VALE'S PERFORMANCE IN 1Q22 - Mziq
←
→
Page content transcription
If your browser does not render page correctly, please read the page content below
Autonomous stacker reclaimer in Serra Norte stockyard (March 2022)

      VALE’S PERFORMANCE
      IN 1Q22
www.vale.com
vale.ri@vale.com

Investor Relations Department
Ivan Fadel
André Werner
Mariana Rocha
Samir Bassil

Conference call and webcast on Thursday, April 28
  In English with simultaneous translation to Portuguese at
  11:00 a.m. Brasilia time (10:00 a.m. New York time, 3:00 p.m.
  London time).
  The conference calls will be transmitted live through our website
  at www.vale.com/investors

  Dial in:
  +55 (11) 4090 1621 / 3181 8565 (Brazil)
  +44 20 3795 9972 (U.K.)
  +1 844 204 8942 (U.S. toll free)
  +1 412 717 9627 (U.S.)

  Access code: VALE

Except where otherwise indicated, the operational and financial information in this release is based on the consolidated figures in accordance with IFRS. Our
quarterly financial statements are reviewed by the company’s independent auditors. The main subsidiaries that are consolidated are the following: Companhia
Portuária da Baía de Sepetiba, Mineração Corumbaense Reunida S.A., Minerações Brasileiras Reunidas S.A. PT Vale Indonesia Tbk, Salobo Metais S.A, Vale
Holdings B.V., Vale Canada Limited, Vale International S.A., Vale Manganês S.A., Vale Malaysia Minerals Sdn. Bhd., Vale Moçambique S.A., Vale Oman
Pelletizing Company LLC and Vale Oman Distribution Center LLC.
This press release may include statements about Vale's current expectations about future events or results (forward-looking statements). Many of those forward-
looking statements can be identified by the use of forward-looking words such as "anticipate," "believe," "could," "expect," "should," "plan," "intend," "estimate"
“will” and "potential," among others. All forward-looking statements involve various risks and uncertainties. Vale cannot guarantee that these statements will prove
correct. These risks and uncertainties include, among others, factors related to: (a) the countries where Vale operates, especially Brazil and Canada; (b) the
global economy; (c) the capital markets; (d) the mining and metals prices and their dependence on global industrial production, which is cyclical by nature; and
(e) global competition in the markets in which Vale operates. Vale cautions you that actual results may differ materially from the plans, objectives, expectations,
estimates and intentions expressed in this presentation. Vale undertakes no obligation to publicly update or revise any forward-looking statement, whether as a
result of new information or future events or for any other reason. To obtain further information on factors that may lead to results different from those forecast by
Vale, please consult the reports that Vale files with the U.S. Securities and Exchange Commission (SEC), the Brazilian Comissão de Valores Mobiliários (CVM)
and, in particular, the factors discussed under “Forward-Looking Statements” and “Risk Factors” in Vale’s annual report on Form 20-F.
Cautionary Note to U.S. Investors – Vale currently complies with SEC Industry Guide 7 in its reporting of mineral reserves in SEC filings. SEC Industry Guide 7
permits mining companies, in their filings with the SEC, to disclose only those mineral deposits that a company can economically and legally extract or produce.
We present certain information in this presentation that are not be permitted in an SEC filing. These materials are not proven or probable reserves, as defined by
the SEC, and we cannot assure you that these materials will be converted into proven or probable reserves, as defined by the SEC. Starting in its next annual
report on Form 20-F, Vale will comply with Subpart 1300 of Regulation S-K, which will replace SEC Industry Guide 7. Subpart 1300 of Regulation S-K permits
mining companies, in their filings with the SEC, to disclose “mineral reserves”, “mineral resources” and “exploration targets” that are based upon and accurately
reflects information and supporting documentation of a qualified person. We present certain information in this presentation that are not based upon information
or documentation of a qualified person, and that will not be permitted in an SEC filing under Subpart 1300 of Regulation S-K. These materials are not mineral
reserves, mineral resources or exploration targets, as defined by the SEC, and we cannot assure you that these materials will be converted into mineral reserves,
mineral resources or exploration targets, as defined by the SEC. U.S. Investors should consider closely the disclosure in our Annual Report on Form 20-K, which
may be obtained from us, from our website or at http://http://us.sec.gov/edgar.shtml.
The information contained in this press release includes financial measures that are not prepared in accordance with IFRS. These non-IFRS measures differ
from the most directly comparable measures determined under IFRS, but we have not presented a reconciliation to the most directly comparable IFRS measures,
because the non-IFRS measures are forward-looking and a reconciliation cannot be prepared without unreasonable effort.
Vale’s performance in review

Rio de Janeiro, April 27, 2022 – “Despite the challenging quarter in our operations, we are on
track to deliver on our commitments for 2022. In 1Q22, we faced heavy rainfall in Minas Gerais,
licensing delays in the North and performance below par at some assets. Nevertheless, we took
the opportunity of the seasonally-lower volumes to concentrate our maintenance activities that
will lead the way for a safer operational environment and solid production ahead. Confident about
our business outlook, we are announcing a third share-buyback program, as another lever of
value creation for our shareholders.”, commented Eduardo Bartolomeo, Chief Executive Officer.

Highlights of 1Q22

Our operations

•   In March, we entered into a multi-year agreement to supply low-carbon nickel products to
    Swedish lithium-cell producer Northvolt AB, reinforcing our commitment to sustainability in
    the electric vehicle supply chain and electrification of the broader mining industry and
    reaffirming our position as a supplier of choice to the fast-growing electric vehicle industry.

•   In April, we started the construction works of Tecnored’s first commercial plant in the state
    of Pará. Tecnored is 100% owned by us and focuses on developing a low-carbon pig iron
    process through energy sources that emit less CO2 than coal and coke, the traditional iron-
    making methods. The plant will initially have a capacity of 250 ktpy of green pig iron and
    may reach 500 ktpy in the future. We plan the start-up for 2025 with an estimated
    investment of approximately R$ 1.6 billion.

Our commitments to reparation and society

•   The actions provided for in the Integral Reparation Agreement are well in progress. After
    judicial authorization, Vale began to detail information to implement 9 socio-economic
    repair projects, selected by the parties based on the results of popular consultation. These
    projects are part of the Fast Response Package and cover the areas of health, social
    development, infrastructure, agriculture and livestock, in Brumadinho and in the other 25
    municipalities in the Paraopeba basin. The details of the scope of each project will be
    evaluated by the other parties to the Integral Reparation Agreement and, once approved,
    will allow the effective execution of the projects.

For further details on the reparation progress, an overview of ongoing works and projects, and
the terms of the Integral Reparation Agreement, please visit www.vale.com/esg.

Dam safety

•   In February, we signed an agreement with the state of Minas Gerais, regulatory agencies
    and state and federal public prosecutors, establishing a schedule and reinforcing the
    commitment to de-characterize all our upstream structures in Brazil. The agreement brings
    more legal and technical certainty to the process, extending the original deadline for the
    conclusion and reflecting the required actions to increase safety during the works. We

                                             3
agreed to hire an independent consulting firm to confirm technical feasibility of deadlines
for de-characterizing each structure included in our plan. We will also contribute with a
value of R$ 236 million for investments in social and environmental projects, with
disbursement over eight years.
• In April, we began the de-characterization of the Dique Auxiliar da Barragem 5, at the Águas
Claras Mine, in Nova Lima (MG). The dike is one of the five upstream structures to be
eliminated in 2022. By the end of the year, Vale expects to have eliminated a total of 12
upstream structures under the De-characterization Program in Brazil.
Focusing on the core business
• In February, we concluded the sale of the 50% stake we had at California Steel Industries
– CSI to Nucor Corporation, and, in April, we successfully completed the sale of the Moatize
coal mine and the Nacala Logistics Corridor to Vulcan Resources, following the completion
of all conditions precedent.
• In April, we also entered into a binding agreement to divest our iron ore, manganese ore
and logistics assets in the Midwestern System. Under the terms agreed, the enterprise
value of the transaction is approximately US$ 1.2 billion for a set of assets that produced
2.7Mt of iron ore and 0.2Mt of manganese, and that contributed to Vale with US$ 110 million
of adjusted EBITDA in 2021. At closing, we expect to receive approximately US$ 150
million, in addition to transferring the obligations related to the take-or-pay logistics
contracts, subject to the consent of the applicable counterparties and customary conditions
precedent.
Sharing value creation
• Aligned with our drive to deliver superior value to our shareholders, we paid dividends of
US$ 3.5 billion and advanced with our share buyback program, which is 84 % complete as
of the date of this report1.
• In continuity with the 2021 share buyback programs, our Board of Directors approved a
new program of up to 500 million shares, equivalent to around 10% of the currently
outstanding shares of the company, to be executed in the following 18 months and after
the conclusion of the current program. Upon conclusion of the third sequential buyback,
Vale’s shareholders interest in the company’s results will have increased by more than 22%
since the approval of the first program in 2021.
1 Asof the date of this report, US$ 3.01 billion was spent to repurchase circa 168 million shares in the October 2021 announced
repurchase program. As reflected in our 1Q22 Financial Statement, until March 31, 2022, the Company repurchased approximately
100.2 million common shares and their respective ADRs, corresponding to a total amount of US$ 1.788 billion.
4Vale’s performance 1Q22
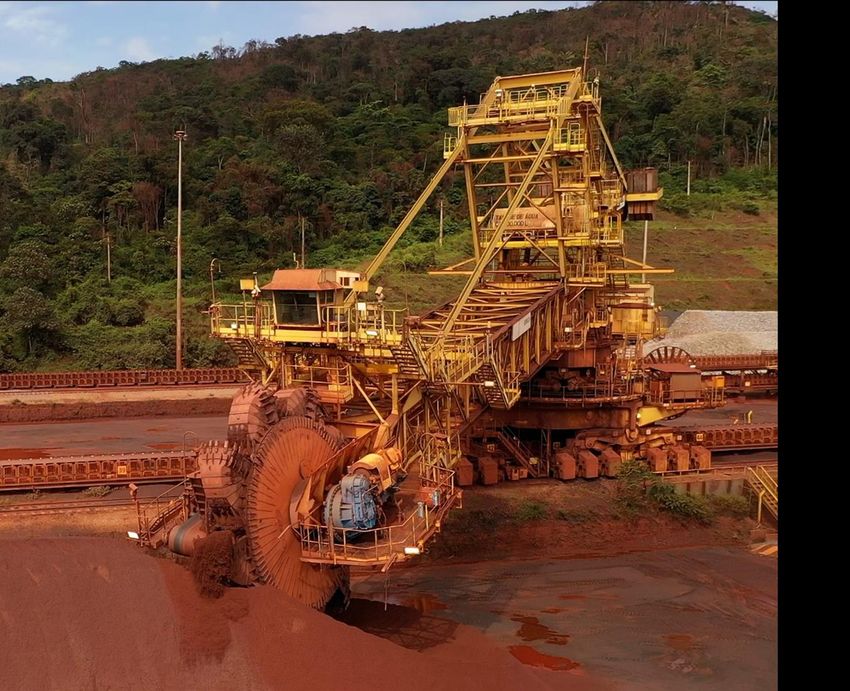
In 1Q22, Vale reported a proforma adjusted EBITDA from continued operations of US$ 6.374
billion, US$ 483 million lower than 4Q21.
Proforma EBITDA from continuing operations 1Q22 vs. 4Q21
The main drivers for 1Q22 performance compared to 4Q21 were: (i) the lower sales volume for
iron ore and pellets, mainly due to the intense rainy season in 1Q22 and the weaker
performance of the northern system (US$ 2.192 billion), and (ii) the higher realized prices for
iron ore and pellets (US$ 1.812 billion), following the US$ 32/t increase in the 62% benchmark
price and higher quality premium, working to partially offset the weaker iron ore volumes.
Selected financial indicators
US$ million 1Q22 4Q21 1Q21
Net operating revenues 10,812 13,105 12,553
Total costs and other expenses (5,124) (7,228) (4,660)
Expenses related to Brumadinho event and de-characterization of dams (160) (2,115) (115)
Adjusted EBIT from continuing operations 5,528 3,904 7,778
Adjusted EBIT margin (%) 51% 30% 62%
Adjusted EBITDA from continuing operations 6,214 4,726 8,509
Adjusted EBITDA margin (%) 57% 36% 68%
Proforma adjusted EBITDA from continuing operations¹ 6,374 6,857 8,626
Iron ore - 62% Fe reference price 141.6 109.6 166.9
Net income attributable to Vale's stockholders 4,458 5,427 5,546
Net debt ² 4,911 1,877 (505)
Capital expenditures 1,136 1,751 980
¹ Excluding expenses related to Brumadinho and donations associated with COVID-19.
² Including leases (IFRS 16).
Net income in 1Q22 was US$ 4.458 billion, US$ 969 million lower than 4Q21. The seasonally
lower EBITDA and the higher 4Q21 financial results explain the decline, which was partially
offset by the US$ 1.1 billion positive impact of the binding agreement to sell the Midwestern
iron ore and manganese operations and the provisions for dams’ de-characterization and
Renova Foundation charged in 4Q21.
5In 1Q22, we invested US$ 1.1 billion in growth projects and sustaining, US$ 615 million lower
than in 4Q21, due to seasonally higher investments during the drier season at the end of the
year.
Gross debt and leases totaled US$ 14.0 billion at the end of 1Q22, in line with 4Q21. Net debt
totaled US$ 4.9 billion, US$ 3.0 billion higher than 4Q21, mainly due to US$ 3.5 billion dividends
payment, US$ 1.8 billion in share buyback and US$ 720 million change in working capital,
following the higher production and investments pace in the fourth quarter and disbursements
related to profit sharing in the first quarter, partially offset by the stronger accounts receivable
collection in the first quarter.
Expanded net debt increased to US$ 19.4 billion, mainly attributed to the Brazilian Real
appreciation effect on the commitments denominated in local currency, partially offset by the
mark-to-market gains on the foreign exchange hedge positions. During this quarter, we
reviewed with our Board of Directors a change in our optimal leverage from US$ 15 billion to a
range of US$10 - 20 billion, under the expanded net debt concept. This decision reflects of the
proactive liability management performed in the last several months with no relevant financial
amortizations due by 2024, a sustainable increase in our production capacity and a very
disciplined cost and capex management.
Performance of business segments in 1Q22
Ferrous Minerals EBITDA of US$ 5.802 billion
• Ferrous Minerals EBITDA was US$ 578 million lower than 4Q21, mainly from lower sales
volumes for iron ore and pellets, partially compensated by higher realized prices.
• Iron ore fines average realized price was US$ 141.4/t, up US$ 34.2/t q/q, due to the US$
32.0/t higher 62% Fe reference price and US$ 3.9/t higher quality premium, reflecting the
mix of our portfolio of products and a tight supply-demand balance of high grade, low
contaminant ores in the global market.
• Vale’s C1 cash cost ex-third-party purchases increased by US$ 2.2/t q/q, mainly driven by
(i) lower fixed costs dilution due to seasonally lower volumes; (ii) negative effect of
exchange rate on costs; (iii) higher demurrage costs, due the rainy season; and (iv) higher
fuel costs, as a result of the increase in diesel price, which were partially compensated by
the consumption of inventories with lower costs and cost efficiency initiatives. Freight cost
for iron ore fines was US$ 18.1/t in 1Q22, US$ 2.7/t lower than in 4Q21, driven by a fueling
time-lagged effect on CFR sales and lower exposure to spot market in Q1.
Base Metals EBITDA was US$ 751 million in 1Q22, US$ 60 million lower than 4Q21
• Nickel business EBITDA was US$ 525 million in 1Q22, US$ 120 million higher q/q, mainly
due to the US$ 121 million effect of higher nickel realized prices, following the 33% higher
LME prices, which was partially compensated by the lag effect in pricing mechanism and
the negative results from our hedge positions.
• Copper business EBITDA was US$ 226 million in 1Q22, US$ 180 million lower q/q, mainly
due to the lower sales volumes (US$ 116 million) and higher stoppage expenses (US$ 44
million) due to the Sossego maintenance.
6Market overview
Iron Ore
Iron ore 62% Fe reference price averaged US$ 141.6/dmt in 1Q22, 29% higher than 4Q21. Along
Q1, steel production gradually increased in China while iron ore supply was limited due to
seasonal weather-related events. Iron ore prices followed the steel production growth moving
upwards in the first two months of the quarter. By the end of February, the start of the war in
Ukraine increased the price volatility on the commodities market, leading iron ore prices to new
highs in the year. While prices kept a high volatility along March, iron ore prices managed to keep
a strong level through the month.
MB65% index averaged US$ 170.19/dmt in 1Q22, 32% higher than 4Q21. With the increase in
prices along the quarter, the spread between the MB65% and the 62% iron ore reference price
recovered along in line, closing March at around US$ 25/t, driven by the increase in coal/coke
prices and the higher crude steel productivity in China, supporting the high-grade premiums.
Outlook
In the latest Short-Range Outlook, World Steel Association estimates that steel demand in the
developed economies will increase by 1.1% and 2.4% in 2022 and 2023 respectively, after
recovering by 16.5% in 2021. The emerging economies, excluding China, will continue to face
challenges from the worsening external environment, the Russia-Ukraine war, and US monetary
tightening, leading to low growth of 0.5% in 2022 and 4.5% in 2023. European car registrations
fell further in 2M22 by -13.5% YoY (February alone it was -15.7% YoY),, worsening the weak
performance of 2020 and the timid recovery in 2021. There is an accumulative effect of high
inflationary environment that is posing caution to consumer behaviour, continuous supply chain
disruptions of semiconductors and more recently disruption on supply chain of additional raw
materials coming from Ukraine. Besides, there is a boycott of several carmakers to halt or leave
production in Russia.
Shortages of natural gas and coal led to volatile prices end of 2021, which was worsened by the
war in Ukraine. Natural gas prices have reached new high records of approximately US$
60/MMBtu end of March, and it is expected to stabilize in higher levels due to restocking targets
of 90% by 1st October to prepare for the next winter. Electricity prices have also increased
dramatically, especially in countries such as Portugal and Spain leading the governments to
consider capping the cost. Analysts still expect a further increase of around 30% in energy bills
by end 2022. Steelmakers are operating EAF’s intermittently to avoid periods of peak prices. The
production costs for EAF route have increased considerably with raw materials (scrap, HBI) but
also due to electricity (from ~8% share in the production cost to ~14%).
In the USA, steel production has been flattish YoY, however pent-up demand from the automotive
sector, infrastructure and housing markets have potential to further support output. Solid demand
will keep industrial production growing in 2022 with delayed orders for factories with pandemic
fading away. Consumer confidence has been deteriorating, especially due to the high inflationary
environment which CPI came 8.5% in March (the highest in 40 years). Nevertheless, excess
savings of 13% of GDP and low levels of unemployment, most likely will give support for consumer
7spending. On the negative side, freight costs have soared since Jan22 due to high prices of
energy which will weight on consumer prices in the coming months. Since the exposure of USA
imports from Russia and Ukraine is minor, industrial production and services sector continue in a
steady recovery trajectory.
In JKT, Japanese manufacturers are seeing renewed expansion in production levels. In March
companies saw new order growth regaining some of the momentum lost in Feb as new order
growth was held back by a reduction in new export sales, which fell at the sharpest pace since
Jul20 on lower demand caused by renewed lockdown restrictions in parts of China and the
Russia-Ukraine war. Business confidence regarding output over the months ahead remained
positive on hopes that the pandemic would end and boost domestic demand, while an end to the
Russia-Ukraine war would boost international demand and stabilize price and supply pressures.
As for Brazil, high inflation is putting pressure on consumer sentiment. Automotive industry has
improved in March compared to Feb22, i.e., licensing of light vehicles increased by 10.9% and
production by 11.4%. However, the sector fell by 22.5% and 7.8% compared to March 2021,
respectively. On the positive note, industrial confidence is still on the expansionary side with 55.4
point, however, also a decrease from 55.8 points in Feb22. Construction sector is optimistic, with
confidence index for march is 55.3 points. A poor performance is expected for economic activity
in 2022, due to political instability with the upcoming elections, higher interest rates and pressing
fiscal deficits - nonetheless, GDP forecast have been recently revised up from 0.1% to 0.9% for
the year. In this context, outlook for steel production is expected to grow by 2.2% and sales to
2.5% in 2022, with strong demand in the construction sector, renewable energy infrastructure and
agricultural machinery. For automotive sector, Anfavea kept its outlook for the year, with expected
growth of 9.4% YoY, however, still -16.5% below 2019 levels.
Nickel
LME nickel prices averaged US$ 26,395/t in 1Q22, 33% higher quarter over quarter and 50%
higher than 1Q21. Due to extreme volatility brought on by Russia’s invasion of Ukraine amid a
tight nickel market and the resulting massive short squeeze, LME suspended nickel trading for
six days in March as prices rose drastically. Another six days of trading were impacted by nickel
trades hitting the daily price limit, a tool introduced by the LME in March for all base metals to
control volatility. Those days assessed at the next trading day that an official price was
published for the purposes of calculating the monthly average settlement price.
Total exchange inventories (LME and SHFE) decreased, closing at 80.1 kt at the end of 1Q22,
down 25% in the quarter and 70% year over year. LME inventories stood at 72.6 kt at the end
of 1Q22, a decrease of 29.3 kt in the quarter and 187.7 kt year over year. SHFE inventories
increased by 2.4 kt in the quarter and decreased 3.3 kt year over year.
Demand/Supply
Global sales of electric vehicles (EV) are on track to increase by 80% in 1Q22 from 1Q21,
reaching 2 million EVs sold in the quarter, led by robust growth in China as sales accelerated
up 124% despite subsidies being cut by 30% in this period. European sales are expected to
increase 35% in 1Q22 compared to 1Q21 as persistent environmental policies to reduce CO2
emissions encourage adoption. Global sales of EVs are on track to decrease by 8% in 1Q22
from 4Q21 led by seasonal declines in Europe and China. It is estimated that nickel
8consumption in battery precursors for EV and energy storage increased 129% to 88 kt in 1Q22
compared to 1Q21 and 102% quarter over quarter led by China.
Global stainless-steel production increased 15% in the first quarter when compared to 1Q21
driven by capacity additions in China and Indonesia. Quarter over quarter, global production is
set to increase 1%. Increased scrap usage, primarily in China, resulted in total nickel
consumption globally in stainless-steel to increase 14% in 1Q22 from 1Q21. Visible Chinese
stainless-steel inventories decreased 13% in 1Q22 from 1Q21 led by decreases in 200-series
stainless steel. Quarter over quarter inventories increased 34% led by increases in 300 series
stainless steel.
The aerospace industry continues to recover from pandemic lows with aircraft deliveries from
Boeing and Airbus up 18% in 1Q22 compared to 1Q21. Quarter over quarter deliveries were
down 17%. The average global commercial flights in 1Q22 were up 33% from 1Q22, however,
seasonality and the Omicron coronavirus subvariant impacted travel in 1Q22 with average
global commercial flights down 3% compared to 4Q21.
The oil and gas sector continues to rebound as demand outpaces supply and energy prices
surge, exacerbated by sanctions on Russia in response to the war in Ukraine. Oil and gas
benchmark prices were up 60% and 69%, respectively, in 1Q22 compared to 1Q21. Rig counts
were up 35% in 1Q22 compared to 1Q21 and up 8% quarter over quarter led by increases in
North America.
Nickel demand in non-stainless and non-battery applications increased 13% in 1Q22 compared
to 1Q21 and 3% quarter over quarter.
1Q22 nickel production increased 14% from 1Q21 on impressive growth in Indonesia and
increased 2% from 4Q21. Chinese NPI production decreased 10% in 1Q22, compared to 1Q21
as power cuts ahead of the Winter Olympics in Beijing reduced output. Chinese NPI production
increased by 7% in 1Q22 compared to 4Q21 as production rebounded in March on increased
supply of ore as the end of the Philippine’s rainy season approaches and environmental policies
were lifted. Indonesian NPI production increased by 22% in 1Q22 compared to 1Q21 and 7%
compared to 4Q21 as new projects continue to come online and ramp up. In February, the first
shipments of competitive battery-suitable nickel matte were reportedly successfully converted
from NPI in December 2021 and shipped to China.
Outlook
The impacts of the war on Ukraine and resulting sanctions on Russia as well as the strict
lockdowns in China due to the spread of the Omicron coronavirus variant are having various
impacts on the upstream and downstream nickel markets. These factors will continue to be
monitored but have yet to fundamentally change the outlook for the industry.
In the near term, the shift towards the electrification of the world economies will improve
demand with solid government incentives and penalty programs continuing to drive EV adoption
rates as countries commit to low emission targets. This growth potential should favor high nickel
content batteries chemistry due to its higher energy density. The North American supply chain
is particularly dependent on this market dynamic, as the commitment to green initiatives,
including the development of the EV supply chain, is forcing manufacturers to look critically at
the sustainability of upstream suppliers. In the medium term, additions to NPI and HPAL supply
planned in Indonesia may supply a large portion of the growth requirements for stainless steel
and batteries. However, environmental concerns around the CO2 intensity of NPI and the push
9for geographical diversification of the battery supply chain could result in supply shortages in
the longer term.
Our long-term outlook for nickel remains very positive, driven by strong demand in the EV sector
with the prevalence of nickel-rich batteries. Additionally, as countries continue to set aggressive
decarbonization goals, EV growth and the infrastructure needed to support them are crucial.
Markets previously heavily impacted by the pandemic, such as aerospace, are expected to
improve with the success of the global COVID-19 vaccine rollout, while energy shortages in
Europe and China are putting increased pressure on an expedited shift to renewable energy.
In the long term, the global pursuit of net-zero emissions should positively impact nickel demand
in the stainless steel, aerospace, automotive and energy markets.
Copper
LME copper prices averaged US$ 9,997/t in 1Q22, 3% higher quarter over quarter and 18%
higher than 1Q21.
Total exchange inventories (LME, SHFE, and COMEX) decreased, closing at 261.3 kt at the
end of 1Q21, up 37% in the quarter and down 34% year over year. LME inventories stood at
91.4 kt at the end of 1Q22, increasing 2.5 kt in the quarter and decreasing 53.1 kt year over
year. SHFE inventories increased by 63.9 kt in the quarter and decreased 86.3 kt year over
year. COMEX inventories increased by 4.6 kt in the quarter and 3.0 kt year over year.
Demand/Supply
Global refined copper demand increased 2% in 1Q22 compared to 1Q21 and decreased 7%
quarter over quarter, reaching 5.8 Mt in the period. The decline in comparison with last year
figures comes in the context of strong demand growth in 2021 as a result of recovery from
pandemic lows in most of the world ex-China. The first quarter of 2022 faced mixed conditions:
strong North American consumption; a strong start for Europe, stalled by the crisis in Ukraine
with subsequent disruptions in the auto industry and macro uncertainties underlying global
trade flows; and, subdued demand from China, as the country deals with Covid lockdowns and
property sector challenges for copper consumption.
Global refined copper supply increased 2% in 1Q22 compared to 1Q21 and 1% quarter over
quarter, totaling 6.2 Mt. Risks of disruption from community protests and strike action remains
high in key copper-producing countries, such as Peru and Chile, whereas current price levels
could boost production from current operations. Smelter maintenance programs and growth in
concentrate supply have resulted in continued increased in spot treatment and refining charges
(TC/RCs), up 22% in the quarter and 163% from 1Q21.
Outlook
In the near term the refined market is expected to be balanced and move into a surplus as
projects come online. In the medium term, the accelerated transition towards copper-intensive
sustainable energy will support copper demand which, alongside supply-side risks – such as
depletion, disruption, potential increases of taxation/royalties and the significant quantity of
assets required to replace existing operations – are likely to bring the market back to balance
and, eventually, deficit.
10Our long-term outlook for copper remains very positive. Copper has a solid long-term growth
profile driven by industrialization, construction, and the buildout of electrical network
infrastructure. Governments globally have set ambitious decarbonization targets that, coupled
with falling costs of renewable energy and stimulus investments in the green economy, will pivot
towards more copper-intensive uses in renewable energy and transportation projects related to
EVs. Additionally, in view of the current concerns related to energy prices, copper is favored in
lieu of energy-intensive aluminum, one of the few potential substitutes in various copper
applications. With higher aluminum price levels, there is lower incentive to move away from
copper. On the supply side, we expect growth to continue to struggle given declining ore grades,
disruption potential in key jurisdictions and the lack of significant discoveries.
11Adjusted EBITDA
Adjusted EBITDA
US$ million 1Q22 4Q21 1Q21
Net operating revenues 10,812 13,105 12,553
COGS (4,622) (6,494) (4,298)
SG&A (121) (131) (104)
Research and development (121) (177) (98)
Pre-operating and stoppage expenses (154) (147) (145)
Expenses related to Brumadinho event & de-characterization of dams (160) (2,115) (115)
Expenses related to COVID-19 donations - (16) (2)
Other operational expenses (106) (263) (13)
Dividends received from associates and JVs - 142 -
Adjusted EBIT from continuing operations 5,528 3,904 7,778
Depreciation, amortization & depletion 686 822 731
Adjusted EBITDA from continuing operations 6,214 4,726 8,509
Proforma Adjusted EBITDA from continuing operations¹ 6,374 6,857 8,626
Discontinued operations - Coal 171 102 (159)
Adjusted EBITDA total 6,385 4,828 8,350
Proforma Adjusted EBITDA total¹ 6,545 6,959 8,467
¹ Excluding expenses related to Brumadinho and COVID-19 donations.
Proforma Adjusted EBITDA from continuing operations, by business area
US$ million 1Q22 4Q21 1Q21
Ferrous Minerals 5,802 6,380 7,777
Iron ore fines 4,934 5,145 6,886
Pellets 837 1,211 840
Other Ferrous Minerals 31 24 51
Base Metals 751 811 1,011
Nickel 525 405 642
Copper 226 406 369
Others (179) (334) (162)
Total 6,374 6,857 8,626
Net operating revenue by business area
US$ million 1Q22 % 4Q21 % 1Q21 %
Ferrous Minerals 8,734 80.8% 10,769 82.2% 10,411 82.9%
Iron ore fines 7,255 67.1% 8,764 66.9% 9,060 72.2%
ROM 23 0.2% 8 0.1% 24 0.2%
Pellets 1,364 12.6% 1,889.0 14.4% 1,208 9.6%
Manganese ore 12 0.1% 5 0.0% 29 0.2%
Ferroalloys 3 0.0% 27 0.2% 17 0.1%
Others 77 0.7% 76 0.6% 73 0.6%
Base Metals 1,932 17.9% 2,224 17.0% 1,988 15.8%
Nickel 866 8.0% 851 6.5% 846 6.7%
Copper 534 4.9% 749 5.7% 670 5.3%
PGMs 110 1.0% 64 0.5% 183 1.5%
Gold as by-product 115 1.1% 138 1.1% 135 1.1%
Silver as by-product 8 0.1% 8 0.1% 8 0.1%
Cobalt 32 0.3% 31 0.2% 19 0.2%
Others1 267 2.5% 383 2.9% 127 1.0%
Others 146 1.4% 112 0.9% 154 1.2%
Total of continuing operations 10,812 100.0 13,105 100.0 12,553 100.0
1 Includes marketing activities
12COGS by business segment
US$ million 1Q22 % 4Q21 % 1Q21 %
Ferrous Minerals 3,108 67.2 4,721 72.7 2,857 66.5
Base Metals 1,334 28.9 1,580 24.3 1,188 27.6
Others 180 3.9 193 3.0 253 5.9
Total COGS of continuing operations¹ 4,622 100.0 6,494 100.0 4,298 100.0
Depreciation 645 783 688
COGS of continuing operations, ex-depreciation 3,977 5,711 3,610
¹ COGS currency exposure in 1Q22 was as follows: 46.7% USD, 46.7% BRL, 6.4% CAD and 0.2% Other currencies.
Operating expenses
US$ million 1Q22 4Q21 1Q21
SG&A 121 131 104
Administrative 103 116 87
Personnel 54 42 47
Services 23 39 17
Depreciation 11 12 9
Others 15 23 14
Selling 18 15 17
R&D 121 177 98
Pre-operating and stoppage expenses 154 147 145
Expenses related to Brumadinho event and de-characterization of dams 160 2,115 115
Expenses related to COVID-19 donations - 16 2
Other operating expenses 106 263 13
Total operating expenses 662 2,849 477
Depreciation 41 39 43
Operating expenses, ex-depreciation 621 2,810 434
Cost Efficiency Program
Cost efficiency is one of our key strategic priorities. Given the continuous acceleration of
industry-wide inflationary pressure, thus increasing operating costs, we see our program as
even more relevant today than when it was announced, in December 2021.
Our key objective for 2022 is to keep our total fixed costs plus sustaining investments flat
compared to 2021(excluding exchange rate variation), by implementing initiatives that will offset
the industry-wide inflationary.
We have already identified a series of initiatives to deliver on this goal, such as (i) the redesign
of the organizational structure, pursuing a leaner and more functional structure; (ii)
improvements in strategic sourcing, reviewing scope and specification; (iii) overhead
optimization, and (iv) implementation of digital solutions to drive productivity gains.
13Impact of Brumadinho and De-characterization in 1Q22
Provisions FX and Provisions
EBITDA
US$ million balance Payments other balance
impact
31dez21 adjustments2 31mar22
De-characterization 3,523 37 (69) 584 4,075
Agreements & donations¹ 3,537 - (64) 719 4,192
Total Provisions 7,060 37 (133) 1,303 8,267
Incurred Expenses - 123 (123) - -
Total 7,060 160 (256) 1,303 8,267
¹ Includes Integral Reparation Agreement, individual, labor and emergency indemnifications, tailing removal and containment works.
2 Includes foreign exchange, present value and other adjustments
Impact of Brumadinho and De-characterization from 2019 until 1Q22
Provisions
EBITDA PV & FX
US$ million Payments balance
impact adjustment ²
31mar22
De-characterization 5,003 (858) (70) 4,075
Agreements & donations¹ 8,257 (3,972) (93) 4,192
Total Provisions 13,260 (4,830) (163) 8,267
Incurred expenses 2,013 (2,013) - -
Others 122 - - -
Total 15,395 (6,843) (163) 8,267
¹ Includes Integral Reparation Agreement, individual, labor and emergency indemnifications, tailing removal and containment works.
² Includes foreign exchange, present value and other adjustments
The aggregate amount of the provisions increased by US$ 1.207 billion to US$ 8.267 billion,
mainly due to the effect of the Brazilian Real appreciation of 15 % in the quarter.
14Pre-operating and stoppage expenses breakdown
US$ million 1Q22 4Q21 1Q21
Pre-operating and stoppage expenses 154 147 145
Depreciation 30 25 34
Pre-operating and stoppage expenses, ex-depreciation 124 122 111
Brumadinho - stoppage expenses 80 98 85
Minas Centrais Complex (Brucutu and others) 26 14 22
Mariana Complex (Alegria, Timbopeba and others) 1 1 3
Paraopeba Complex (Mutuca, Fábrica¹ and others) 31 46 35
Vargem Grande Complex (Vargem Grande¹, Pico and others) 22 37 25
Tubarão pellet plants 5 6 7
Others 39 18 19
¹ Including pelletizing plants.
15Net income
Reconciliation of proforma EBITDA to net income
US$ million 1Q22 4Q21 1Q21
EBITDA Proforma 6,545 6,959 8,467
Brumadinho event and de-characterization of dams & COVID-19 donations (160) (2,131) (117)
EBITDA Coal (Discontinued operation) (171) (102) 159
Adjusted EBITDA from continuing operations 6,214 4,726 8,509
Impairment & disposal of non-current assets 1,075 (205) (117)
Dividends received from associates & JVs - (142) -
Equity results 186 (1,010) (13)
Financial results (242) 3,158 (78)
Income taxes (2,091) (353) (1,810)
Depreciation, depletion & amortization (686) (822) (731)
Net income from continuing operations attributable to Vale's stockholders 4,456 5,352 5,760
Net income from discontinued operations attributable to Vale's stockholders 2 75 (214)
Net income attributable to Vale's stockholders 4,458 5,427 5,546
Main factors that affected net income for 1Q22 vs. 4Q21
US$
million
4Q21 Net income from continuing
operations attributable to Vale's 5,352
stockholders
Caused mainly by the lower sales of iron ore fines and
pellets, mostly offset by better realized prices for iron ore,
EBITDA proforma -414
reflecting the $32/t higher reference price and higher
quality premiums.
Brumadinho event and de-characterization Additional provision for the de-characterization of
+1,971
of dams & COVID-19 donations upstream dams of US$1.7bn in 4Q21.
EBITDA Coal (Discontinued operation) -69
Impairment & disposal of non-current Binding agreement to divest our iron ore, manganese ore
+1,280
assets and logistics assets in the Midwestern System
Dividends received +142
Additional Renova Foundation provision in 4Q21
Equity results +1,196
(US$1.1bn)
Reclassification of cumulative foreign exchange
Financial results -3,400
variation in equity in 4Q21 (US$3.2bn)
Tax regime effect as our monthly income tax is calculated
Income taxes -1,738 based on revenues and any necessary adjustment is
made in the first quarter of the following year.
Depreciation, depletion & amortization +136
1Q22 Net income from continuing
operations attributable to Vale's 4,456
stockholders
: difference between 1Q22 and 4Q21 figures
Financial results
US$ million 1Q22 4Q21 1Q21
Financial expenses (445) (23) (1,364)
Gross interest (161) (168) (188)
Capitalization of interest 14 15 16
Shareholder debentures (249) 393 (983)
Others (17) (243) (202)
Financial expenses (REFIS) (32) (20) (7)
Financial income 150 113 58
Derivatives¹ 861 18 (439)
Currency and interest rate swaps 863 7 (482)
Others (commodities, etc) (2) 11 43
Foreign Exchange (817) 3,280 1,445
Monetary variation 9 (230) 222
Financial result, net (242) 3,158 (78)
¹ The cash effect of the derivatives was a loss of US$ 76 million in 1Q22.
16CAPEX
Investments in 1Q22 totaled US$ 1.136 billion, comprising US$ 799 million in the maintenance
of operations and US$ 337 million in project execution.
Project Execution and Sustaining by business area
US$ million 1Q22 % 4Q21 % 1Q21 %
Ferrous Minerals 681 59.9 1,042 59.5 607 61.9
Base Metals 337 29.7 639 36.5 359 36.6
Energy and others 118 10.4 70 4.0 14 1.4
Total 1,136 100.0 1,751 100.0 980 100.0
Growth projects execution
Investments in project execution totaled US$ 337 million in 1Q22, in line with 4Q21, driven by
higher solar photovoltaic panels acquisition in Sol do Cerrado project, which was partially offset
by lower disbursements in Salobo in line with project plan.
In Salobo III, a remediation plan is being executed following the landslide occurred in January.
This work includes the replacement of the damaged conveyor equipment which will be
concluded in May. We do not foresee the impacts of this event modifying the project delivery
date beyond 4Q22.
Project execution by business area
US$ million 1Q22 % 4Q21 % 1Q21 %
Ferrous Minerals 182 54.0 200 56.8 82 53.9
Base Metals 67 19.9 94 26.7 68 44.7
Energy and others 88 26.1 58 16.5 2 1.3
Total 337 100.0 352 100.0 152 100.0
Main project developments in 1Q22
• The Northern System 240 Mtpy Project concluded the civil works of the reclaimer line of
the 5th product stockyard and advance on interventions in the conveyor belt.
• Serra Sul 120 Mtpy progressed on the hiring of contractors and equipment purchase, while
advances in the project’s licensing.
• The Capanema project started the execution of the staking of the secondary crushing area
and the foundations reinforcement for the tertiary crushing.
• Salobo III project progressed as planned with the mechanical completion of three of five
long distance belt conveyors, assembly of all three HPGR's (High Pressure Grinding Rolls),
good progress with the piping and instrumentation at flotation buildings, as well as the
energization of secondary substations (e.g. crushing areas).
17Growth projects progress indicator2
Executed capex Estimated capex Physical
Capacity Estimated (US$ million) (US$ million)
Projects progress
(per year) start-up1 (%)
1Q22 Total 2022 Total
Ferrous Minerals Project
Northern System
10 Mt 2H22 33 411 170 772 94%1
240 Mtpy
Capanema 18 Mt2 2H23 17 49 129 495 13%
Serra Sul 120 Mtpy3 20 Mt 1H25 78 230 390 1,502 13%
Base Metals Project
Salobo III 30-40 kt 2H22 59 721 310 1,056 90%
1
Considering mine-plant project front physical progress.
2
Capanema project adds 14 Mtpy capacity in Timbopeba site expedition in its first years.
3
The project consists of increasing the S11D mine-plant capacity by 20 Mtpy.
Sustaining CAPEX
Investments in sustaining our operations totaled US$ 799 million in 1Q22, US$ 600 million
lower than in 4Q21. Project execution tends to be seasonally slower in the first quarter, as
weather-related conditions reduce the pace of construction works at our sites and projects (e.g.
VBME).
Sustaining capex by business area
US$ million 1Q22 % 4Q21 % 1Q21 %
Ferrous Minerals 499 62.5 842 60.2 525 63.4
Base Metals 270 33.8 545 39.0 291 35.1
Nickel 226 28.3 470 33.6 266 32.1
Copper 44 5.5 75 5.4 25 3.0
Energy and others 30 3.8 12 0.9 12 1.4
Total 799 100 1,399 100 828 100
Sustaining capex by type - 1Q22
Ferrous Energy and
US$ million Base Metals Total
Minerals others
Enhancement of operations 205 146 2 353
Replacement projects 25 88 - 113
Filtration and dry stacking projects 109 - - 109
Dam management 10 3 - 13
Other investments in dams and waste dumps 35 4 - 39
Health and Safety 51 18 - 69
Social investments and environmental protection 30 6 - 36
Administrative & Others 34 5 28 67
Total 499 269 30 799
2 Pre-operating expenses were not included in the estimated capex for the year, although included in the total estimated capex
column, in line with Vale’s Board of Directors approvals. Estimated capex for the year is only reviewed once a year.
18Main project developments in 1Q22
• The Gelado project completed the assembly of the dredger skid, following start of piping in
the region, and the assembly off the gallery and mixers of tanks 03 and 04.
• In VBME project, work has continued on the powerplants, paste plant, fuel tanks and
remaining civil works. Reid Brook vertical development is progressing, increasing
ventilation to the mine. Eastern Deeps surface ore handling precast foundations and
erection of surface steel for the Reid Brook conveyor galleries are underway.
Replacement projects progress indicator
Executed capex Estimated capex Physical
Capacity Estimated (US$ million) (US$ million)
Projects progress
(per year) start-up
1Q22 Total 2022 Total (%)
Gelado 9.7 Mt 2H22 13 275 68 428 88%
Voisey’s Bay Mine
45 kt 1H211 83 1,552 575 2,690 70%
Extension
1
In 2Q21, Vale achieved the first ore production of Reid Brook deposit, the first of two underground mines to be
developed in the project. The start-up of the second deposit, Eastern Deeps, is expected by 2H22.
19Projects under evaluation and growth options
Projects Project scope / capacity Comments
Copper
• 60ktpy Cu + 115 kozpy Au as
Alemão byproduct Stage: FEL3 / Invest decision: 2023
• Underground mine
Cristalino
• 80ktpy
• Replacement project. Maintain Stage: FEL3
Sossego plant operating at full
capacity
Bacaba:
South Hub life of mine • 60 - 70 ktpy Cu
extension or Upsides • Open Pit mine Stage: FEL3
• Replacement or optionality to
increase production
118, Visconde and Barão:
• Satellite deposits being developed to
Stage: FEL 1 / 2 (Barão)
assess potential options to increase
production
• 70-100ktpy Cu potential in North Hub
North Hub Stage: FEL 1
• Growth Project
• +30ktpy potential Stage: FEL1
Salobo IV
• Growth project
JV partnership under discussion
Victor • 20ktpy Cu + 4ktpy Ni
Stage: FEL2
• +300-350ktpy1 Cu potential + 200koz
Au
Hu’u Stage: FEL2
• Underground block cave
• Growth Project
Nickel
• +50 yrs LoM
Onça Puma 2nd furnace Stage: FEL3 / Invest decision: 2022
• +12 - 15ktpy Ni
• 20-year mine saprolite ore Mine owned by PTVI, FeNi plant owned
Bahodopi • RKEF FeNi smelter plant through JV
• Production: 70ktpy Ni Stage: FEL3 / Invest decision: 2022
• 30-year mine limonite and saprolite
ore Mine owned by PTVI, HPAL plant owned
Pomalaa • HPAL plant through JV
• Production: 40ktpy Ni + 4ktpy Co as Stage: FEL3 / Invest decision: 2022
byproduct
• Replacement
CCM PH 3&4 Stage: FEL2
• Underground mine
Thompson Mine Extension • Life extension
Stage: FEL2
PH2 • Underground mine
Iron ore
• Replacement project of 50 Mtpy of Stage: FEL3 / Invest decision: 2023
Serra Norte N1/N2
ROM in Serra Norte. Start-up: 2026
• Plants in Oman, Fábrica and
Stage: FEL2/3 / Invest decision: 2022/23
New Steel plants Fazendão
Start-up: 2024/26
• Capacity: 17 Mtpy2
• Growth project Stage: FEL2 / Invest decision: 2022
Serra Leste expansion
• Project’s capacity under evaluation Start-up: 2026
• Expand Serra Sul to ore body C due
S11C to S11D depletion. Stage: FEL2
• Replacement project.
• 3 plants under construction (7 Mtpy
capacity) Stage: FEL3 (two plants) / Invest
Briquetting plants
• 7 other plants under engineering decision: 2022/2026
stage
1 Considering full equity in Sumbawa Timur Mining and based on initial studies arising from the ongoing prefeasibility study.
2 Including 8.5 Mtpy of Oman project, which is expected to improve pellet feed quality to supply direct reduction plants production.
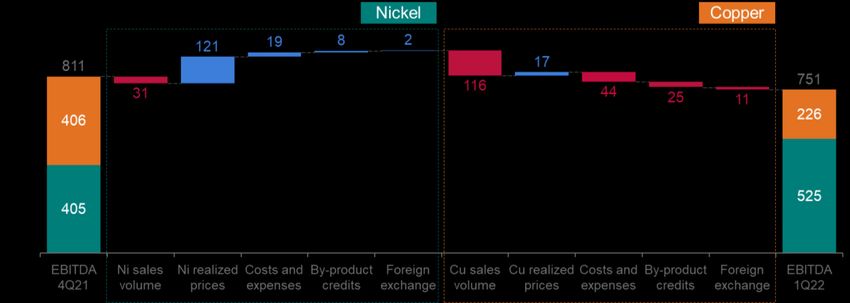
20Free cash flow
Free cash flow from operations reached US$ 1.229 billion in 1Q22, US$ 1.404 higher than in
4Q21, mainly explained by (i) a lower impact of working capital (US$ 1.5 billion); (ii) smaller
payments related to Brumadinho obligations (US$ 1.2 billion), and (iii) lower capital
expenditures (US$ 0.6 billion). Those effects were partially compensated by seasonally higher
income tax paid at the beginning of the year (US$ 1.6 billion), considering the difference
between the taxes collected throughout the year and the tax due at the end of the year.
Working capital in the quarter was mainly impacted by a decrease in accounts payables given
the usual payments to suppliers following higher production and investments in 4Q21 and
disbursements related to profit sharing in the first quarter, combined with the increase in
inventories balance due to higher average iron ore costs. Such effects were partially offset by
the decrease in accounts receivables expected in the first quarter with the strong cash collection
of 4Q21 sales.
In 1Q22, Vale distributed US$ 3.480 billion to shareholders and repurchased US$ 1.788 billion
of its shares. Vale also received US$ 502 million with the sale of its share in CSI. Cash & cash
equivalents position decreased by US$ 3.507 billion in the quarter.
Free Cash Flow 1Q22
21Debt
Net debt was US$ 4.9 billion as of March 31, 2022, US$ 3.0 billion higher q/q, mainly due to a
$4.7 billion cash outflow in dividends distribution (US$ 3.5 billion) and share buyback (US$ 1.8
billion).
Expanded net debt increased to US$ 19.4 billion, US$ 4.3 billion higher q/q, from the higher net
debt and the US$ 2.2 billion effect of Brazilian reais appreciation on the local currency
denominated commitments, which was partially offset by higher interest rates. This was partially
offset by mark-to-market gains in foreign exchange hedge positions (US$ 762 million).
The average debt maturity was 8.5 years, slightly lower than the 8.7 years on December 31,
2021. After currency and interest rate swaps, the average cost of debt was 4.89% per annum.
Debt indicators
US$ million 1Q22 4Q21 1Q21
Gross debt ¹ 12,349 12,180 12,176
Lease (IFRS 16) 1,666 1,602 1,631
Gross debt and leases 14,015 13,782 13,807
Cash, cash equivalents and short-term investments 9,104 11,905 14,312
Net debt 4,911 1,877 (505)
Currency swaps² (89) 724 1,077
Refis 2,634 2,288 2,432
Brumadinho provisions 4,192 3,537 4,014
De-characterization provisions 4,075 3,523 1,962
Samarco & Renova Foundation provisions 3,649 3,112 1,732
Expanded net debt 19,372 15,061 10,712
Total debt / adjusted LTM EBITDA (x) 0.5 0.4 0.6
Net debt / adjusted LTM EBITDA (x) 0.17 0.06 (0.02)
Adjusted LTM EBITDA / LTM gross interest (x) 46.5 48.1 28.0
¹ Does not include leases (IFRS 16).
² Includes interest rate swaps.
22Performance of the business segments
Segment information ― 1Q22, as per footnote of financial statements
Expenses
Dividends
Net SG&A Pre received
Adjusted
US$ million operating Cost¹ and R&D¹ operating & from
EBITDA
revenues others¹ stoppage¹ associates
and JVs
Ferrous Minerals 8,734 (2,723) (52) (36) (121) - 5,802
Iron ore fines 7,255 (2,119) (55) (34) (113) - 4,934
Pellets 1,364 (526) 5 (1) (5) - 837
Others ferrous 100 (63) - - (1) - 36
Mn & Alloys 15 (15) (2) (1) (2) - (5)
Base Metals 1,932 (1,136) (2) (41) (2) - 751
Nickel² 1,458 (909) (8) (16) - - 525
Copper³ 474 (227) 6 (25) (2) - 226
Brumadinho event and
- - (160) - - - (160)
de-characterization of dams
Others 146 (118) (162) (44) (1) - (179)
Total of continuing operations 10,812 (3,977) (376) (121) (124) - 6,214
Discontinued operations - Coal 448 (264) (12) (1) - - 171
Total 11,260 (4,241) (388) (122) (124) - 6,385
¹ Excluding depreciation, depletion and amortization.
² Including copper, by-products from our nickel operations and marketing activities.
³ Including by-products from our copper operations.
23Ferrous Minerals
Ferrous Minerals adjusted EBITDA totaled US$ 5.802 billion in 1Q22, down 9% q/q, driven by
seasonally lower sales volumes for iron ore fines and pellets, which were partially compensated
by higher realized prices, supported by stronger benchmark prices and premiums.
The adjusted EBITDA per ton for Ferrous Minerals, excluding Manganese and Ferroalloys,
totaled US$ 97.8/t, an increase of US$ 29.0/t compared to 4Q21.
On April 6th, Vale announced a binding agreement to sell the Midwestern System in line with its
strategy of portfolio simplification. The completion of the transaction is subject to regulatory
approvals and compliance with the usual precedent conditions. The Midwestern System are
reported in Others segment and previous quarters Ferrous Minerals results were adjusted
accordingly.
Ferrous Minerals EBITDA variation – US$ million (1Q22 x 4Q21)
The share of premium products in total sales was 84% in 1Q22, in line with 4Q21.
Iron ore premium reached US$ 9.1/t3 in 1Q22, US$ 4.4/t higher than in 4Q21, due to (i) higher
spread of 65% Fe and low alumina ore indexes vs. 62% Fe benchmark index; and (ii) better
quality mix of products as some high silica ores are being concentrated in Chinese beneficiation
plants before the final sale. These effects were partially offset by the lagged price effect on
pellet price realization and the absence of the seasonal dividends from our pellet’s JVs.
Iron ore fines and pellets quality premium
US$/t 1Q22 4Q21 1Q21
Iron ore fines quality premium 4.4 0.5 7.0
Pellets weighted average contribution 4.7 4.2 1.4
Iron ore fines and pellets total quality premium 9.1 4.7 8.5
Share of premium products¹ (%) 84% 82% 91%
¹ Composed of pellets, Carajás (IOCJ), Brazilian Blend Fines (BRBF) and pellet feed.
3 Previously, in Production and Sales Report of 1Q22, Vale announced an iron ore premium of US$ 9.0/t, which includes Midwestern
System.
24Volume sold
‘000 metric tons 1Q22 4Q21 1Q21
Iron ore fines 51,311 81,749 57,631
ROM 1,035 607 426
Pellets 7,011 10,351 6,271
Net operating revenue by product
US$ million 1Q22 4Q21 1Q21
Iron ore fines 7,255 8,764 9,060
ROM 23 8 24
Pellets 1,364 1,889 1,208
Others 92 108 119
Total 8,734 10,769 10,411
Iron ore fines (excluding Pellets and ROM)
Iron ore fines EBITDA variation – US$ million (1Q22 x 4Q21)
Revenues and sales volumes
Iron ore fines’ net revenues of US$ 7,255 million in 1Q22 was 17% lower q/q, largely explained
by the 37% lower sales volumes in the quarter (US$ 3.2 billion), mainly due to the usual weather
seasonality in the first quarter of the year, which was partially offset by higher realized prices
(US$ 1.7 billion).
CFR sales totaled 40.5 Mt in 1Q22, representing 79% of total sales volumes in 1Q22, driven
by seasonally lower sales to Chinese customers.
Pricing system breakdown (%)
25Vale’s realized price reached US$ 141.4/t, US$ 34.20/t higher than in 4Q21 mainly due to (i)
the US$ 32.0/t increase of the 62% Fe reference price, and also (ii) the positive effect of the
adjustments of sales from previous quarter (US$ 13.9/t); and (iii) higher premiums (US$ 3.9/t);
which were partially offset by (i) the negative effect of lagged price sales (US$ 11.5/t), which
represented a seasonally larger share in Q1 ; (ii) the increase of FOB sales share (US$ 2.3/t);
and (iii) the natural moisture adjustment (US$ 1.9/t), which is an effect of higher prices.
Price realization iron ore fines – US$/t, 1Q22
Average prices
US$/ metric ton 1Q22 4Q21 1Q21
Iron ore - Metal Bulletin 65% index 170.2 128.8 191.2
Iron ore - Metal Bulletin 62% low alumina index 146.6 111.8 167.9
Iron ore - 62% Fe reference price 141.6 109.6 166.9
Provisional price at the end of the quarter 158.1 120.3 159.9
Iron ore fines Vale CFR reference (dmt) 156.2 120.3 166.4
Iron ore fines Vale CFR/FOB realized price 141.4 107.2 157.2
Pellets CFR/FOB (wmt) 194.6 182.6 192.6
Costs
Iron ore COGS - 4Q21 x 1Q22
Variance drivers
Exchange Total
US$ million 4Q21 Volume Others 1Q22
rate variation
C1 cash costs 1,488 (580) 66 114 (400) 1,088
Freight 1,498 (655) - (110) (765) 733
Distribution costs 88 (32) - 31 (1) 87
Royalties & others 362 (135) 1 (17) (151) 211
Total costs before
depreciation and 3,436 (1,402) 67 18 (1,317) 2,119
amortization
Depreciation 339 (128) 3 43 (82) 257
Total 3,775 (1,530) 70 61 (1,399) 2,376
26Vale’s C1 cash cost ex-third-party purchases increased by US$ 2.2/t q/q, mainly driven by (i)
lower fixed costs dilution due to seasonally lower volumes; (ii) negative effect of exchange rate
on costs; (iii) higher demurrage costs, due the rainy season; and (iv) higher fuel costs, as a
result of the increase in diesel price, which were partially compensated by the consumption of
inventories with lower costs and cost efficiency initiatives. Vale expects C1 costs ex-third-party
purchases for 2022 to total US$ 18.5-19.0/t (vs. US$ 16.5/t in 2021) mainly due an appreciation
of BRL FX to 5.0, and an increase in oil brent to US$100/bbl.
C1 cash cost variation (excluding 3 rd party purchases) – US$/t (1Q22 x 4Q21)
Vale’s C1 cash cost totaled US$ 21.2/t, an increase of US$ 3.0/t vs. 4Q21.
Vale's unit maritime freight cost was US$ 18.1/t in 1Q22, US$ 2.7/t lower than in 4Q21, driven
by a fueling time-lagged effect on CFR sales and lower exposure to spot market in Q1. Vale
expects an increase of freight costs in 2Q22 driven by the recent hikes of brent oil price globally.
Iron ore fines cash cost and freight
1Q22 4Q21 1Q21
Costs (US$ million)
Vale’s iron ore fines C1 cash cost (A) 1,088 1,488 983
Third-party purchase costs¹ (B) 181 194 198
Vale’s C1 cash cost ex-third-party volumes (C = A – B) 907 1,294 786
Sales volumes (Mt)
Volume sold (ex-ROM) (D) 51.3 81.7 57.6
Volume sold from third-party purchases (E) 2.7 3.2 2.8
Volume sold from own operations (F = D – E) 48.6 78.5 54.8
Iron ore fines cash cost (ex-ROM, ex-royalties), FOB (US$ /t)
Vale’s C1 cash cost ex-third-party purchase cost (C/F) 18.7 16.5 14.3
Average third-party purchase C1 cash cost (B/E) 67.0 61.6 70.8
Vale's iron ore cash cost (A/D) 21.2 18.2 17.1
Freight
Maritime freight costs (G) 733 1,498 735
% of CFR sales (H) 79% 88% 81%
Volume CFR (Mt) (I = D x H) 40.5 71.9 46.9
Vale's iron ore unit freight cost (US$/t) (G/I) 18.1 20.8 15.7
¹ Includes logistics costs related to third-party purchases.
27You can also read