Validation of Molecular Markers Linked to Fusarium Wilt Resistance in Recombinant Inbred Lines of Chickpea (Cicer arietinum L.)
←
→
Page content transcription
If your browser does not render page correctly, please read the page content below

Validation of Molecular Markers Linked to Fusarium
Wilt Resistance in Recombinant Inbred Lines of
Chickpea (Cicer arietinum L.)
Dalpat Lal ( dalpat032@gmail.com )
Jagan Nath University https://orcid.org/0000-0003-1141-0067
Rampura Lakshmipathi Ravikumar
University of Agricultural Sciences
Pavankumar Jingade
Coffee Board of India
Sunil Subramanya
University of Agricultural Sciences
Research Article
Keywords: Chickpea, Fusarium wilt, Molecular markers, Validation
Posted Date: April 21st, 2021
DOI: https://doi.org/10.21203/rs.3.rs-366182/v1
License: This work is licensed under a Creative Commons Attribution 4.0 International License.
Read Full License
Page 1/19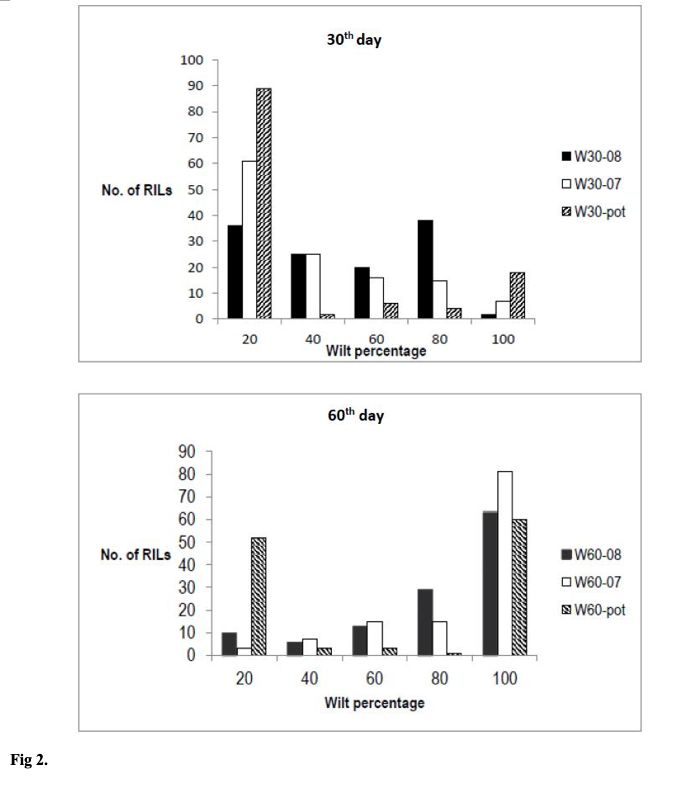
Abstract
Molecular markers closely linked to Fusarium wilt resistance in chickpea were identified from earlier
studies with an objective to validate them. The recombinant inbred line (RIL) mapping population (F11)
derived from JG62 (FW susceptible) and WR315 (FW resistant) was used for validation of linked markers.
The RILs were phenotyped for FW resistance over two seasons in a wilt sick field at ICRISAT and in wilt
sick pots under the green house condition. A total of 42 markers linked to Fusarium wilt (FW) resistance
in chickpea were selected from earlier reports for validation. Among 42 markers selected 23 markers were
polymorphic among the parental lines of RIL population and hence these markers were used for
genotyping the mapping population. The genotyping data together with phenotyping data over two
seasons and wilt sick pots identified 12 markers linked to wilt resistance by single marker analysis. The
markers TA96, CS27, TA110 and TA59 were more consistently related to FW resistance in this and
previous studies. The composite interval mapping has identified two major loci; one each in LG1 and LG2
flanked by markers H4G11 and CaM1402 and H3A12 and CS27, respectively. These two loci are
considered as major loci for FW resistance explaining up to 76.66% of phenotypic variation for FW
resistance. The results presented here and those published earlier confirm the emerging picture of two
hotspots in chickpea genome for resistance to Fusarium wilt. The QTL flanking markers, H4G11,
CaM1402, CS27, and H3A12 are most promising and reliable for deployment in chickpea breeding.

Introduction
Chickpea (Cicer arietinum L.), is the second most important cool season legume crop of the world,
belongs to the family Fabaceae and sub family Faboideae. It is a self-pollinated and diploid (2n = 2x =
16) pulse with a genome size of 740 Mb (Jingade and Ravikumar 2015). Chickpea seeds are important
source of protein, vitamins and essential minerals for human diet and the crop enhances soil fertility by
fixing atmospheric nitrogen through symbiotic association. The cultivated chickpea is often divided into
two types: Desi and Kabuli. Desi chickpea (purple flower, small, dark and angular seeds) are mainly grown
in the Indian subcontinent, East Africa, Central Asia and to a limited extent in Mediterranean basin
whereas; Kabuli chickpea (white flower, large and cream-coloured seeds) have traditionally been grown in
the Mediterranean basin and Central Asia (Karami et al. 2015).

One of the major constraint in chickpea production is the Fusarium wilt (FW) caused by the
deuteromycetes fungal pathogen Fusarium oxysporum f. sp. ciceri (Foc). The disease is wide spread in
chickpea growing areas of the world (Dubey et al. 2007). In India the annual yield loss to wilt disease
varies from 10-15% under normal conditions (Jalali and Chand 1992) to nearly 100% when conditions are
favourable for pathogen development (Jimenez-Diaz et al. 1993). Eight different physiological races of
Foc are characterised based on disease severity symptoms on different chickpea cultivars. Races 0 and
1B/C cause a yellowing symptoms and races 1A, 2, 3, 4, 5 and 6 induce a wilting symptom (Sharma et al.
2005; Jimenez-Fernandez et al. 2013). Four out of these eight reported races have significant presence in
India race 1 (synonymous 1A, Indian isolate) in Peninsular India, races 2 and 3 in North India, and race 4
in Central India (Singh et al. 2008; Pande et al. 2007). The pathogen is a soil-borne therefore, the
                                                 Page 2/19
agronomic and plant protection measures are not very effective in controlling the disease incidences.
Rather cultivation of varieties possessing resistance to specific races of the pathogen prevalent in a
region is the most economical management strategy for this disease (Arvayo-ortiz et al. 2012). Even
though high level of resistance to Foc race 1A is available in the cultivated species, the progress in the
introgression of resistance to elite varieties is very slow owing to the difficulty in the identification and
selection of wilt resistant genotypes in the breeding populations. To overcome such problems, molecular
breeding strategies have been successfully deployed in several crop species. Therefore, the QTL based
marker-assisted selection (MAS) appears one of the efficient strategies to accelerate pyramiding of
different resistance genes for FW resistance in chickpea.
So far there have been several attempts to map quantitative trait loci (QTLs) and their flanking regions for
different Foc races. Mayer et al. (1997) was the first to report allele and locus specific molecular markers
linked to FW resistance in chickpea. Later, several markers linked to FW resistance have been reported
(Winter et al. 2000; Sharma et al. 2004; Gowda et al. 2009; Castro et al. 2010; Barman et al. 2014; Jingade
and Ravikumar 2015) and most of them are distributed on linkage group 2 (LG2) of reference map
(Winter et al. 2000). Markers flanking loci Foc 0 (OPJ20600 and TR59), Foc 1 (TA110 and H3A12), Foc 2
(H3A12 and TA96), Foc 3 (TA96 and TA194), Foc 4 (TA96 and CS27) and Foc 5 (TA59 and TA96)
determining resistance to races 0 (Cobos et al. 2005), 1 (Gowda et al. 2009), 2 (Gowda et al. 2009); 3
(Sharma et al. 2004; Gowda et al. 2009); 4 (Winter et al. 2000; Sharma et al. 2004; Sharma et al. 2005)
and 5 (Cobos et al. 2009) respectively were also reported. A cluster of resistance genes for several FW
races (Foc 1-5) are located on LG2 of the chickpea map. However, QTLs identified for FW resistance to
date were derived from mapping studies with limited population size and low density molecular maps.
Furthermore, the identified QTLs were not validated in different seasons and genetic backgrounds
potentially limiting their utility as most of the markers are not functional in different genetic backgrounds.
Another factor confounding the FW resistance is temporal variation in response to FW resistance among
chickpea genotypes. Some susceptible genotypes exhibit late wilting against different Foc races
(Upadhyaya et al. 1983a, b; Singh et al. 1987). For example, based on the genetics of resistance to FW
race 1, even though the resistance was governed by 2-3 major genes, any one of these genes alone can
cause late wilting (Sharma et al. 2005; Brinda and Ravikumar 2005). A combination of two genes in
recessive form confers complete resistance, while one of these genes in recessive form produce late
wilting (Castro et al. 2010). Despite the importance of early and late wilting responses among chickpea
genotypes, so far only limited attempts have been made to identify QTLs influencing the two distinct
resistance types (Jingade and Ravikumar 2015). Towards this direction, it is important to further confirm
the linked markers in different genetic background to prove their efficiency to characterize susceptible
and resistance chickpea genotypes. Thus, the present study was undertaken with an objective to validate
previous reported QTLs in a set of recombinant inbred lines (RILs) developed from intraspecific cross
between highly susceptible JG62 and resistant WR315, segregating for resistance to Foc race1
genotypes. This information will aid chickpea breeders in selecting markers for use in MAS and gene
pyramiding to enhance the wilt resistance.
Page 3/19Material And Methods
Plant materials
One hundred and twenty five F10 derived F11 RILs from intraspecific cross between JG62 and WR315
were used in study. The female parent JG62 is an early wilting genotype highly susceptible to Foc race 1,
while WR315 is resistant to race 1A, race 2, race 3, race 4 and race 5 of FW (Mayer et al. 1997; Sharma et
al., 2005). The mapping population (RILs) was developed by single seed descent method.
Phenotyping
The 125 RILs were tested for FW race 1 reaction in wilt sick pots under the green house conditions during
the year 2015 at Department of Plant Biotechnology, UAS, Bengaluru and in wilt sick field over two years
2007-08 and 2008-09 rabi seasons at International Crop Research Institute for Semi-Arid Tropics
(ICRISAT), Hyderabad, India.
Screening RILs for FW resistance in wilt sick pot
The wilt sick pots were developed according to Brinda and Ravikumar (2005) using Foc race 1 inoculum
obtained from ICRISAT, Hyderabad. The presence of pathogen in the pots was confirmed by growing the
susceptible JG62 plants (6 plants per pot) and observing wilting symptoms and death before 30 days.
Only the pots in which all the 6 plants wilted within 30 days were used for evaluation of RILs (F11). Six
seeds of each RIL were sown in a single pot along with one seed of JG62 (susceptible check in the
centre). The pots were regularly watered and the number of plants showing wilt symptoms followed by
death in each pot was recorded on 30th and 60th day after sowing (Barman et al. 2014). All the
experimental pots the susceptible check JG62 showed wilting within 30 days (Figure 1). For each RIL, the
percent wilt incidence was measured on the basis of number of wilted plants to the total number of
plants in each pot as given below-
Screening for FW resistance in the field
The F7 and F8 RILs were also screened for FW resistance in the wilt sick field at ICRISAT, Patancheru, India
over two years (Season I: 2007-08 and Season II: 2008-09) in two replications using randomised
complete block design. Each RIL was sown in single rows of two-meter length with two replications
during 2007-2008 along with parents were repeated after every twenty rows in each replication.
Observations for disease incidence were recorded on 30th and 60th day after sowing (DAS) by observing
individual plants for wilting (Haware et al. 1992). The wilt incidence was measured on the basis number
of plants wilted and total number of plants in each row as mentioned above.
Page 4/19Genotyping
DNA extraction and PCR amplification
The genomic DNA was extracted from vegetative buds and young leaves of RILs and parental lines by
CTAB method of DNA extraction with slight modifications (Doyle and Doyle 1990). The isolated DNA was
quantified by nanodrop (Eppendorf Bio-spectrometer). Forty two markers linked to FW resistance
previously (Mayer et al. 1997; Winter et al. 2000; Sharma et al. 2004; Cobos et al. 2005; Radhika et al,
2007; Gowda et al. 2009; Millan et al. 2010; Soregaon 2011; Sabbavarapu et al. 2013; Barman et al. 2014;
Jingade and Ravikumar 2015) were selected for the present study. The parental lines were screened for
polymorphism and 23 markers were found to be polymorphic which were used for genotyping of all the
125 RILs.
The polymerase chain reaction was carried out for final volume of 10 μl reaction mixture containing 40-
50 ng/μl genomic DNA, 10X PCR buffer with 15 mM MgCl2 (M/s Bengaluru Genei Pvt. Ltd.), 200 μM
dNTPs (3B Black Bio Biotech India Ltd), 10 pM of each forward and reverse primer (Eurofins Pvt. Ltd.)
and 1 U/μl Taq DNA polymerase enzyme (M/s Bengaluru Genei Pvt. Ltd.) in thermal cycler (Mastercycler
gradient, Eppendorf, Hamburg, Germany). The PCR amplification for SSR primers was performed
according to Mayer et al. (1997) with certain modifications.
PCR products along with 5 μl of loading dye were electrophoresed on either 3.0% agarose or 7.5%
denaturing polyacrylamide gel (PAGE) in Tris-borate EDTA (TBE) running buffer. Out of 23 markers, 20
markers were resolved on 3% agarose gel and three markers on 7.5% PAGE. The resolved PCR products
were detected by ethidium bromide staining in agarose gels and by silver staining in PAGE. Gel scoring
was done by taking in to considerations banding pattern of individual RILs, and comparing with banding
pattern of parental genotypes. RILs were scored as “2” for parent JG62, “0” corresponding to parent WR
315 and “-1” for missing band.
Statistical analysis
The 23 polymorphic markers were used for genotyping the RILs and the segregation of individual markers
for goodness-of-fit to the expected Mendelian 1:1 ratio was tested by Chi-square test.
Linkage map construction
The linkage analysis was performed using ICIM QTL Ici Mapping version 4.00 software
(http://www.isbreeding.net). A minimum threshold log likelihood ratio (LOD) scores 3.0 and maximum
recombination fraction of 0.3 was set as threshold value for linkage groups (LGs) determination. ‘Ripple’
command was used after adding each marker locus to confirm marker order. Recombination frequencies
were converted into genetic distances in centimorgan (cM) using Kosambi mapping function (Kosambi
1943). Further the marker order and the linkage distances obtained were used for QTL analysis.
QTL analysis
Page 5/19The genotypic data combined with phenotypic data obtained from wilt sick pot and field experiments on
125 RILs were analysed for identification of the QTLs using ICIM. The positions and effects of QTLs for
wilt resistance in each of the stage as well as two seasons field and pot data were determined following
single-marker analysis (SMA) and composite interval mapping (CIM) (Jansen and Stam 1994). The
proportion of observed phenotypic variation explained (PVE) due to a particular QTL was estimated by
the coefficient of determination from the corresponding linear model (single marker) analysis and using
maximum likelihood for CIM (Basten et al. 1997). A minimum LOD score of 2.5 for SMA and 3.0 for CIM
was used for declaring the presence of a putative QTL.
Results
Wilt reaction for RILs
Significant differences among RILs for FW were observed on 30th and 60th days in both field and pot
testing. The susceptible JG62 recorded complete wilting in 30 days in both field and pot screenings.
Likewise, in pots the highly susceptible RILs showed complete wilting symptoms within 30 days, while
the resistant RILs did not show wilting even after pod filling stage beyond 30 days (Figure 1). The mean
wilting per cent in both field and pot screenings ranged from 0.00 – 100.00% at both times of scoring
(Figure 2). The mean wilt percentage was significantly lower on 30th day compared to 60th day in both
2007 and 2008 seasons suggesting that the RILs segregate for early and late wilting and resistance
phenotypes. Furthermore, plants in the field exhibited relatively less wilt damage compared to those
tested in pots. There was a significant correlation in the reaction of RILs to wilt in two seasons under field
conditions (Table 1). The association between field and pot screening was also positive and significant.
Development of linkage maps
Forty two markers linked to wilt resistance towards Foc races in different mapping populations were
selected for study. Among them twenty three (54.76%) markers were polymorphic in parents, JG62 and
WR315, while the remaining 19 markers were not polymorphic, hence were not used in study. The
mapping population consisting of 125 RILs were screened with the 23 polymorphic markers. The
segregation of individual markers for the expected monogenic 1:1 ratio in the RILs was tested using χ²
test. Twenty markers did not show segregation distortion from the expected ratio. However, 23 markers
were used for linkage map construction, of which 20 were mapped in to three LGs spanning a total length
of 195.26 cM with an average marker density of 9.53 cM. The length of the LG ranged from smallest
19.87 cM (LG3) to largest 102.17 cM (LG2). The number of markers mapped per LG varied from 2 (LG3)
to 11 markers (LG2). The highest marker density was observed in LG 2 with an average marker density of
9.29 cM and the lowest marker density was observed in LG 1 with an average marker density 10.46 cM
(Figure 3).
Single Marker Analysis
Page 6/19The SMA that assess the segregation of FW resistance at two stages (30th and 60th days) with respect to
a marker genotype in RILs indicated 12 markers (SSR14, H3A12, H5A08, H4G11, CS27, CaM1402, TR19,
TA59, TA110, TA96, TA200, H4E09) were associated with FW resistance across both the stages, seasons,
and field and pot experiments. In the present investigation marker having the strongest relationship was
measured using PVE% value (Table 2), which indicates the overall percentage of variability of Foc
resistance at a particular scoring time. In this study the PVE% ranged from 8.89% to 16.67% (Table
2).The FW resistance on 30th day in field was associated with two markers in LG1 and eight markers in
LG2 in season I and three markers in LG2 in season II. Two markers H4G11 and CAM1402 showed
association in both seasons. Only one marker was associated with FW resistance on 60th day in season I
and two markers in season II. In pot culture experiment three markers were associated with wilt resistance
on 30th day and four on 60th day. The marker H4G11 consistently showed linkage with wilt resistance in
both seasons and the pot experiment. The markers H3A12, H5A08 and CS27 showed stable association
in season I and the pot experiment.
QTL mapping
A total of eight QTLs (qW60-07-1-1, qW60-08-1-1, qW30-08-1-1, qW30-07-1-1, qW30-pot-1-1, qW60-pot-2-1,
qW30-07-2-1 and qW30-pot-2-1) were identified for FW resistance. Among the eight resistant QTLs, three
(qW60-pot-2-1, qW30-07-2-1, qW30-pot-2-1) were located on LG2 and remaining five were on LG1 (Figure
3; Table 3). From among eight resistant QTLs, five (three on LG1 and two on LG2) were associated with
early wilting (30th day) and three QTLS (qW60-07-1-1, qW60-08-1-1 and qW60-pot-2-1) were associated
late wilting (60th day).
Among the five early wilting resistant QTLs, two (qW30-pot-1-1 and W30-pot-2-1) were identified based on
sick pot data and three (two in 2007 rabi; qW30-07-1-1, qW30-07-2-1 and one in 2008 rabi; qW30-08-1-1)
were discovered from the field data. Between the two QTLs identified from pot experiment one QTL
(qW30-pot-1-1) flanked by markers H4G11 and SSR14 explained 11.89% of the total variation. The QTL
(qW30-pot-2-1) flanked by markers TA110 and H5A08 explained 11.62% variation. Two QTLs (qW30-07-1-
1 and qW30-08-1-1) were identified for early wilting based on 2007 and 2008 field testing data and both
of them were mapped to the same region on LG1 flanked by markers CaM1402 and H4G11 and explained
16.40% and 76.77% of the total variation respectively. Both QTLs had a positive additive effect with
contribution of favourable alleles from male parent.
Both late wilting QTLs (qW60-07-1-1 and qW60-08-1-1) identified from the field experiment across two
consecutive seasons (2007 and 2008 rabi) are located on LG1 and flanked by same pair of markers
CaM1402 and H4G11; the QTL qW60-07-1-1 had a LOD score of 3.38 while QTL qW60-08-1-1 had a LOD
score of 4.37 and explained phenotypic variation of 12.37% and 12.30% respectively. Both QTLs had a
positive additive effect with the contribution of resistance alleles from male parent. However, the QTL
(qW60-pot-2-1) for late wilting from the pot experiment is located on LG2 and flanked by markers CS27
and H3A12. The QTL had a LOD score of 5.17 and explained a phenotypic variance of 26.62% with
contribution of resistance alleles from male parent.
Page 7/19Discussion
Marker validation is referred to determining the target phenotype in independent populations and
different genetic backgrounds (Cakir et al. 2003). Marker assisted selection for disease resistance in
chickpea, like any other crops, is a two-step process. The process starts with the detection of molecular
markers linked to FW resistance and markers flanking QTLs influencing resistance. Subsequently those
markers ought to be validated in different mapping populations and genotypes, so that effectiveness of
the markers in identifying the desired genotypes can be evaluated in advance.
The current study evaluates the previously reported Foc resistance linked markers in a different mapping
population for their application. Among eight different races of Fusarium oxysporum f. sp. ciceri reported
earlier (Jimenez-Fernandez et al. 2013), races 1-4 are wide spread in India (Pande et al. 2007; Singh et al.
2008). The inheritance of resistance indicated that resistance to race 1, 2 and 4 is controlled by two or
three genes (Upadhyaya et al. 1983a, b; Brinda and Ravikumar 2005), while the race 3 is controlled by a
single gene. So also the case with race 5 (Sharma et al. 2005). However, it has been observed that the
inheritance pattern is not always clear for some races, as for example there are at least three independent
loci, H1, H2 and H3, with complex inheritance pattern reported for the race 1 (Singh et al. 1987). Besides
even involvement of many polygenes have been proposed for the observed variation and timing of wilting
(Brinda and Ravikumar 2005). To overcome the problem posed by complex inheritance pattern for the
resistance to certain races, it has been suggested that markers that are tightly linked to resistance QTL is
an effective solution in breeding programmes via MAS. Accordingly, several efforts were made previously
to identify markers that are tightly linked to FW resistance in chickpea. For example Mayer et al. (1997)
developed two allele-specific associated primer (ASAP) pairs, namely UBC170 and CS27, from RAPD
bands that were linked at 7% recombination to the locus for resistance to FW race 1. Subsequently,
several linkage maps were used to map FW resistance genes in chickpea (Winter et al. 2000; Sharma et
al. 2004; Gowda et al. 2009; Millan et al. 2010; Sabbavarapu et al. 2013; Barman et al. 2014; Jingade and
Ravikumar 2015). These studies revealed that the majority of the markers used in tagging wilt resistance
are co-dominant microsatellite markers and clustered on the LG2. Thus a consensus map of LG2 is
turned out to be a hot spot for resistance genes relating to wilt resistance for many races (Benko-Iseppon
et al. 2003; CHO et al. 2004). In addition, earlier reports also mapped a substantial number of QTLs
associated with resistance.
For the present study, the mapping population (RILs) was developed by hybridization of highly
susceptible and resistant parents producing that potentially generated a full range of variability for wilt
resistance. Out of 42 markers reported to be linked to wilt resistance, only 23 were found to be
polymorphic in the parental lines. Contrary to some of the earlier reports (Gowda et al. 2009; Millan et al.
2010; Sabbavarapu et al. 2013) we did not observe a tight linkage between nineteen markers to disease
resistance loci in our mapping population. The predictive power of the 19 markers was limited when
tested in a different set of parents/genotypes. This observed discrepancy might be because of the nature
of mapping populations used between studies. Most of the markers developed earlier were using a
specific mapping population and not all of the markers were polymorphic in the parental lines used for
Page 8/19this study. Nevertheless, these markers could be of some use for certain breeding populations even
though they are not diagnostic across genotypes.
The genetic map constructed with 23 markers consisted of 20 markers on three LGs spanning a length of
195.26 cM. Nearly 50% of the markers (11) mapped to LG2. The LGs in the present study were compared
to earlier maps with common markers and the groups agree with the earlier maps with little changes in
the order. The LG2 of the present study was same as that of LG2 reported in Gowda et al. (2009);
reference map of chickpea (Winter et al. 2000) and LG3 of Radhika et al. (2007). Two clusters of Foc
resistance to tested race 1 were observed in LG2 in the present study. The previous studies also indicated
two clusters of Foc resistance in LG2. The underlying pattern from all these studies (Winter et al. 2000;
Sharma et al. 2004; Sharma and Muehlbauer 2007; Gowda et al. 2009) including the present
investigation is that LG2 contains some of the major loci for wilt resistance and they appear to be stable
in many genotypes and mapping populations. In addition, we also identified another major locus of Foc
resistance on LG1 in this study, which is independent of the first locus (Brinda and Ravikumar 2005). The
LG1 of the present study was same as that of LG6 of Sabbavarapu et al. (2013); LG2 of Radhika et al.
(2007) and LG1 of Jingade and Ravikumar (2015). The linkage map of chickpea is generally conserved
demonstrating low level of genetic recombination and rearrangement in intraspecific crosses (Flandez-
Galvez et al. 2003). Present study could confirm and support the earlier reports (Upadhyaya et al. 1983a,
b; Singh et al. 1987), that two three major genes confer resistance to FW resistance in chickpea
The single marker analysis identified 12 markers - SSR14, H3A12, H5A08, H4G11, CS27, CaM1402, TR19,
TA59, TA110, TA96, TA200 and H4E09 – linked to wilt resistance. The markers TA96 (Sharma and
Muehlbauer 2007; Winter et al. 2000; Sharma et al. 2004; Millan et al. 2006; Millan et al. 2010; Gowda et
al. 2009); CS27 (Winter et al. 2000; Sharma et al. 2004; Soregaon and Ravikumar 2010); TA110 (Gowda et
al. 2009) and TA59 (Millan et al. 2006) which were more closely related to FW resistance in different
independent studies and genotypes showed close linkage in this study also. This consistent observed
linkage pattern across investigations is extremely useful for the breeders, who could use such markers in
their breeding programs with high degree of certainties when screening germplasm for wilt resistance.
Only exception we noted was for the marker TA27 that showed association in many studies (Winter et al.
2000; Sharma et al. 2004; Millan et al. 2006; Millan et al. 2010) did not show linkage in our re-evaluation.
Such a contradictory result in associating the marker with resistance to Foc race1 might be due to change
in genetic population (Gurjar et al. 2009).
Among the eight QTLs identified using CIM in this study, four were in the same locus in LG1 flanked by
markers H4G11 and CaM1402 and two were in the same locus in LG2 flanked by markers H3A12 and
CS27. The QTLs identified in the present study are stable and reliable as they are based on both field
testing over years and pot screening of RILs for wilt reaction and confirm the loci identified earlier. The
results presented here and those published earlier contribute to the emerging picture of two hotspots in
chickpea genome for resistance to Fusarium wilt resistance. A majority of studies (Winter et al. 2000;
Sharma et al. 2004; Millan et al. 2006; Millan et al. 2010), including ours, consider the two loci as major
resistance loci with a PVE (%) values ranging from 12.36 to 76.76. Two additional QTLs identified in this
Page 9/19study were purely based on a pot experiment, it has to be confirmed and validated in the future in
replicated field experiments.
Present study could confirm and validate several earlier findings about the nature and strength of linkage
between genetic markers and wilt resistant loci in chickpea, thereby enhancing the reliability of linked
markers for their use in chickpea breeding for wilt resistance. Besides, validity and reliability of QTL
marker data come from wilt sick field over seasons and artificial wilt sick pot data. The use of confirmed
linked markers for the Foc resistance genes, identified in this study, facilitate selection of resistance
genotypes unambiguously in chickpea breeding programmes to develop resistant genotypes. The QTL
flanking markers, H4G11, CaM1402, CS27, and H3A12 can be effectively used in the development of wilt
resistant germplasm and variety development programs. They represent the genomic region with gene
clusters for resistance against many Foc races including Foc race 1 which is more prevalent in India
(Sharma and Muehlbauer 2007). Moreover, anchoring genomic areas of interest with reliable SSR
markers has been a very profitable strategy allowing saturation of the genomic region surrounding the
Foc resistance genes on LG2 and LG1 to target specific genes involved in resistance. In addition we also
confirm the association of other previously reported markers TA96, CS27, TA59, TA110 and H3A12 with
FW by single marker analysis. The QTLs and markers identified and confirmed in the present study are
useful resource for genomics assisted breeding for resistance to Fusarium wilt in chickpea.
Declarations
Conflict of interest
The authors declare that there is no conflict of interest regarding the publication of this article.
Compliance with ethical standards
Availability of data and material: The data will be provided upon formal request.
Code availability: Not Applicable
Author’s contribution: All the authors has the equal contribution in the manuscript
Ethics approval: Not Applicable
Consent to participate: All the authors have accepted their consent to participate
Consent for publication: All the authors of manuscript have given their consent for publication
Acknowledgements
R.L. Ravikumar, thank the Department of Science and Technology for a research grant (Grant
No.PS/170/2010), Department of Biotechnology (DBT), Government of India for a Ph.D. fellowship to
Page 10/19Dalpat Lal and Dr. Subray G Hegde, Biotechnology Risk Analysis Programs Biotechnology Regulatory
Services, APHIS/USDA, USA for editorial assistance.
References
Arvayo-Ortiz RM, Esqueda M, Acedo FE, Gonzalez RH, Vargas RG (2012) New lines of chickpea against
Fusarium Oxysporum f. sp. ciceris wilt. Ameri J Appl Sci 9(5): 686-693.
Barman P, Handique AK, Tanti B (2014) Tagging STMS markers to Fusarium wilt race-1 resistance in
chickpea (Cicer arietinum L.). Indian J Biotechnol 13: 370-375.
Basten CJ, Weir BS, Zeng ZB (1997) QTL Cartographer: A reference manual and tutorial for QTL mapping.
Department of Statistics, North Carolina State University Raleigh, North Carolina.
Benko-Iseppon AM, Winter P, Huettel B, Staginnus C, Muehlbauer F, Kahl G (2003) Molecular markers
closely linked to Fusarium resistance genes in chickpea show significant alignments to pathogenesis-
related genes located on Arabidopsis chromosomes 1 and 5. Theor Appl Genet 107(2): 379-389.
Brinda S, Ravikumar RL (2005) Inheritance of wilt resistance in chickpea a molecular marker analysis.
Curr Sci 88: 2-19.
Cakir M, Gupta S, Platz G, Ablett GA., Loughman R, Emebiri L, Poulsen D, Li C, Lance R, Galwey N (2003)
Mapping and validation of the genes for resistance to Pyrenophora teres f. teres in barley (Hordeum
vulgare L.). Crop Pasture Sci 54(12): 1369-1378.
Castro P, Piston F, Madrid E, Millan T, Gil J, Rubio J (2010) Development of chickpea near-isogenic lines
for Fusarium wilt. Theor Appl Genet 121: 1519–1526.
Cho S, Chen W, Muehlbauer FJ (2004) Pathotype-specific genetic factors in chickpea (Cicer arietinum L.)
for quantitative resistance to Ascochyta blight. Theor Appl Genet 109: 733–739.
Cobos M, Fernasndez M, Rubio J, Kharrat M, Moreno M, Gil J, Millan T (2005) A linkage map of chickpea
(Cicer arietinum L.) based on populations from Kabuli × Desi crosses: location of genes for resistance to
Fusarium wilt race 0. Theor Appl Genet 110: 347-1353.
Cobos M, Winter P, Kharrat M, Cubero J, Gil J, Millan T, Rubio J (2009) Genetic analysis of agronomic
traits in a wide cross of chickpea. Field Crop Res 111: 130-145.
Doyle JJ, Doyle JL (1990) Isolation of plant DNA from fresh tissue. Focus 12(1): 13-15.
Dubey SC, Suresh M, Singh B (2007) Evaluation of Trichoderma species against Fusarium oxysporum f.
sp. ciceri for integrated management of chickpea wilt. Biol Control 40: 118–127.
Page 11/19Flandez-Galvez H, Ades PK, Ford R, Pang ECK, Tayler PWJ (2003) QTL analysis for Ascochyta blight
resistance in an intraspecific population of chickpea (Cicer arietinum L.). Theor Appl Genet 107: 1257–
1265.
Gowda SJM, Radhika P, Kadoo N, Mhase L, Gupta V (2009) Molecular mapping of wilt resistance genes in
chickpea. Mol Breed 24:177-184.
Gurjar G, Barve M, Giri A, Gupta V (2009) Identification of Indian pathogenic races of Fusarium
oxysporum f. sp. ciceris with gene specific ITS and random markers. Mycologia 101: 484–495.
Haware M, Nene Y, Pundir R, Narayana RJ (1992) Screening of world chickpea germplasm for resistance
to Fusarium wilt. Field Crops Res 30(1): 147-154.
Jalali BL, Chand H (1992) Chickpea wilt In: Plant Diseases of International Importance. Vol. I. Diseases of
Cereals and Pulses (Eds. Singh US, Mukhopadhayay AN, Kumar J and Chaube HS.) Prentice Hall,
Englewood Cliffs, NJ: 429-444.
Jansen RC, Stam P (1994) High resolution of quantitative traits into multiple loci via interval mapping.
Genet 136: 1447–1455.
Jimenez-Diaz R, Alcala-Jimenez A, Hervas A, Trapero-Casas J (1993) Pathogenic variability and host
resistance in the Fusarium oxysporum f. sp. ciceris- Cicer arietinum patho system. In: Proc 3rd European
Semi. on Fusarium mycotoxins, taxonomy, pathogenicity and host resistance, 1993: 87–94.
Jimenez-Fernandez D, Landa BB, Kang S, Jimenez-Diaz RM, Navas-Cortes JA. (2013) Quantitative and
microscopic assessment of compatible and incompatible interactions between chickpea cultivars and
Fusarium oxysporum f. sp. ciceris races. PloS ONE 8(4): e61360.
Jingade P, Ravikumar RL (2015) Development of molecular map and identification of QTLs linked to
Fusarium wilt resistance in chickpea. J Genet 94: 723-729.
Karami ER, Talebi M, Kharkesh A, Saidi (2015) A linkage map of chickpea (Cicer arietinum L.) based on
population from ILC3279×ILC588 crosses: location of genes for time to flowering, seed size and plant
height. Genetika 47(1): 253-263.
Kosambi DD (1943) The estimation of map distances from recombination values. Ann Eugen 12: 172-
175.
Mayer M, Tullu A, Simon C, Kumar J, Kaiser W, Kraft J, Muehlbauer F (1997) Development of a DNA
marker for Fusarium wilt resistance in chickpea. Crop Sci 37: 1625-1637.
Millan T, Clarke HJ, Siddique KH, Buhariwalla HK, Gaur PM, Kumar J, Gil J, Kahl G, Winter P (2006)
Chickpea molecular breeding: new tools and concepts. Euphytica 147(1-2): 81-90.
Page 12/19Millan T, Winter P, Jungling R, Gil J, Rubio J, Cho S, Cobos M, Iruela M, Rajesh P, Tekeoglu M (2010) A
consensus genetic map of chickpea (Cicer arietinum L.) based on 10 mapping populations. Euphytica
175: 175-185.
Pande S, Rao JN, Sharma M (2007) Establishment of the chickpea wilt pathogen Fusarium oxysporum f.
sp. ciceris in the soil through seed transmission. Plant Pathol J 23: 3-6.
Radhika P, Gowda SJM, Kadoo NY, Mhase LB, Jamadagni BM, Sainani MN, Chandra S, Gupta VS (2007)
Development of an integrated intraspecific map of chickpea (Cicer arietinum L.) using two recombinant
inbred line populations. Theor Appl Genet 115: 209-216.
Sabbavarapu MM, Sharma M, Chamarthi SK, Swapna N, Rathore A, Thudi M, Gaur PM, Pande S, Singh S,
Kaur K, Varshney RK (2013) Molecular mapping of QTLs for resistance to Fusarium wilt (race 1) and
Ascochyta blight in chickpea (Cicer arietinum L.). Euphytica 193: 121–133.
Sharma KD, Chen W, Muehlbauer FJ (2005) Genetics of chickpea resistance to five races of Fusarium wilt
and a concise set of race differentials for Fusarium oxysporum f. sp. ciceris. Plant Dis 89: 385-395.
Sharma KD, Muehlbauer FJ (2007) Fusarium wilt of chickpea: physiological specialization, genetics of
resistance and resistance gene tagging. Euphytica 157: 1–14.
Sharma KD, Winter P, Kahl G, Muehlbauer FJ (2004) Molecular mapping of Fusarium oxysporum f. sp.
ciceris race 3 resistance gene in chickpea. Theor Appl Genet 108: 1243-1248.
Singh H, Kumar J, Smithson JB, Haware MP (1987) Complementation between genes for resistance to
race 1 of Fusarium oxysporum f. sp. ciceri in chickpea. Plant Pathol 36: 539–543.
Singh R, Sharma P, Varshney RK, Sharma SK, Singh NK (2008) Chickpea Improvement: Role of Wild
Species and Genetic Markers. Biotech Genet Eng Rev 25: 267-314.
Soregaon CD (2011) Molecular mapping and tagging of Fusarium wilt resistance in chickpea, Cicer
arietinum (L.). [ PhD. Thesis.] UAS, Dharwad, Karnataka, India.
Soregaon CD, Ravikumar RL (2010) Marker assisted characterization of wilt resistance in productive
Chickpea genotypes. Electron J Plant Breed 1(4): 1159-1163.
Upadhyaya H, Haware M, Kumar J, Smithson J (1983a) Resistance to wilt in chickpea. I. Inheritance of
late-wilting in response to race 1. Euphytica 32: 447-452.
Upadhyaya H, Smithson J, Haware M, Kumar J (1983b) Resistance to wilt in chickpea. II. Further evidence
for two genes for resistance to race 1. Euphytica 32: 749-755.
Winter P, Benko-Iseppon AM, Huttel B, Ratnaparkhe M, Tullu A, Sonnante G, Pfaff T, Tekeoglu M, Santra D,
Sant V (2000) A linkage map of the chickpea (Cicer arietinum L.) genome based on recombinant inbred
Page 13/19lines from a C. arietinum× C. reticulatum cross: localization of resistance genes for Fusarium wilt races 4
and 5. Theor Applied Genet 101: 1155-1167.
Tables
Table 1. Correlation coefficient (r) between wilt reactions of RILs in field (W30-07, W30) and pot (W30-pot,
W60-pot) culture experiments
Trait Wilt reaction on 30th day
W30-07 W30-08
W30-pot 0.45 0.36
W30-07 0.67
Wilt reaction on 60th day
W60-07 W60-08
W60-pot 0.33 0.31
W60-07 0.80
W30-pot -wilt reaction of RILs in pot experiment (30th day); W60-pot -wilt reaction of RILs in pot
experiment (60th day); W30-07 -wilt reaction of RILs in field experiment (Rabi 2007); W30-08 -wilt reaction
of RILs in field experiment (Rabi 2008); W60-07 -wilt reaction of RILs in field experiment (Rabi 2007); W60-
08 -wilt reaction of RILs in field experiment (Rabi 2008)
Table 2. Molecular markers associated with Fusarium wilt resistance in the RILs of chickpea
Page 14/19Trait LG Marker Max LOD PVE (%) Additive
W30-pot 1 SSR14 3.21 11.70 12.37
W30-pot 2 H3A12 2.58 9.50 11.13
W30-pot 2 H5A08 3.42 12.39 12.69
W30-07 1 CaM1402 2.61 9.26 7.97
W30-07 1 H4G11 2.84 10.01 8.24
W30-07 2 TR19 2.70 9.55 8.04
W30-07 2 TA59 3.92 13.57 9.59
W30-07 2 CS27 4.39 15.05 10.09
W30-07 2 H3A12 4.91 16.67 10.63
W30-07 2 TA110 3.15 11.05 8.66
W30-07 2 H5A08 3.16 11.08 8.66
W30-07 2 TA96 3.97 13.71 9.63
W30-07 2 TA200 2.51 8.89 7.81
W30-08 1 H4E09 3.12 11.21 8.87
W30-08 1 CaM1402 4.42 15.48 10.47
W30-08 1 H4G11 3.97 14.02 9.90
W60-pot 2 CS27 4.03 14.46 18.23
W60-pot 2 H3A12 3.56 12.89 17.23
W60-pot 2 H5A08 3.68 13.29 17.46
W60-07 1 CaM1402 3.42 11.91 7.63
W60-08 1 CaM1402 3.96 14.00 9.37
W60-08 1 H4G11 2.99 10.75 8.15
LG- linkage group; PVE- phenotypic variation explained by the marker
Table 3. List of QTL detected for Fusarium wilt resistance in chickpea
Page 15/19Trait QTLs LG Position Left Right Max PVE Additive
Marker Marker LOD (%)
W30- qW30-pot- 1 42.00 H4G11 SSR14 2.97 11.89 12.46
pot 1-1
W30- qW30-pot- 2 75.00 TA110 H5A08 3.08 11.62 12.29
pot 2-1
W30- qW30-07-1- 1 22.00 CaM1402 H4G11 3.02 16.40 10.58
07 1
W30- qW30-07-2- 2 47.00 CS27 H3A12 5.70 24.24 12.81
07 1
W30- qW30-08-1- 1 21.00 CaM1402 H4G11 10.56 76.77 23.14
08 1
W60- qW60-pot- 2 46.00 CS27 H3A12 5.17 26.62 24.72
pot 2-1
W60- qW60-07-1- 1 08.00 CaM1402 H4G11 3.38 12.37 7.77
07 1
W60- qW60-08-1- 1 19.00 CaM1402 H4G11 4.37 24.50 12.30
08 1
LG- linkage group; PVE- phenotypic variation explained by the marker
Figures
Page 16/19Figure 1
Recombinant inbred lines showing (a) susceptible (RIL 45, RIL78) and (b) resistant (RIL 70, RIL 85)
reactions in wilt sick pot. (Susceptible plant JG62 is planted in the centre for reference)
Page 17/19Figure 2
Fusarium wilt reaction of RILs in pot testing (W30-pot, W60-pot) under green house and field testing
(W30-07, W60-07) over two years
Page 18/19Figure 3
Linkage maps (LG1, LG2, LG3) depicting the positions of QTLs governing Fusarium wilt resistance in
chickpea.
Page 19/19You can also read