Validity and Reliability of a Smartphone Accelerometer for Measuring Lift Velocity in Bench-Press Exercises - MDPI
←
→
Page content transcription
If your browser does not render page correctly, please read the page content below
sustainability

Article
Validity and Reliability of a Smartphone
Accelerometer for Measuring Lift Velocity in
Bench-Press Exercises
Javier Peláez Barrajón *          and Alejandro F. San Juan
 Department of Health and Human Performance, Sport Biomechanics Laboratory, Facultad de Ciencias Actividad
 Física y Deporte—INEF, Universidad Politécnica de Madrid, 28040 Madrid, Spain; alejandro.sanjuan@upm.es
 * Correspondence: javi.pelaezb@gmail.com

 Received: 21 January 2020; Accepted: 13 March 2020; Published: 16 March 2020

 Abstract: The aim of this study was to determine the validity and reliability that a smartphone
 accelerometer (ACC) used by a mobile basic program (MBP) can provide to measure the mean
 velocity of a bench-press (BP) lift. Ten volunteers participated in the study (age 23.1 ± 2.5 years;
 mean ± SD). They had more than one year of resistance training experience in BP exercise. All
 performed three attempts with different loads: 70%, 90%, and 100% of the estimated value of the
 one-repetition maximum (1RM). In each repetition, the mean velocity was measured by a validated
 linear transducer and the ACC. The smartphone accelerometer used by the mobile basic program
 showed no significant differences between the mean velocities at 70% 1RM lifts (ACC = 0.52 ± 0.11 m/s;
 transducer = 0.54 ± 0.09 m/s, p > 0.05). However, significant differences were found in the mean
 velocities for 90% 1RM (ACC = 0.46 ± 0.09 m/s; transducer = 0.31 ± 0.03 m/s, p < 0.001), and 100%
 1RM (ACC = 0.33 ± 0.21 m/s; transducer = 0.16 ± 0.04 m/s, p < 0.05). The accelerometer is sensitive
 enough to measure different lift velocities, but the algorithm must be correctly calibrated.

 Keywords: accelerometer; smartphone; strength; training; technology

1. Introduction
      Resistance training has been the most-used method to increase athletes’ strength [1]. To prescribe
personalized resistance training programs, it is necessary to know the maximum load that the individual
can move in each specific exercise or the lift velocity [2].
      The One-Repetition Maximum (1RM) test is a way to measure strength; however, it carries a high
injury risk in non-highly trained populations [3]. Even in high-level athletes, performing the 1RM
test still has an injury risk and may require modifications in their training plans [4]. Thus, different
indirect methods have been proposed in the literature to estimate the 1RM value; e.g., muscular
endurance methods [5–7], anthropometric measurement methods [8–11], and lifting-velocity-based
methods [12,13].
      The 1RM estimation method based on lifting velocity has been demonstrated as a valid and
reliable way to obtain the 1RM value without performing the lift with maximum load [12,13]. The
gold-standard tool for measurement of the lifting velocity is the linear transducer [12,13], but it is an
expensive instrument. There are other methods for measuring lift velocity, such as the use of video
analysis [14,15] or professional accelerometers [16,17]. Nowadays, it is more and more common to
find smartphone sports applications (APPs) specifically for velocity lifting analysis [14] or to assess
vertical jumping [18]. Actual smartphones have inertial sensors (i.e., accelerometers, magnetometers,
and gyroscopes) that are used to determine the position and displacement of the device [19]. This
technology could be used to measure lifting velocity [20]. Nevertheless, as far as it is known, there is not
any valid smartphone APP that uses this hardware in order to measure velocity and estimate strength.

Sustainability 2020, 12, 2312; doi:10.3390/su12062312                     www.mdpi.com/journal/sustainability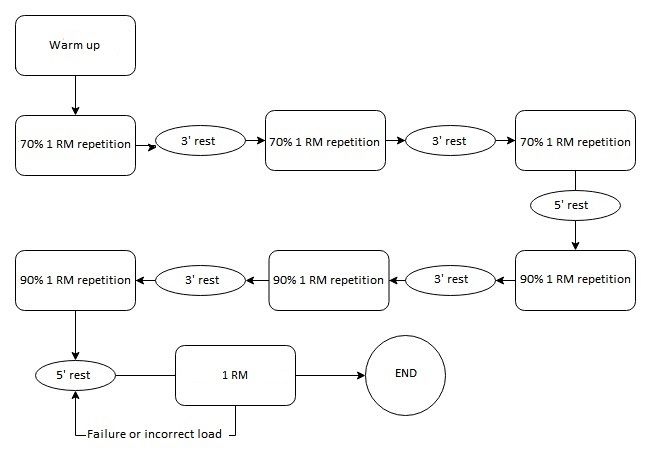
Sustainability 2020, 11, x FOR PEER REVIEW 2 of 9
Sustainability 2020, 12, 2312 2 of 9
not any valid smartphone APP that uses this hardware in order to measure velocity and estimate
strength.
The Theaimaim of study
of this this study
was towas to determine
determine the and
the validity validity and reliability
reliability that a smartphone
that a smartphone accelerometer
accelerometer
(ACC) used by a(ACC)mobileused byprogram
basic a mobile(MBP)
basic program (MBP)
can provide to can provide
measure thetopropulsive
measure the propulsive
(i.e., concentric)
(i.e., concentric) mean velocity of a bench-press (BP) lift in a Smith machine compared
mean velocity of a bench-press (BP) lift in a Smith machine compared with a validated linear transducer. with a
validated linear transducer.
It is hypothesized that the smartphone accelerometer used by a mobile basic program would be
It is hypothesized that the smartphone accelerometer used by a mobile basic program would be
valid and reliable for measuring the lift mean velocity compared to a validated linear transducer.
valid and reliable for measuring the lift mean velocity compared to a validated linear transducer.
2. Materials and Methods
2. Materials and Methods
2.1. Study Design
2.1. Study Design
Ten volunteers performed three full-speed repetitions of BP on a Smith machine with a load of
70% 1RM, Tenthree
volunteers performed
repetitions with athree
load full-speed
of 90% 1RM,repetitions
and oneof BP on a Smith
repetition with amachine with
1RM load. a load
Loads ofof
70%
70% 1RM, three repetitions with a load of 90% 1RM, and one repetition with a 1RM load. Loads of
and 90% of 1RM were chosen because of their use in 1RM estimation using a linear equation [21]. Each
70% and 90% of 1RM were chosen because of their use in 1RM estimation using a linear equation
repetition was measured simultaneously with a validated linear transducer, Speed4Lifts (Speed4Lifts,
[21]. Each repetition was measured simultaneously with a validated linear transducer, Speed4Lifts
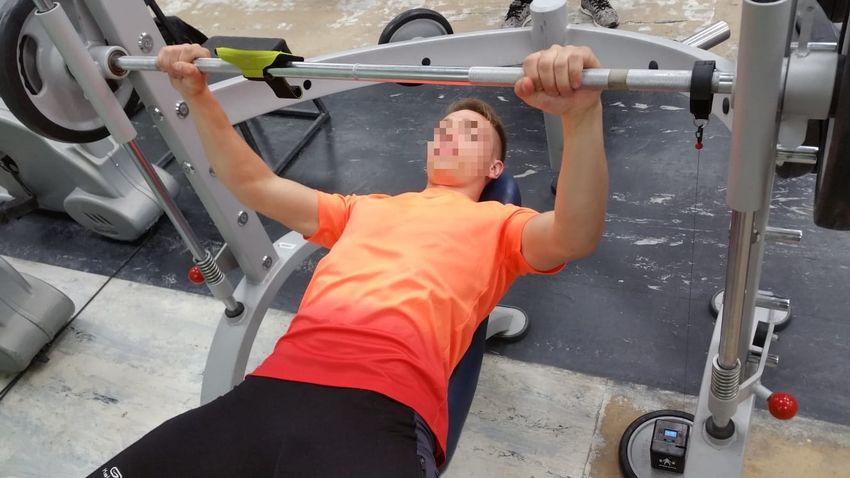
Madrid, Spain) [20], and a smartphone ACC with the MBP, both attached to the bar (Figure 1).
(Speed4Lifts, Madrid, Spain) [20], and a smartphone ACC with the MBP, both attached to the bar
Participants performed 70 BP lifts, whose mean propulsive (i.e., concentric) velocities were compared
(Figure 1). Participants performed 70 BP lifts, whose mean propulsive (i.e., concentric) velocities
with statistical
were comparedanalyses to checkanalyses
with statistical the validity and the
to check reliability
validityofand
thereliability
ACC. of the ACC.
Figure 1. Transducer
Figure and
1. Transducer smartphone
and smartphoneplacement duringthe
placement during thebench-press
bench-press (BP)
(BP) test;
test; photo
photo taken
taken by by
the authors. the authors.
2.2. Participants
2.2. Participants
TenTenhealthy
healthyyoung
youngmales
maleswith
withatatleast
least one
one year
year ofof experience
experienceininresistance
resistancetraining,
training, specifically
specifically
in in
BP,BP,participated in this study (Mean ± SD; age = 23.1 ± 2.5 years; height =
participated in this study (Mean ± SD; age = 23.1 ± 2.5 years; height = 175.3 ± 7.8 cm; weight 175.3 ± 7.8 =cm;
73.2 ±=9.2
weight kg;±1RM
73.2 9.2 kg;
BP 1RM
= 82 ±BP = kg).
13.7 82 ±The
13.7participants
kg). The participants
were recruitedwerethrough
recruited through information
information provided
provided
by one of the researchers to the students in university classrooms. The exclusion criteria were: 1)criteria
by one of the researchers to the students in university classrooms. The exclusion Age
were: (1) Age
younger younger
than than2)18having
18 years; years; (2) having consumed
consumed any narcotic anyand/or
narcotic and/or psychotropic
psychotropic agents or agents
drugs or
drugs during
during the test;
the test; 3) any(3)cardiovascular,
any cardiovascular, metabolic,
metabolic, neurologic,
neurologic, pulmonary,
pulmonary, or orthopedic
or orthopedic disorderdisorder
that
that could
could limit
limit performance
performance in in
thethe different
different tests;
tests; 4) (4) having
having lessless than
than 12 12 months
months of of experience
experience in in
BPBP
training.
training. TheThestudy
studyprotocol
protocoladhered
adhered toto the
the tenets
tenets of
of the
the declaration
declarationofofHelsinki
Helsinkiand andwas
was approved
approved
bybythethe Ethics
Ethics Committeeofofthe
Committee theTechnical
Technical University
University of of Madrid
Madrid(Spain).
(Spain).AtAtthe
theoutset
outsetof of
thethe
study,
study,
participants were informed of the study protocol, the schedule and nature of the exercises, and tests to
be performed before signing an informed consent form.Sustainability 2020, 11, x FOR PEER REVIEW 3 of 9
participants were informed of the study protocol, the schedule and nature of the exercises, and tests
to be performed before signing an informed consent form.
Sustainability 2020, 12, 2312 3 of 9
2.3. Procedure
2.3. Procedure
2.3.1. Bench-Press Test
Bench-Press Test were asked to not train muscles involved in the lift for at least 48 hours before the
Participants
experiment. Before
Participants weretheasked
test, they performed
to not train musclesa warm-up
involved [14,22]
in the that
liftconsisted
for at least of 48five minutes
hours before of
aerobic exercise (treadmill running), followed by dynamic stretches (e.g.,
the experiment. Before the test, they performed a warm-up [14,22] that consisted of five minutes of internal and external
shoulder
aerobic rotations,
exercise elbowrunning),
(treadmill extensions, and wrist
followed rotations)
by dynamic and upper-body
stretches (e.g., internal joint
andmobility
external exercises
shoulder
rotations, elbow extensions, and wrist rotations) and upper-body joint mobility exercises (e.g.,ofband
(e.g., band pull-aparts, light pec-dec flys, and push-ups). Then, they performed two sets five
pull-aparts, light pec-dec flys, and push-ups). Then, they performed two sets of five repetitions of the
repetitions of BP around their 50% 1RM with two minutes of rest between sets. To finish BP
warm-up, the participants performed two sets of one repetition with 50%
around their 50% 1RM with two minutes of rest between sets. To finish the warm-up, the participantsof 1RM at maximum speed
in order to two
performed activate
sets the musculature.
of one repetition withDuring 50% theoftest,
1RMeach participantspeed
at maximum performed
in order three sets of one
to activate the
repetition with a load of 70% 1RM and three minutes of rest between
musculature. During the test, each participant performed three sets of one repetition with a load sets. The BP technique was of
standardized and controlled, and all participants were asked to use the
70% 1RM and three minutes of rest between sets. The BP technique was standardized and controlled, same technique in each BP
lift. all participants were asked to use the same technique in each BP lift.
and
After the
After the last
last 70%
70% 1RM
1RM repetition,
repetition, they
they rested
rested for
for five
five minutes
minutes and and began
began three
three sets
sets of
of one
one
repetition at
repetition at90%
90%1RM 1RMwithwiththree
three minutes
minutes of of
restrest between
between sets.sets. After
After the the
last last
90%90%1RM1RM repetition,
repetition, they
rested five minutes and performed one 1RM attempt (see Figure 2). If the subject failed the liftthe
they rested five minutes and performed one 1RM attempt (see Figure 2). If the subject failed lift
or the
or the load was too light (velocity > 0.2 m/s) [12], participants rested for five minutes
load was too light (velocity > 0.2 m/s) [12], participants rested for five minutes and tried again using a and tried again
using aincremented
newly newly incremented or decremented
or decremented load (2.5% loadto(2.5%
5%). to
All5%). Alllifts
of the of the liftsperformed
were were performed on the on the
Smith
Smith machine (1XP113 Panatta Sport s.r.l X-Pression
machine (1XP113 Panatta Sport s.r.l X-Pression line, Macerata, Italy). line, Macerata, Italy).
Figure 2. Flowchart with the BP test development; graph made by the authors.
Figure 2. Flowchart with the BP test development; graph made by the authors.
As soon as the participant took out the bar from the Smith Machine, they waited three seconds;
then,As
thesoon
mobile basic
as the program (MBP)
participant took outemitted
the bar an from
acoustic
the signal
Smith(“LET’S
Machine,GO”),
theyand the participant
waited did
three seconds;
the descending
then, the mobilephase
basic(i.e., eccentric)
program (MBP)of the lift until
emitted anthey touched
acoustic their
signal chest. Then,
(“LET’S GO”),they
and stopped for one
the participant
second with the bar on their chest, and with the second acoustic MBP warning (“BIP”), they performed
did the descending phase (i.e., eccentric) of the lift until they touched their chest. Then, they stopped
the ascending phase (i.e., concentric) at maximum velocity. Both the MBP and the transducer registered
the mean propulsive (i.e., concentric) lift velocity.Sustainability 2020, 12, 2312 4 of 9
2.4. Instruments
The MBP was developed by one of the researchers (Computer Engineer) in the Android Studio
Integrated Development Environment (Google, Mountain View, CA, USA) using the Java programming
language (Oracle, Santa Clara, CA, USA). To capture the acceleration values, the sensorManager
library was used. The MBP was installed in a Huawei G620S smartphone (Huawei Technologies Co.,
Guangdong, China), with an Android operating system (Google, Mountain View, CA, USA) and a
lis3dh tri-axial accelerometer (STMicroelectronics, Geneva, Switzerland). The accelerometer uses a
scale of ±2 g in this smartphone. The acceleration sampling frequency was set to 50 Hz because it
is a value with a good noise/frequency relation. To calculate the mean propulsive lift velocity (i.e.,
concentric), accelerations were taken from the z axis of the smartphone, and the integration of those
values was made using the integration principle:
Z
v= adt
To obtain the approach of the integration value, a trapezoidal rule was developed in code (1):
Z b
h
f(x)dx ∼ [f(a) + 2f(a + h) + 2f(a + 2h) + . . . + f(b)] (1)
a 2
where h = b−an and n is the number of divisions.
The trapezoid rule divides the area under the curve, defined by acceleration values, into n
trapezoids with different areas. The sum of the trapezoidal areas, contained under the curve, results
in the approximated value of the curve integration. The greater the number of trapezoids, which
matches with the number of acceleration events obtained during the concentric lift phase, the greater
the precision of the integration approach [23].
2.5. Algorithm Description
After pressing the start button, the MBP gives waiting time and emits a sound signal to start the
lift. During the lift, acceleration values are captured and analyzed. First, the athlete performs the
descending (eccentric) phase of the movement in a controlled way and stops for one second, just before
the concentric phase (when the bar touches the chest). The MBP can detect the bench-press pause (there
are no accelerations for a second) and emits a sound (“GO”) that signals the start of the propulsive
phase (concentric). All of the propulsive phase accelerations are stored in an ArrayList data structure.
Then, the first filter, called a “mechanical filter”, is applied. The purpose of this filter is to eliminate
all residual values that the accelerometer may have captured while standing still; those values should
be 0, but are stored as a higher or lower value due to the low accelerometer quality. Subsequently,
a low-pass filter is applied. This filter receives a smooth factor as a parameter; its algorithm is described
in the following fragment of pseudocode:
function smoothArray( accelerationValues, smoothing ){
var value = accelerationValues[0 ]; // start with the first input
for (var i=1, len=accelerationValues.length; iSustainability 2020, 11, x FOR PEER REVIEW 5 of 9
Sustainability 2020, 12, 2312 5 of 9
To obtain the acceleration using the trapezoidal rule, each one of the propulsive acceleration
values is used
To obtain toacceleration
the calculate itsusing
area.theThe base of therule,
trapezoidal trapezoid
each oneis of
known (time between
the propulsive two captured
acceleration values
isacceleration events),
used to calculate as is
its area. the
The height
base of theoftrapezoid
each side of the(time
is known trapezoid
between(formed by twoacceleration
two captured contiguous
acceleration
events), values).
as is the heightThe result
of each sideofofthe
thesum of all (formed
trapezoid areas ofbythetwotrapezoids will
contiguous be the propulsive
acceleration values).
average speed of the lift.
The result of the sum of all areas of the trapezoids will be the propulsive average speed of the lift.
2.6.Statistical
2.6. StatisticalAnalyses
Analyses
Thenormality
The normalityofofthe thedata
datawas
wasanalyzed
analyzedbybythe theShapiro–Wilk
Shapiro–Wilktest. test.Once
Oncethethenormality
normalityofofthe the
dependentvariables
dependent variables was
was confirmed
confirmed (p > (p > 0.05),
0.05), all of all
the of
datathewere
data were provided
provided as their
as their means andmeans
standard and
standard deviations.
deviations. Differentanalyses
Different statistical statistical analyses
were used towereprove used to prove the accelerometer’s
the accelerometer’s (ACC) validity(ACC) and
validity and
reliability reliability inwith
in comparison comparison
the linearwith the linear
transducer. transducer.
The The ACC’s
ACC’s concurrent concurrent
validity validity
was tested usingwas
tested
the usingcorrelation
Pearson the Pearson correlation
coefficient (r). coefficient (r). Cohen’s
Cohen’s convention wasconvention was used
used to interpret theto interpret of
magnitude the
magnitude of the relationship between velocities measured by the ACC
the relationship between velocities measured by the ACC and the linear transducer [24]. To test and the linear transducer
[24].
the To test
ACC’s the ACC’sreliability
measurement measurement
comparedreliability
to that compared
of the linear totransducer,
that of theanlinear transducer,
absolute agreement an
absolute agreement
Intraclass CorrelationIntraclass
CoefficientCorrelation
(ICC) andCoefficient
Cronbach’s(ICC) alpha and Cronbach’s
were alpha were used.
used. Bland–Altman plotsBland–
were
Altmantoplots
created werethe
represent created to represent
agreement betweenthe theagreement between
two instruments. Thethe twodifferences
mean instruments. The mean
between the
differences between
measurements the measurements
were determined using a were determined
paired-sample usingThe
t-test. a paired-sample
standard errort-test. The standard
of estimate (SEE)
error
was of estimate
used to show (SEE) was used
the typical errortoinshow the typical Observer
measurement. error in measurement.
power (OP; 1Observer
– β) waspower (OP; to
calculated 1–
β) was calculated
evaluate the strength to evaluate the strength
of the statistical of the statistical
treatments. Significancetreatments.
was set at p < 0.05. All
Significance was set at pSustainability 2020, 12, 2312 6 of 9
Sustainability 2020, 11, x FOR PEER REVIEW 6 of 9
3.2. Measurement
There was aReliability
good agreement between the mean velocity values obtained from the ACC and the
linear transducer, as shown by the ICC, Cronbach’s alpha (ICC = 0.634; CI = 0.308–0.794; α = 0.698),
There was a good agreement between the mean velocity values obtained from the ACC and the
and Bland–Altman plot (Figure 4).
linear transducer, as shown by the ICC, Cronbach’s alpha (ICC = 0.634; CI = 0.308–0.794; α = 0.698),
and Bland–Altman plot (Figure 4).
Figure 4. Bland–Altman plot between the ACC and the transducer. The central line represents the
Figure 4. Bland–Altman plot between the ACC and the transducer. The central line represents the
systematic bias between instruments, while the upper and the lower lines represent ±1.96 SD; graph
systematic
made by thebias between instruments, while the upper and the lower lines represent ±1.96 SD; graph
authors.
made by the authors.
The paired-sample t-test, used to compare the mean velocities measured by the linear transducer
TheAPP,
and the paired-sample t-test, used
showed a significant to compare
difference (ACC = the mean
0.47 ± 0.14velocities measured
m/s; transducer by ±the
= 0.39 0.16linear
m/s;
transducer and the APP, showed a significant difference (ACC = 0.47 ± 0.14 m/s;
p < 0.001; OP > 0.99), with the ACC mean velocities being higher (mean difference: 0.08 m/s). transducer = 0.39
The±
0.16 m/s; p < 0.001;
paired-sample t-test OP
was>also
0.99), with
used to the ACC the
compare mean velocities
mean being
velocities higherthe
between (mean difference:
transducer and 0.08
the
m/s). The paired-sample t-test was also used to compare the mean velocities between
ACC at each percentage of 1RM, which showed no significant differences between the mean velocities the transducer
and
at the1RM
70% ACCliftsat each percentage
(p > 0.05). of 1RM,
However, which differences
significant showed nowere significant
found differences
in the meanbetween
velocitiesthe
formean
90%
velocities at 70% 1RM lifts (p > 0.05). However, significant differences were found
and 100% 1RM lifts, with the ACC measurements being clearly superior, as Table 1 shows (p < 0.001). in the mean
velocities for 90% and 100% 1RM lifts, with the ACC measurements being clearly superior, as Table 1
shows (pSustainability 2020, 12, 2312 7 of 9
machine in comparison with a validated linear transducer. The data showed that the mean velocity
values obtained by the ACC had a moderate correlation (r = 0.54) with a good level of agreement
(ICC = 0.634) in comparison with the linear transducer. Additionally, the mean velocities measured
with the ACC were significantly higher (mean difference: 0.08 m/s) compared to the mean velocities
measured by the linear transducer.
When the differences between the mean velocities measured in the different 1RM percentages
are specifically analyzed, no significant differences in the mean velocities at 70% 1RM can be seen
between the ACC and the linear transducer (ACC = 0.52 ± 0.11 m/s; transducer = 0.54 ± 0.09 m/s).
However, significant differences were found in the mean velocities in lifts with loads near 90% 1RM
(ACC = 0.46 ± 0.09 m/s; transducer = 0.31 ± 0.03 m/s) and 100% 1RM (ACC = 0.33 ± 0.21 m/s; transducer
= 0.16 ± 0.04 m/s). It seems that the APP measures the mean velocities with loads near 70% 1RM in a
more precise way, showing a low difference of 0.02 m/s between the two devices. However, when loads
are near 90%–100% 1RM, the measurement difference is higher and constant: 0.15 m/s. This higher and
constant difference may be because the signal filter was not correctly programmed for slower velocities.
From a positive viewpoint, the data obtained in this study show that more precise adjustments in
the filtering could be made in order to obtain results as good as those obtained in 70% 1RM lifts.
The linear transducer used in this study to compare the smartphone accelerometer accuracy
measures the velocity of the vertical displacement of the cable attached to the bar using the transduction
of electric signals. Thus, linear transducers are considered the gold-standard tool [25] for measuring
lift velocities. Other systems, like accelerometers, have been shown to be valid and reliable tools for
measuring lift velocities [16–26] and muscular power [22].
Previously, other APPs for measuring lift velocities (e.g., the Powerlift APP) have been proven
as valid and reliable tools [14]. The main drawback of those APPs is that they do not measure the
lift velocity or the acceleration. Hence, they need to know the Range of Motion (ROM) that must be
measured and introduced by the user into the APP. Then, the user must choose the correct frames
where the lift starts and ends. This way of measuring velocity needs a high-speed camera, because the
greater the sampling frequency (frames/second) is, the greater the precision of determining the lifting
time [14]. It is important to know that some of the information of the space travelled between frames is
always lost, and this could produce data loss in the barbell displacement velocity. Moreover, other
mistakes may interfere with correct measurement using these APPs; e.g., ROM measurement must
be made in the same way in order to avoid differences between the lifts. Due to the decisions that
the observer must make (e.g., which frames are correct?), the probability of error rises and makes the
measurement reproducibility harder.
The present study has combined smartphone accelerometer use and the development of a mobile
basic program (MBP) that manages the accelerations obtained during the lift in order to directly
measure lift velocity. Previously, the validity and reliability of other accelerometers, like the Beast
Sensor, have been studied [20]. They showed low validity and reliability at low speeds and a superior
mean velocity compared to linear transducers. The accelerometers also showed a loss of a considerable
number of repetitions that were not correctly detected by the sensor. APPs like Powerlift [14] showed a
precise measurement, but slightly higher than the measured linear transducer velocities. The validity
and reliability of the results of the Powerlift APP depend on the video recording frequency in Hertz
(Hz) and on the correct ROM measurement. These new technologies and this new APP overestimate
mean lift velocity. However, these new technologies use better-quality accelerometers or allow for a
manual process of frame selection and ROM measurement.
In the current study, the ACC validity and reliability could not be assured. This may be explained
because, in the MBP, sampling frequency was set at 50 Hz, a lower value than in other accelerometers
used for velocity measurement (i.e., 200 to 500 Hz) [16,26]. In addition, the building quality of
accelerometers (e.g., Push band, Beast) [16,26] and their prices (i.e., 250–350 USD) are higher compared
with the smartphone accelerometers, which are not meant to analyze movement with such high
precision and which have a lower price (i.e., less than 5 USD). Therefore, it is hard to expect that theSustainability 2020, 12, 2312 8 of 9
ACC in the present study will have better measurement precision compared to other higher-quality
accelerometers and linear transducers. However, the objective is to have the closest measurements to
the gold standard and to overtake the APPs that use video frames to measure velocity. The use of the
smartphone accelerometer presented in this study is a low-cost approximation of a linear transducer
that could be, in the near future, accessible and useful for coaches.
Limitations
The sample number of load ranges in the study is limited, and lower load ranges (e.g., 40% and
60% of 1RM) should be tested in future studies.
5. Conclusions
In comparison with a validated linear transducer, the smartphone accelerometer used by a mobile
basic program presented in this study is valid and reliable for mean propulsive velocities with around
70% of 1RM, for a BP lift in a Smith machine, but not in lower velocity ranges. It can be useful for
coaches because most users will lift loads near to their 70% of 1RM. This technology could be a cheap,
fast, and easy way to measure velocity for coaches in order to plan strength training sessions in the
near future.
In future studies, it is warranted to investigate the development of an APP in which accelerometer
signal filtering will be enhanced in lower-velocity lifts in order to improve the measurement results
in velocity ranges near 90%–100% 1RM. In addition, lower load ranges, such as 40% and 60% of
1RM, will be tested. Moreover, the APP’s behavior will be tested in other smartphones with different
accelerometers and operating systems to try to improve and adjust the APP’s sampling frequency. This
study intends to provide some new perspectives on the use of smartphone sensors in order to improve
sport performance.
Author Contributions: Conceptualization, J.P.B. and A.F.S.J.; methodology, J.P.B. and A.F.S.J.; software, J.P.B.;
validation, J.P.B. and A.F.S.J.; formal analysis, J.P.B. and A.F.S.J.; investigation, J.P.B. and A.F.S.J.; resources, J.P.B.
and A.F.S.J.; supervision, A.F.S.J.; project administration, A.F.S.J. All authors have read and agreed to the published
version of the manuscript.
Funding: This research received no external funding.
Conflicts of Interest: The authors declare no conflict of interest.
References
1. Kraemer, W.J.; Ratamess, N.A. Fundamentals of resistance training: progression and exercise prescription.
Med. Sci. Sports Exerc. 2004, 36, 674–688. [CrossRef] [PubMed]
2. Folland, J.P.; Williams, A.G. Morphological and neurological contributions to increased strength. Sports Med.
2007, 37, 145–168. [CrossRef] [PubMed]
3. Shaw, C.E.; McCully, K.K.; Posner, J.D. Injuries during the one repetition maximum assessment in the elderly.
J. Cardiopulm. Rehabil. 1995, 15, 283–287. [CrossRef] [PubMed]
4. Izquierdo-Gabarren, M.; Expósito, R.G.D.T.; Garcia-Pallares, J.; Sanchez-Medina, L.; de Villarreal, E.S.S.;
Izquierdo, M. Concurrent endurance and strength training not to failure optimizes performance gains. Med.
Sci. Sports Exerc. 2010, 42, 1191–1199. [CrossRef] [PubMed]
5. Chapman, P.P.; Whitehead, J.R.; Binkert, R.H. The 225–1b Reps-to-Fatigue Test as a Submaximal Estimate
of 1-RM Bench Press Performance in College Football Players. J. Strength Cond. Res. 1998, 12, 258–261.
[CrossRef]
6. Dohoney, P.; Chromiak, J.A.; Lemire, D.; Abadie, B.R.; Kovacs, C. Prediction of one repetition maximum
(1-RM) strength from a 4–6 RM and a 7–10 RM submaximal strength test in healthy young adult males.
J. Exerc. Physiol. 2002, 5, 54–59.
7. Mayhew, J.L.; Ball, T.E.; Bowen, J.C. Prediction of bench press lifting ability from submaximal repetitions
before and after training. Res. Sports Med. Int. J. 1992, 3, 195–201. [CrossRef]Sustainability 2020, 12, 2312 9 of 9
8. Cadore, E.; Pinto, R.S.; Brentano, M.A.; Silva, R.F.; da Silva, E.M.; Spinelli, R.; Kruel, L.F.M. Prediction of one
repetition maximum load by total and lean body mass in trained and untrained men. Med. Sports 2012, 16,
111–117. [CrossRef]
9. Caruso, J.; McLagan, J.; Shepherd, C.; Olson, N.; Taylor, S.; Gilliland, L.; Kline, D.; Detwiler, A.; Griswold, S.
Anthropometry as a predictor of front squat performance in American college football players. Isokinet.
Exerc. Sci. 2009, 17, 243–251. [CrossRef]
10. Fry, A.C.; Ciroslan, D.; Fry, M.D.; LeRoux, C.D.; Schilling, B.K.; Chiu, L.Z. Anthropometric and performance
variables discriminating elite American junior men weightlifters. J. Strength Cond. Res. 2006, 20, 861.
[CrossRef]
11. Schumacher, R.M.; Arabas, J.L.; Mayhew, J.L.; Brechue, W.F. Inter-Investigator Reliability of Anthropometric
Prediction of 1RM Bench Press in College Football Players. Int. J. Exerc. Sci. 2016, 9, 427. [PubMed]
12. González-Badillo, J.J.; Sánchez-Medina, L. Movement velocity as a measure of loading intensity in resistance
training. Int. J. Sports Med. 2010, 31, 347–352. [CrossRef] [PubMed]
13. Jidovtseff, B.; Harris, N.K.; Crielaard, J.-M.; Cronin, J.B. Using the load-velocity relationship for 1RM
prediction. J. Strength Cond. Res. 2011, 25, 267–270. [CrossRef] [PubMed]
14. Balsalobre-Fernández, C.; Marchante, D.; Muñoz-López, M.; Jiménez, S.L. Validity and reliability of a novel
iPhone app for the measurement of barbell velocity and 1RM on the bench-press exercise. J. Sports Sci. 2018,
36, 64–70. [CrossRef] [PubMed]
15. Lake, J.P.; Lauder, M.A.; Smith, N.A. Barbell kinematics should not be used to estimate power output applied
to the barbell-and-body system center of mass during lower-body resistance exercise. J. Strength Cond. Res.
2012, 26, 1302–1307. [CrossRef] [PubMed]
16. Comstock, B.A.; Solomon-Hill, G.; Flanagan, S.D.; Earp, J.E.; Luk, H.-Y.; Dobbins, K.A.; Dunn-Lewis, C.;
Fragala, M.S.; Ho, J.-Y.; Hatfield, D.L. Validity of the Myotest®in measuring force and power production in
the squat and bench press. J. Strength Cond. Res. 2011, 25, 2293–2297. [CrossRef]
17. Thompson, C.J.; BEMBEN, M.G. Reliability and comparability of the accelerometer as a measure of muscular
power. Med. Sci. Sports Exerc. 1999, 31, 897–902. [CrossRef]
18. Balsalobre-Fernández, C.; Glaister, M.; Lockey, R.A. The validity and reliability of an iPhone app for
measuring vertical jump performance. J. Sports Sci. 2015, 33, 1574–1579. [CrossRef]
19. Kos, A. Tomažič, S.; Umek, A. Suitability of smartphone inertial sensors for real-time biofeedback applications.
Sensors 2016, 16, 301. [CrossRef]
20. Albalá Gómez, B. Validez y fiabilidad de un sensor basado en acelerometría y de un transductor lineal de
posición para medir la velocidad de ejecución en el ejercicio de press de banca= Validity and reliability of
an accelerometry based sensor and a linear position transducer to measure the speed in the bench press
exercise. Master’s Thesis, Universidad de Leon, Leon, Spain, 2017.
21. Jaric, S. Two-load method for distinguishing between muscle force, velocity, and power-producing capacities.
Sports Med. 2016, 46, 1585–1589. [CrossRef]
22. McMillian, D.J.; Moore, J.H.; Hatler, B.S.; Taylor, D.C. Dynamic vs. static-stretching warm up: the effect on
power and agility performance. J. Strength Cond. Res. 2006, 20, 492–499. [CrossRef] [PubMed]
23. Cruz-Uribe, D.; Neugebauer, C.J. SHARP ERROR BOUNDS FOR THE TRAPEZOIDAL RULE AND
SIMP-SON’S RULE. J. Inequal. Pure Appl. Math 2002, 3, 1–22.
24. Cohen, J. Statistical Power Analysis for the Behavioral Sciences; Routledge: Abingdon, UK, 2013.
25. Garnacho-Castaño, M.V.; López-Lastra, S.; Maté-Muñoz, J.L. Reliability and validity assessment of a linear
position transducer. J. Sports Sci. Med. 2015, 14, 128. [PubMed]
26. Balsalobre-Fernández, C.; Kuzdub, M.; Poveda-Ortiz, P.; del Campo-Vecino, J. Validity and reliability of the
push wearable device to measure movement velocity during the back squat exercise. J. Strength Cond. Res.
2016, 30, 1968–1974. [CrossRef]
© 2020 by the authors. Licensee MDPI, Basel, Switzerland. This article is an open access
article distributed under the terms and conditions of the Creative Commons Attribution
(CC BY) license (http://creativecommons.org/licenses/by/4.0/).You can also read