Valuing Our National Parks: An Ecological Economics Perspective - MDPI
←
→
Page content transcription
If your browser does not render page correctly, please read the page content below
land
Article
Valuing Our National Parks: An Ecological
Economics Perspective
Paul C. Sutton 1,2, * , Sophia L. Duncan 1 and Sharolyn J. Anderson 2
 1   Department of Geography and the Environment, University of Denver, Denver, CO 80208, USA;
     sophialduncan@gmail.com
 2   School of Natural and Built Environments, University of South Australia, Adelaide, SA 5000, Australia;
     sharolyn.anderson@unisa.edu.au
 *   Correspondence: paul.sutton@du.edu; Tel.: +01-303-871-2399

 Received: 25 March 2019; Accepted: 26 March 2019; Published: 29 March 2019

 Abstract: The annual budget for the United States National Park Service was roughly $3 billion in
  2016. This is distributed amongst 405 National Parks, 23 national scenic and historic trails, and 60
 wild and scenic rivers. Entrance fees and concessions generate millions of dollars in income for the
  National Park Service; however, this metric fails to account for the total value of the National Parks.
  In failing to consider the value of the ecosystem services provided by the National Parks, we fail
  to quantify and appreciate the contributions our parks make to society. This oversight allows us to
  continue to underfund a valuable part of our natural capital and consequently damage our supporting
  environment, national heritage, monetary economy, and many of our diverse cultures. We explore a
  simple benefits transfer valuation of the United States’ national parks using National Land Cover
  Data from 2011 and ecosystem service values determined by Costanza et al. This produces an estimate
  suggesting the parks provide $98 billion/year in ecosystem service value. If the natural infrastructure
 ‘asset’ that is our national park system had a budget comparable to a piece of commercial real estate
  of this value, the annual budget of the National Park Service would be roughly an order of magnitude
  larger at something closer to $30 billion rather than $3 billion.

 Keywords: National Parks; ecosystem service value; natural capital; Green New Deal

1. Introduction
     The national parks can be regarded as an asset of natural capital. Traditional capital assets
are frequently valued in dollars; however, estimating the dollar value of natural capital (e.g., the
National Parks) is fraught with complexity and uncertainty. We provide an economic estimate of
the annual value of ecosystem services provided by this natural capital asset to present an argument
for more substantial investment in the maintenance and preservation of our parks. This economic
valuation of the ecosystem services provided annually by the national parks is based on a simple
direct benefits transfer analysis using landcover data and values per biome associated with the
respective landcovers [1]. This estimate includes both economic and non-economic values provided
by the functioning ecosystems of the national parks. In addition, the value of ecosystem services
are sometimes perceived by the public yet often not perceived (e.g., the value of nutrient cycling by
soil biota is often not perceived or appreciated by the public [2]). Ecosystem services provided by
nature have many market failure properties including unclear property rights, public good nature,
externalities, and common pool resources. Consequently, these estimates of value are not intended to
enable commodification of ecosystem services or the natural capital assets that generate them.

Land 2019, 8, 54; doi:10.3390/land8040054                                          www.mdpi.com/journal/land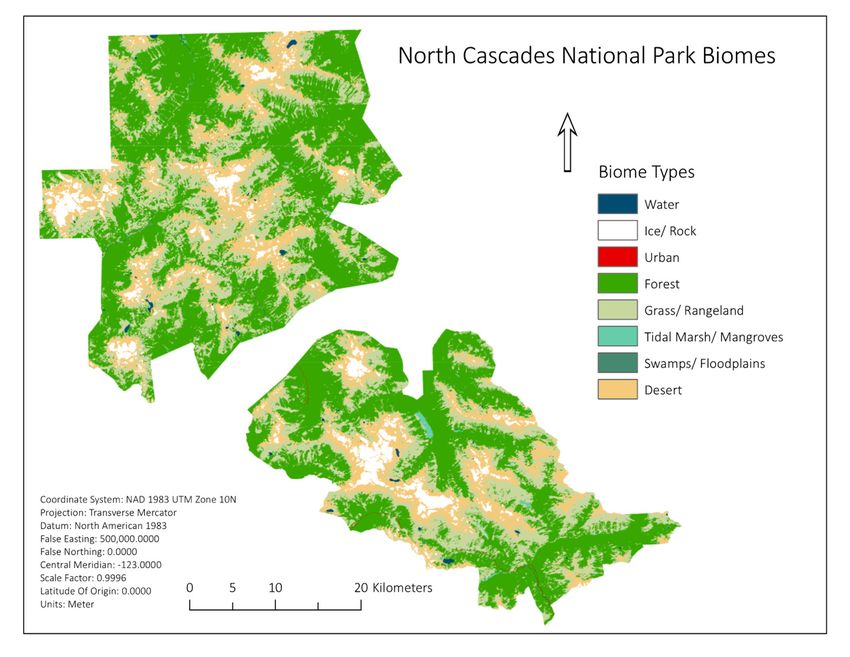
Land 2019, 8, 54                                                                                        2 of 17

1.1. Economic and Non-Economic Value of the United States’ National Parks
      More than 275 million people visit “America’s best idea” every year [3]. From the swampy
Everglades, reminiscent of the age of dinosaurs, to the purple mountains of Rocky Mountain National
Park, the National Parks protect our natural wonders. The social impact of our National Parks is
manifold; Americans and foreigners alike can immerse themselves in history at our battlefields and
National Historic Sites, and leave their cities of origin to find themselves truly in the wild in parks and
National Monuments.
      The financially measurable economic impact of our parks is significant. Concessioners within the
National Parks generate $1.3 billion in revenue every year, and pay $80 million in franchise fees to the
federal government [4]. Communities near the National Parks also depend on park visitation to sustain
nearly 300,000 local jobs; these visitors contribute $32 billion to the U.S. economy [4]. The influence of
the National Parks reaches beyond their physical boundaries. National Park tours contribute to the
international travel industry. Small towns that are “on the way” to the parks also benefit from the
traffic that runs through them [4].
      There are many ways to attribute value to the National Park Service. Some traditional approaches
are metrics like number of visitors, concessioner profits, and job growth; however, these approaches
focus primarily on the transactional economic activities taking place in or near our National Parks
and are used as a proxy measure of value [4]. Ecosystem services are the benefits we receive
from functioning ecosystems [5]. Examples of ecosystem services include four broad categories:
(1) provisioning services (production of food, fiber, and timber), (2) regulating services (e.g., water
filtration and climate regulation), (3) supporting services (e.g., nutrient cycling) and (4) cultural services
(e.g., recreation, aesthetic inspiration, and cultural identity) [6].
      Human wellbeing results from the interaction of ecosystem services with human, social, natural,
and built capital [7]. The ways that individuals, communities, and their built environments interact
with natural capital is how we reap the benefits of ecosystem services [8]. Ecosystem services and
natural capital suffer from many market failure properties including the following: they suffer from
both positive and negative externalities, they have unclear property rights, many are open access
regimes, and they are often public goods [9]. Estimates of the economic value of ecosystem services
suggest their value is almost twice as large as the entire global market economy, which precludes
any policy attempts to internalize the costs of any externalities associated with damaging ecosystem
functions and or services [10]. Because of the many market failure qualities of ecosystem services we
argue that structuring the ways our built and social environments interact with ecosystem services is
not best optimized by free market principles and policies. Making shifts in the arrangements of social,
human, built, and natural capital will likely prove to be quite difficult because preliminary studies in
South Australia suggest that those trained in the dominant economic paradigm (people employed in
finance, management, and business) have significantly lower levels of ecological literacy [11].
      Economic valuation of ecosystem services is often perceived as a way to commodify natural
capital thus enabling the preservation of neo-classical economic policy for the ‘management’ of
nature. The immense value of ecosystem services relative to the market economy, in addition to their
aforementioned market failure properties, suggest that current environmental challenges result from a
failure of governance [12]. Market failures are generally recognized to be an appropriate domain of
government intervention. Sustainable and desirable stewardship of our environmental endowment
(including our national parks) will likely require new institutions utilizing broader holistic policies,
using longer time horizons, and associating significantly higher values to ecosystem services than are
currently provided by market-based assessments [13].

1.2. Valuation Is Not Commodification
     We explore a simple economic valuation of the lands that exist in the National Parks of the United
States using a benefits transfer methodology. There are many criticisms of the very idea of placing
an economic value on nature that have undoubtedly contributed to the distracting debate on the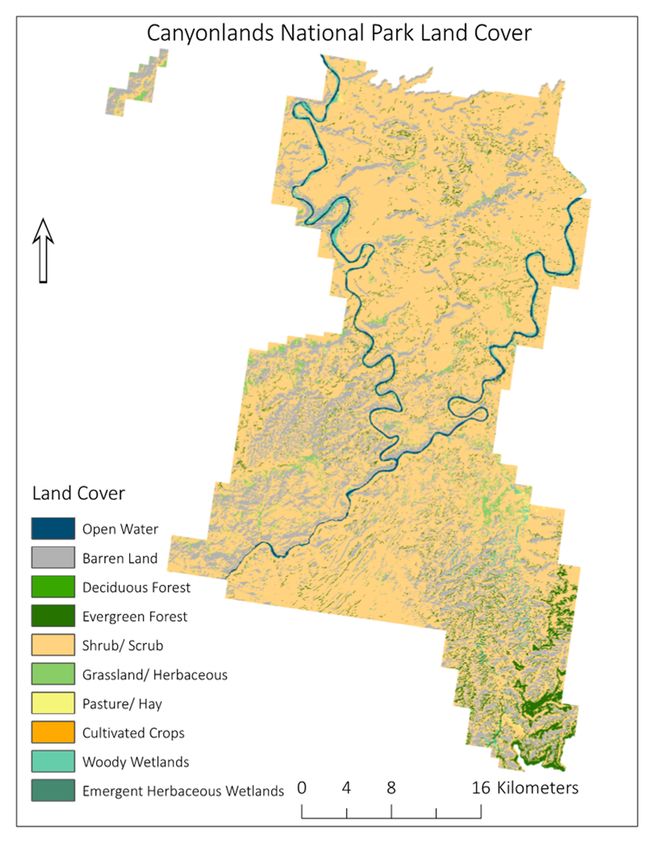
Land 2019, 8, 54                                                                                     3 of 17

 difference (or lack thereof) between the idea of Ecosystem Services and ‘Nature’s Contribution to
 People’ [14,15]. One fundamental criticism from the ‘you simply underestimated infinity’ school of
 thought is that any finite estimate of the value of natural capital is an underestimate because the
‘consumer surplus’ of nature is infinite—or at least ‘all that we could possibly pay’—because without
 natural capital there is no society, no built capital, no human capital, and no economy at all. While this
 is true, infinity is not a useful number to use when making decisions about the allocation of resources.
 Failure to appropriately value natural capital and ecosystem services has resulted in lost ecosystem
 services due to land degradation (~$6 trillion/year [9]) and land cover change (~$20 trillion/year [7]).
These losses are massive relative to the size of the global market economy and suggest that ‘business
 as usual’ free market policies will continue to fail.
       In a period of political, economic, and social uncertainty, the future of our National Parks hangs
 in the balance. Ecosystem service valuation provides a method of valuing our Natural Parks that can
 be useful in resource allocation decisions and enhance a more comprehensive appreciation of their
value and the benefits we derive from them. The process of ecosystem service valuation should not be
 confused with the commodification of nature. Many ecosystem services are non-rival, meaning a large
 number of people can enjoy a hiking trail at a National Park without impairing others’ enjoyment [16].
 However, when Parks are supplied in such a manner as to be frequently congested, we cause many
problems including: degradation of the parks themselves, impaired experiences of park visitors,
 and reduced public access to nature that is likely to be controlled by pricing mechanisms that are
 likely to increase the inequality of access to a public resource. Many ecosystem services are also
 non-excludable; using the National Parks as an example, the benefits of forests filtering air and
 sequestering carbon extend far beyond the boundaries of the park [14]. Clearly, it is recognized that
 National Parks are a public good that should be established and maintained by government; however,
 the failure to appreciate the total value of our parks is resulting in an underinvestment in parks and
 their supporting infrastructure.
       The intent of ecosystem service valuation is not to put a “price tag” on these services or suggest
 they should be commodified. In fact, one purpose of ecosystem service analysis is to show how our
wild places produce value that can be thought of ‘in dollars’ to those who are unable to frame nature
 conservation as “a moral issue” [17]. Critics who assume that ecosystem service values are expressed
 in monetary units for the sake of pricing them for commodification are mistaken; while the values
 could be expressed in terms of time, energy, or land, these units may not be easily understood by a
 large audience, particularly those in decision-making positions [7]. It is dangerously naïve to promote
 a moral path (e.g., ‘nature is infinitely valuable’) as the primary argument for protecting nature. Of
 course nature has intrinsic value; however, a collective mindset of this nature has not yet developed
 sufficiently to influence policymakers. In the meantime, “Appeals to people’s wallets” may enhance
 the survival of our National Parks [18].
       The National Parks are often regarded as natural capital; however, most of the deferred
 maintenance making up a $12 billion backlog of work weighing down on the National Park Service
 relates to crumbling infrastructure [18]. This built infrastructure is a poignant example of how our
 enjoyment of the parks manifests from an interaction of people, infrastructure, and nature (e.g., Human,
 Social, Built, and Natural Capital). Typically, property management costs range from 30-50% of the
 gross rental revenue of a property. If the value of ecosystem services provided by the parks were
 regarded as a component of the true revenue structure of the National Park Service we could justify
 a much larger operating budget for the NPS. Currently, the National Park Service’s budget is less
 than 5% of the annual ecosystem service value of the 46 National Parks involved in this study alone.
The National Park service is allotted $2.8 billion a year to distribute between 417 sites [4]. After
 celebrating their Centennial in 2016, the National Park Service recommitted “to exemplary stewardship
 and public enjoyment” [18]. In order to accomplish this, the National Parks will require increased
 financial support. A benefits transfer analysis of Yellowstone and Grand Teton National Parks found
 their combined annual ecosystem service valuation to be $1.4 billion/year, meaning two parks return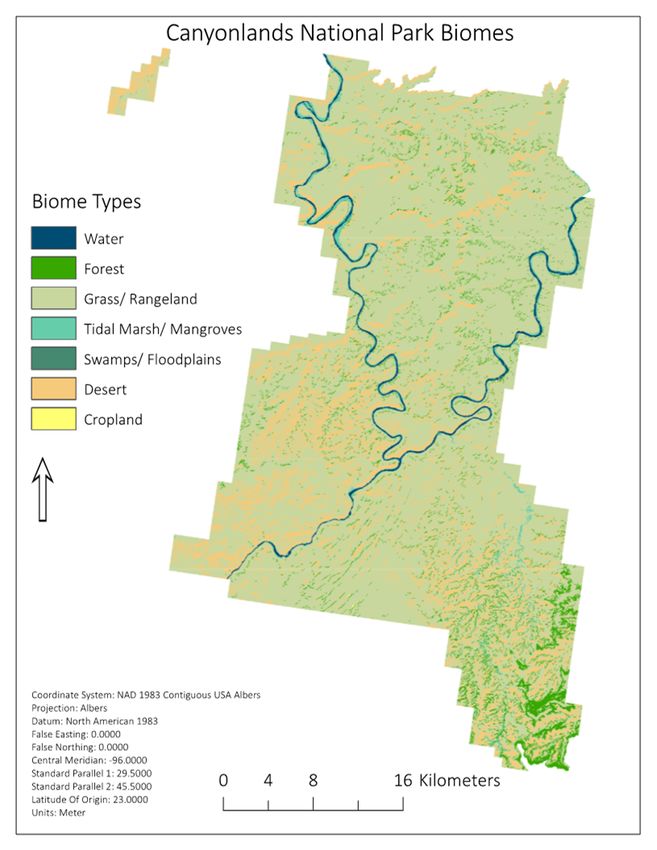
Land 2019, 8, 54                                                                                     4 of 17

half of the value of what is spent on the entire system every year [19]. Ecosystem service valuation is
a tool that may be used to justify increased financial resources for wild spaces, which provide many
more benefits to society than meet most politicians’ eyes.

2. Materials and Methods
     Boundary information for the National Parks was taken from the National Park Service’s GIS
database (https://irma.nps.gov/DataStore/). The dataset includes all areas the National Park Service
(NPS) is responsible for. We focused the scope of the project to only those components of the NPS
that were actual National Parks (does not include national monuments, wild and scenic rivers, etc.).
Additionally, National Parks outside of the 48 contiguous states were excluded. There were ultimately
46 National Parks included in this ecosystem service valuation.
     The National Land Cover Database (NLCD 2011) contains the most recent land cover information
at 30-meter spatial resolution for the United States. The dataset uses a 16-class land cover classification
scheme derived from a combination of Landsat and supplementary imagery [20]. The biome types
used for the final ecosystem service valuation were taken from Costanza et al.’s framework [7]. The
ecosystem service values were estimates based on 17 types of ecosystem services using a benefits
transfer method. This approach makes simplifying assumptions about spatial dependence, ecosystem
function, and transferability of value [19]. Nonetheless, we argue that these estimates of ecosystem
service values are likely underestimates and are plausible and defensible as they are based on thousands
of existing peer-reviewed ecosystem service valuations that exist in the TEEB database [1].
     NLCD raster data were extracted to the National Park boundaries. Land cover types were
reclassified to the biome type they most closely fit (Appendix B for the land cover reclassification
scheme). The resulting table for the National Parks produced an area estimate for each biome type
within each park. Benefits transfer assumes the value of a wetland in Florida is the same as the value
of a wetland in Virginia. To calculate total value of the ecosystems of each park we simply multiplied
the biome specific value (Appendix B) by the areal extent of that biome in the park and summed
across biomes.

3. Results
      The areal extent and annual ecosystem service value of each National Park is summarized (Tables 1
and A1). The resulting total estimate of the annual value of the ecosystem services of the National
Parks is $98,694,393,676 per year. Everglades National Park has the greatest annual ecosystem service
value at $50 billion per year. It has the greatest spatial extent of tidal marsh and mangrove biome types,
as well as the greatest spatial extent of swamps and floodplains. It is the third-largest National Park by
area. The National Park with the lowest annual ecosystem service value is Hot Springs National Park
in Arkansas. It is also the smallest National Park by area at just 2200 hectares.
      The 10 National Parks with the lowest ecosystem service valuations have a few traits in common.
Firstly, they have very little water compared to parks with higher ecosystem service values. They also
have very little marsh or swamp land cover. These three biome types provide higher value ecosystem
services than others. The 10 parks with the lowest ecosystem service valuations are in arid parts of the
country. The three National Parks with the highest annual ecosystem service values are the Everglades,
Yellowstone, and Death Valley, respectively. They are also the three largest parks by area.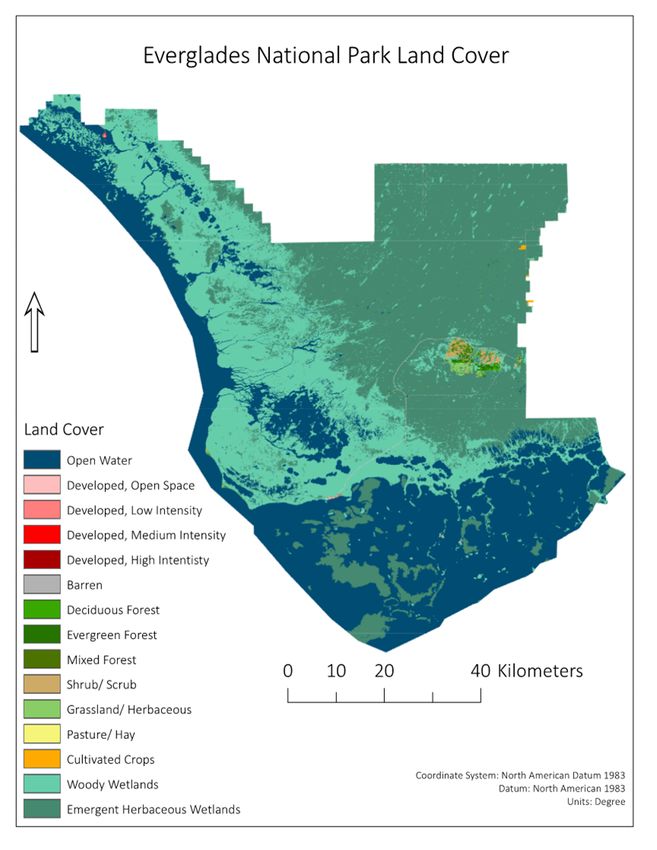
Land 2019, 8, 54                                                                                    5 of 17

      Table 1. The area and annual ecosystem service values of the National Parks in the conterminous
      United States.

                           Park Name              Park Area (ha)     Total ESV (2016$/ha/y)
                              Acadia                  15,699               378,887,375
                              Arches                  30,942               204,204,501
                             Badlands                 98,517               216,693,321
                             Big Bend                328,701              1,778,630,727
                             Biscayne                 67,875              1,810,954,914
                   Black Canyon of the Gunnison       12,689                58,684,728
                          Bryce Canyon                14,564                60,964,780
                           Canyonlands               135,541              1,017,166,042
                           Capitol Reef               98,788               366,054,464
                        Carlsbad Caverns              18,937                90,972,557
                         Channel Islands              99,132               957,856,136
                            Congaree                  9815                2,058,402,071
                           Crater Lake                73,566               368,448,820
                         Cuyahoga Valley              13,519               260,027,212
                           Death Valley             1,376,357             6,442,495,192
                           Dry Tortugas               25,081               395,739,182
                            Everglades               622,662              49,466,632,189
                              Glacier                407,920              1,816,885,089
                          Grand Canyon               488,719              2,228,968,985
                           Grand Teton               125,410              1,353,786,050
                           Great Basin                31,239               131,690,319
                        Great Sand Dunes              32,745               236,529,676
                     Great Smoky Mountains           209,826               980,498,972
                      Guadalupe Mountains             35,566               162,572,601
                           Hot Springs                2214                  10,356,998
                            Isle Royale              222,438              5,145,696,578
                           Joshua Tree               321,049              1,466,536,890
                          Kings Canyon               185,839               577,918,285
                         Lassen Volcanic              43,425               198,473,270
                         Mammoth Cave                 20,777               188,981,715
                           Mesa Verde                 21,723               118,863,815
                          Mount Rainier               95,197               530,773,576
                         North Cascades              202,767               869,959,499
                             Olympic                 369,955              2,723,836,053
                          Petrified Forest            90,301               450,290,532
                            Redwood                   46,799               300,054,179
                         Rocky Mountain              108,021               650,437,132
                             Saguaro                  37,819               182,023,394
                             Sequoia                 164,710               581,911,493
Land 2019, 8, 54                                                                                                                                   6 of 17

                                                                          Table 1. Cont.

                                             Park Name                          Park Area (ha)                 Total ESV (2016$/ha/y)
                                             Shenandoah                              78,217                           354,510,977
                                      Theodore Roosevelt                             28,484                           320,140,985
                                             Voyageurs                               82,779                          3,098,987,587
                                             Wind Cave                               11,462                            55,255,383
                                             Yellowstone                            890,092                          6,554,214,176
                                              Yosemite                              301,643                          1,223,899,211
                                                Zion                                 59,928                           247,526,063
                                               Totals                              7,759,448                         98,694,393,694

     Grasslands and forest are dominant biomes in terms of areal extent of the National Parks (Figure 1).
Grass/Rangeland is the most prevalent biome type in the National Parks, while cropland was the least.
The land cover classification scheme used in this analysis is given in Table A2. “Desert,” “Tundra,”
and “Ice/Rock” are the only three biome types with an ecosystem service value of $0. This is merely a
reflection of lack of data in the TEEB database rather than a reflection of low value for those biomes.
Clearly Desert, Tundra, and Ice/Rock perform valuable ecosystem services for which we, as of yet,
lack a substantial number of peer-reviewed assessments. This is another reason we can regard our
estimates as conservative if not low. Forest is the second most prevalent biome type, and has an
ecosystem service value per hectare of $4446 per year. Water (Streams, Lakes, and Rivers) is the third
         Land 2018, 7, x FOR PEER REVIEW                                                                   6 of 15
most prevalent      biome type, and has the third-highest annual ecosystem service value                       of the biomes
considered    in this     study   at $14,639   per   year.  The  two   most  valuable    biome   types   in
         the third most prevalent biome type, and has the third-highest annual ecosystem service value of theterms  of dollar
value of ecosystem services provided do not have substantial spatial extents: Tidal Marsh/Mangroves
         biomes   considered    in this study at $14,639 per year. The two most valuable biome types in terms   of
         dollar value of ecosystem services provided do not have substantial spatial extents: Tidal
and Swamp/Floodplains.
           Marsh/Mangroves and Swamp/Floodplains.

                                                Spatial Extent of Biome Types in the National Parks
                                45,000,000
                                                                                           40,615,297
                                40,000,000

                                35,000,000
              AREA (HECTARES)

                                30,000,000
                                                                              25,489,631
                                25,000,000

                                20,000,000

                                15,000,000

                                10,000,000    6,942,021                                                                       6,515,409
                                 5,000,000                                                              2,589,979 3,112,913
                                                          594,484   338,515                                                               17,844
                                        0

                      Figure 1. The spatial extent of each biome type in the National Parks in the conterminous United
      Figure 1. The spatial extent of each biome type in the National Parks in the conterminous United States.
                      States.

     Canyonlands    Park Park
             Canyonlands    provides    ananexample
                                 provides      example ofofour
                                                            our  benefits
                                                               benefits     transfer
                                                                        transfer      approach.
                                                                                 approach. The NLCD The  NLCD
                                                                                                      land cover land cover
categories (Figure(Figure
        categories   1) are1) reclassified
                               are reclassifiedtotothe
                                                    the biomes
                                                        biomes ofofthethe  TEEB
                                                                        TEEB       database
                                                                              database (Figure (Figure   2). Canyonlands
                                                                                                2). Canyonlands
NationalNational
         Park isPark
                   the is15th-largest
                          the 15th-largest  parkby
                                         park      by area
                                                      area out
                                                            outofof
                                                                  thethe
                                                                      46 parks  analyzed.
                                                                          46 parks        Canyonlands
                                                                                     analyzed.          NP is in
                                                                                                    Canyonlands    NP is in
           arid, southeastern Utah, near Arches National Park. The area is famous for its rusty red rocks and
           other-worldly rock formations. The Green and Colorado Rivers converge in the park. The dominating
           land cover type for Canyonlands National Park is “Shrub/Scrub,” followed by “Desert” (Figure 1).
           The most prevalent biome type is “Grass/Rangeland,” followed by “Desert” (Figure 2). The rivers
           support some wetland biomes, which constitute around 45% of the park’s total annual ecosystem
           service value. The ecosystem service value of Canyonlands National Park is $1,017,166,041 per year.
                Everglades National Park, located on the southern tip of Florida, is also a World Heritage Site
Land 2019, 8, 54 7 of 17
arid, southeastern Utah, near Arches National Park. The area is famous for its rusty red rocks and
other-worldly rock formations. The Green and Colorado Rivers converge in the park. The dominating
land cover type for Canyonlands National Park is “Shrub/Scrub,” followed by “Desert” (Figure 1).
The most prevalent biome type is “Grass/Rangeland,” followed by “Desert” (Figure 2). The rivers
support some wetland biomes, which constitute around 45% of the park’s total annual ecosystem
service value. The ecosystem service value of Canyonlands National Park is $1,017,166,041 per year.
Everglades National Park, located on the southern tip of Florida, is also a World Heritage Site
thanks to its unparalleled biodiversity. Figure 3 shows extensive “Water,” “Woody Wetlands,” and
“Emergent Herbaceous Wetlands” land cover types. 99% of the biome types at the park are “Marsh,”
“Swamp,” or “Water,” shown in Figure 3. The ecosystem service value of Everglades National Park,
about $50 billion per year, constitutes more than half of the ecosystem service value of all the National
Parks combined. The value of water ecosystem services account for 6% of the park’s total annual
ecosystem service valuation, while wetlands account for around 94% of the park’s total valuation.
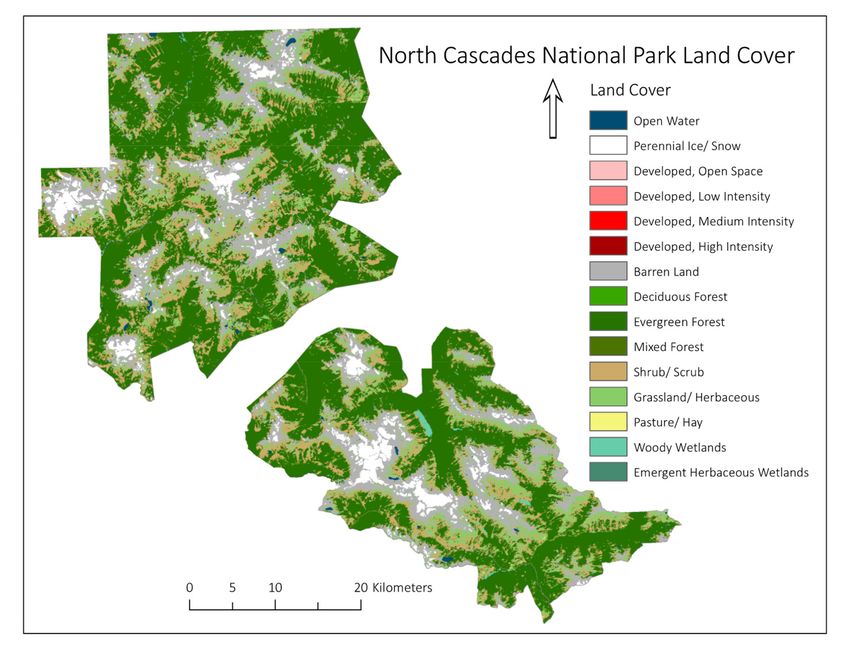
North Cascades National Park in Washington is mountainous and home to hundreds of glaciers.
The footprint of the mountain range is visible in Figures 4 and 5, which shows the land cover data of
the park. The annual ecosystem service value of North Cascades National Park is $869,959,499 per
year. It is the 12th-largest park by area in this study. North Cascades has one of the largest spatial
extents of the “Forest” biome type out of all the National parks studied. The forest biome accounts for
50% of the park’s total ecosystem service valuation and covers just under 50% of the park. Around 5%
of the
Land park
2018, 7, xis covered
FOR by “Perennial Ice/Snow.” While marshes cover less than 1% of the park’s7 land,
PEER REVIEW of 15
they make up nearly 16% of the park’s annual ecosystem service valuation.
(a) (b)
Figure 2. Land
Figure 2. Land cover
cover (NLCD)
(NLCD) and
and Biomes
Biomes (ESV)
(ESV) for
for Canyonlands
Canyonlands National
National Park.
Park(a) (b)
Land 2019, 8, 54 Figure 2. Land cover (NLCD) and Biomes (ESV) for Canyonlands National Park 8 of 17
Land 2018, 7, x FOR PEER REVIEW 8 of 15
of the park’s total ecosystem service valuation and covers just under 50% of the park. Around 5% of
the park is covered by “Perennial Ice/Snow.” While marshes cover less than 1% of the park’s land,
they make up nearly 16% of the
Figure park’s annual
3. Everglades ecosystem
National service
Park Land Covervaluation.
and Biomes.
Figure 3. Everglades National Park Land Cover and Biomes
North Cascades National Park in Washington is mountainous and home to hundreds of glaciers.
The footprint of the mountain range is visible in Figure 4 & 5, which shows the land cover data of the
park. The annual ecosystem service value of North Cascades National Park is $869,959,499 per year.
It is the 12th-largest park by area in this study. North Cascades has one of the largest spatial extents
of the “Forest” biome type out of all the National parks studied. The forest biome accounts for 50%
Figure 4. North Cascades National Park land cover map.
Figure 4. North Cascades National Park land cover map.Land 2019, 8, 54 9 of 17
Figure 4. North Cascades National Park land cover map.
Figure 5. North Cascades National Park biome types.
Figure 5. North Cascades National Park biome types.
There are many issues associated with the reduction of the NLCD classes to the biomes of
There The
the TEEB. are many issues associated
most abundant with
biome in thethe reduction
parks of the NLCD classesThis
was “Grass/Rangeland.” to the
is biomes
partiallyofdue
the
TEEB. The most abundant biome in the parks was “Grass/Rangeland.” This is partially
to the classification of land cover types. Death Valley National Park has more pixels classified as due to the
classification of land
“Grass/Rangeland” cover
than types.park
any other Death
by aValley
factor National
of 10, whilePark has
most moreknow
people pixels classified
Death Valley asis
“Grass/Rangeland” than any other park by a factor of 10, while most people know
America’s most famous desert. The NLCD calls “Shrub/Scrub” a land cover type where vegetation Death Valley is
is “less than 5 meters tall . . . stunted from environmental conditions” [20]. This land cover type
was characterized as the “Grass/Rangeland” biome type because we see this type of vegetation in
grasslands, in the alpine, and in deserts. Similarly, the “Barren” land cover type includes scarps, glacial
debris, talus, and slides, as well as desert pavement and sand dunes, which are found in desert and
alpine landscapes. The “Barren” land cover type was reclassified to “Desert.” This oversimplification
means “Desert” biomes were reported in alpine areas where a visual analysis might show a different
biome type. This limitation did not ultimately affect the results of the valuation because “Desert”
biomes are currently valued at zero dollars. These issues of classification are challenging and introduce
a variety of uncertainties into analyses of this type.
4. Discussion
There are many potential criticisms of these valuations from a technical point of view. Ecosystem
service values for the same biome vary spatially [9]. The ecosystem service values used here were
intended for a global scale, and even regionally specific ecosystem service values would not be as
accurate as ecosystem service values specific to each National Park [21]. The spatial resolution of the
data means not all variation in land cover within the parks was captured [22]. These sources of error
could result in higher or lower estimates of the National Parks’ ecosystem service values. Other errors
may have arisen from the reclassification of the biomes from the NLCD data [20,23].
For example, there was no distinction between forest types or marine vs. freshwater biomes.
Thus, all types of “forest” were simplified to a single forest ecosystem service average, and all water
land cover was assigned the “river/lake” ecosystem service value because there is more freshwater in
the National Parks than saltwater [24]. Conversely, the land cover dataset returned different levels
of intensity for urban land cover. The ecosystem service value dealing with urban land cover from
Costanza et al. does not make this distinction, so all levels of urban development were assignedLand 2019, 8, 54 10 of 17
the same ecosystem service value. This study did not incorporate a recent urban ecosystem service
valuation of New York City’s Central Park, which is currently the highest estimate of per-hectare
ecosystem service value ever published ($70 million per hectare per year) [25]. This astronomical
estimate of urban ecosystem service value was not included in this study and would not have mattered
much because there is very little urban area within the parks. This estimate of Central Park’s ecosystem
services is very high because the value results from the significant interaction of human, social, built,
and natural capital that exists in Central Park. A study conducted by researchers at Colorado State
and Harvard surveyed Americans as to what they would pay for the preservation of the parks. Their
estimate of the total annual value of our National Parks was $62 billion/year. This estimate is likely
also amplified by the significant interaction of human, social, built, and natural capital that takes place
in the parks.
The take home point of this study is that a plausible and conservative estimate of the value of
the ecosystem services provided by the lands within the United States National Parks is roughly $98
billion/year. This estimate is in line with the CSU-Harvard (NPS-TEV) study that estimated the annual
value of the National parks at $62 billion/year [26]. The $62 billion figure was based primarily on
analysis of surveys that asked Americans what they would be willing to pay on an annual basis in
addition to their existing taxes to preserve the park system and its programs. In fact, the NPS_TEV
study validates the idea that our estimate is conservative because we include many ecosystem services
that are not well perceived by the public [2].
Ongoing land degradation, climate change, ocean acidification, and land cover changes are
reducing the quantity and quality of ecosystem services being provided globally [4,5]. These losses
are taking place because we do not value ecosystem services at a sufficient level to preserve them.
Many individuals, NGOs, and nations are progressively more involved in studies, legislation, and
increasingly urgent expressions of concern regarding damage to the world’s environment that is
ongoing and likely accelerating [27–29].
A primary reason for this loss of natural capital is our collective inability to appropriately value
our natural environment. Valuations of ecosystem services that eclipse the dollar size of market
economies are regarded as not credible by some (particularly economists); however, there is growing
consensus that our market-based economic systems have failed to serve as rational stewards of the
environment [30]. We present these numbers as a reasonable starting place to discuss a new allocation
of resources in which we preserve the ability of our environment to support our society, economy, and
individual wellbeing. We regard plausible valuation of ecosystem services as a good starting point for
environmental politics [31] and suggest that discussions of levels of funding for our national parks is
fundamentally in the domain of environmental politics and the institutional changes suggested are
compatible with ideas expressed in ‘The Green New Deal’.
In addition, this study only included areas under the National Park Service’s “National Park”
classification. Of course, most, if not all, areas they manage provide ecosystem services, from historical
battlefields to recreation areas to lakeshores. This study only included National Park areas within the
contiguous 48 states. There are several National Parks in Alaska, American Samoa, the U.S. Virgin
Islands, Puerto Rico, and Hawaii that were not considered in this study, including the largest National
Park in the system, Wrangell-St. Elias National Park, which is 5.37 million hectares [4].
Even if the ecosystem service values were overestimated in this study, a lower estimated value
would be considerably higher than the amount spent on the National Parks by the federal government.
More importantly, only a small fraction of the areas maintained by the National Park Service were
analyzed in this study. A study done of ecosystem service values of all the wild spaces managed by
the Park Service would undoubtedly return an even higher value. Given that the annual budget of
the National Park service is around $3 billion, and the value of the associated ecosystem services is
more than 28 times that, we suggest they are grossly underfunded in terms of return on investment.
If we regarded the National Parks as more than a revenue stream generated by visitors, and rather
as natural capital generating a revenue stream of ecosystem services that have significant monetaryLand 2019, 8, 54 11 of 17
value, it is likely that greater investments in the National Parks would be less controversial. If the
National Parks were treated as built capital, and we used annual ecosystem services alone to account
for gross revenue, we would provide at least $27 billion for an operating budget (30% of $98 billion)
according to industry standard property management fees.
Critics like Douglas McCauley argue that market-based conservation strategies do not work. He
argues “market-based mechanisms for conservation are not a panacea for our current conservation
ills”; however, ecosystem services bridge the gap between pragmatic economics and optimistic
environmentalism [17]. Assuming that the goal of ecosystem service valuation is to prove that “nature
is only worth conserving when it is, or can be made profitable” is in fact the opposite of the purpose of
this type of analysis [17]. Until our collective mindset develops to place value on unimpaired nature
such that conservation and preservation are considered moral imperatives, ecosystems services are a
tool that can be used to justify protecting our environment.
5. Conclusions
In this paper we present a valuation of the United States National Parks from an ecological
economics perspective. We used a simple direct benefits transfer approach using biome values from
the TEEB database and landcover measures from the USGS National Land Cover Dataset to estimate
the value of the ecosystem services of the 46 National Parks in the contiguous United States to estimate
the annual value of ecosystem services provided by the lands within the United States National Park
System. Our estimate of $98 billion/year is a holistic aggregate estimate of the provisioning, regulating,
supporting, and cultural services provided by the functioning ecosystems of the parks. This estimate
is surprisingly consistent with an entirely independent and methodologically distinct estimate of $62
billion/year derived from surveys of the American public that asked how much additional taxes
they would be willing to pay for the parks [4]. If the natural capital ‘asset’ of infrastructure that is
our national park system had a budget comparable to a piece of commercial real estate of this value,
the annual budget of the National Park Service would be roughly an order of magnitude larger at
something closer to $30 billion rather than $3 billion. We do not make estimates of this nature to
commodify our natural treasures. We make these estimates because our failure to consider the total
value of ecosystem services provided by the National Parks enables our inability to quantify and
appreciate the contributions our parks make to our environment, economy, and society. These kinds of
oversights allow us to continue to underfund a valuable part of our natural capital and consequently
damage our supporting environment, national heritage, monetary economy, and many of our diverse
cultures. Ecological economics argues for several specific changes to the dominant economic paradigm
including changing the degree to which we invest in the stewardship of our collectively held natural
capital assets. Three guiding principles inform the broader level institutional and policy changes we
argue are needed. First, we must live within planetary boundaries (e.g., there are limits to growth,
earth is a finite planet, etc.). Second, we must equitably distribute wealth and income throughout
space and time (e.g., meet a John Rawls ‘veil of ignorance’ test). Third, we must allocate resources
efficiently (e.g., traditional economics associated with maximizing utility through resource allocation).
Living within planetary boundaries is primarily an assessment of scientists who have expertise that
is relatively objective. In this area Richard Feynman’s quote seems appropriate: “Reality must take
precedence over public relations, for nature cannot be fooled” [32,33]. The current scientific consensus
suggests we are failing to meet the standard of the first principle. Equitable distribution is a messier
question involving public relations and social negotiations. A growing literature on the negative
consequences of inequality [34,35] and social movements (e.g., Occupy Wall Street, The Women’s
March, Black Lives Matter) suggests we are also failing to meet the standard of the second principle.
The third principle of optimal allocation is working in a limited way through the dominant economic
paradigm; however, it also fails because it is not subservient to the first two principles and results in
inadequate resource valuation, misallocation, short-termism, and unacceptable levels of inequality
and poverty [5,31]. Recognizing the ecosystem service value of our national parks and increasing theLand 2019, 8, 54 12 of 17 budget of the NPS to support and maintain the parks and monuments is a small step we could make towards living within the guiding principles of ecological economics. This would also be a significant step towards many of the visions of a ‘green new deal’. Our National parks are a significant element of the fundamental supporting environment that our society, economy and our very lives depend on. Increased funding of our National Parks will not only create jobs that sustain and preserve these significant values but will also help us chart a path to a more sustainable and desirable future. Author Contributions: Conceptualization, P.C.S, S.L.D., and S.J.A.; methodology, S.L.D., and S.J.A.; validation, P.C.S; data curation, P.C.S.; writing—original draft preparation, S.L.D.; writing—review and editing, P.C.S and S.J.A.; visualization, S.L.D. and S.J.A.; supervision, P.C.S; project administration, P.C.S. Funding: This research received no external funding. Conflicts of Interest: The authors declare no conflict of interest.
Land 2019, 8, 54                                                                                                                                                                                     13 of 17

Appendix A
                                                     Table A1. Detailed National Park biome extent and ecosystem service value.
                                                                                                                                                                                 Park Area      Park Area
        UNIT_NAME         Water       Ice/Rock    Urban       Forest       Grass/Rangeland   Tidal Marsh/Mangroves     Swamp/Floodplains   Desert        Tundra       Cropland
                                                                                                                                                                                  (pixels)      (hectares)
  Acadia                      5411           0      9292       123,491                2973                   14,547                4359       1128         13,237            0        174,438      15,699.42
  Arches                       129           0      1945          3649                8489                     3381                   0      33,342       292,866            0       343,801       30,942.09
  Badlands                     667           0      8670          3417             454,772                      260                  59     620,891           364         5528      1,094,628      98,516.52
  Big Bend                     592           0     13,617       61,261                 708                     9107                 852      21,574      3,541,998        2525      3,652,234    328,701.06
  Biscayne                 563,075           0        87          1617                   0                   31,414             157,966             0             6          0       754,165       67,874.85
  Black Canyon of the
                               274           0        74        93,569                1232                       15                   0        270         45,556            0       140,990        12,689.1
  Gunnison
  Bryce Canyon                    0          0      3324       110,872                1131                      189                   0      23,705        22,602            0       161,823       14,564.07
  Canyonlands               22,003           0            0     74,053              35,496                   22,470                 385     249,960      1,101,548          95      1,506,010      135,540.9
  Capitol Reef                  30           0      3951       127,690              83,286                      871                   0     294,068       587,753            0      1,097,649      98,788.41
  Carlsbad Caverns                0          0       751        39,720                4039                        0                   0         12        165,833           56       210,411       18,936.99
  Channel Islands          533,575           0      3099          6283             249,625                       63                3891      11,180       293,751            0      1,101,467      99,132.03
  Congaree                    1012           0       296          6257                 185                  100,543                 746             0          13            5       109,057        9815.13
  Crater Lake               58,536           0      7589       673,537                6422                        0                   0      40,132        31,179            0       817,395       73,565.55
  Cuyahoga Valley             2707           0     18,174      108,180                8444                     9539                 107         44            298         2721       150,214       13,519.26
  Death Valley                  51           0     33,476      361,922              30,894                     2803                  13     722,864     14,140,625         205    15,292,853    1,376,356.77
  Dry Tortugas             259,100           0            5            0               63                       123              19,142        131                0        112       278,676       25,080.84
  Everglades              2,307,344          0      9504        20,944              11,639                 1,925,627           2,622,794      1554         16,916         2148      6,918,470      622,662.3
  Glacier                  117,536       46,159     7964      2,741,088            107,346                     2675                 537     468,561      1,040,579           0      4,532,445    407,920.05
  Grand Canyon              35,140           0     12,811     1,105,126            134,396                     8640                2033     734,016      3,397,942         104      5,430,208    488,718.72
  Grand Teton              142,499        4433     10,756      464,974             233,968                   29,401              31,702      56,384       419,326            6      1,393,449    125,410.41
  Great Basin                   32        1157       992       292,141                5744                      156                   5      27,871        19,006            0       347,104       31,239.36
  Great Sand Dunes             255           0      1855        13,014              17,536                     5257                6377      97,435       222,017           84       363,830        32,744.7
  Great Smoky Mountains     18,391           0     21,367     2,269,789             10,720                     1188                   0        773           8657          510      2,331,395    209,825.55
  Guadalupe Mountains             8          0       952        85,301                3483                        0                   0      17,677       287,759            0       395,180        35,566.2
  Hot Springs                     5          0      1715        22,670                 174                        0                   0         34                0          0        24,598        2213.82
  Isle Royale             1,870,766          0            0    448,294                 245                  121,032                9222       8189         13,782            0      2,471,530      222,437.7
  Joshua Tree                     0          0     12,621         5652              59,573                        0                   0     231,209      3,258,161           0      3,567,216    321,049.44
  Kings Canyon              23,516        2385      3785       581,351             111,260                      283                2238     767,848       572,189           26      2,064,881    185,839.29
  Lassen Volcanic             8664           0      5657       345,800                1019                        0                 827      24,702        95,830            0       482,499       43,424.91
Land 2019, 8, 54 14 of 17
Table A1. Cont.
Park Area Park Area
UNIT_NAME Water Ice/Rock Urban Forest Grass/Rangeland Tidal Marsh/Mangroves Swamp/Floodplains Desert Tundra Cropland
(pixels) (hectares)
Mammoth Cave 2182 0 573 221,925 1252 4695 187 0 37 0 230,851 20,776.59
Mesa Verde 79 0 2766 79,019 24,608 764 22 177 133,929 0 241,364 21,722.76
Mount Rainier 7031 126,222 8714 666,369 26,864 8912 82 88,538 125,016 0 1,057,748 95,197.32
North Cascades 7252 105,505 1158 1,103,359 245,528 6788 326 393,359 389,693 0 2,252,968 202,767.12
Olympic 75,640 152,584 11,437 3,254,129 57,632 56,695 1876 212,356 288,264 0 4,110,613 369,955.17
Petrified Forest 182 0 5804 17 117,151 468 28 2182 877,467 44 1,003,343 90,300.87
Redwood 34,301 0 14,380 439,656 8977 2756 1151 6289 11,971 504 519,985 46,798.65
Rocky Mountain 3115 152,940 10,514 672,286 164,871 13,775 4028 166,024 12,677 0 1,200,230 108,020.7
Saguaro 37 0 4402 92,035 168 7 0 220 323,342 0 420,211 37,818.99
Sequoia 9923 368 5913 841,408 75,860 0 1981 462,970 431,691 0 1,830,114 164,710.26
Shenandoah 5 0 22,694 846,030 127 0 0 217 0 1 869,074 78,216.66
Theodore Roosevelt 3561 0 4577 62,324 174,027 9049 3090 20,104 36,641 3111 316,484 28,483.56
Voyageurs 330,347 0 609 420,308 384 116,484 41,793 0 9809 35 919,769 82,779.21
Wind Cave 0 0 2317 38,807 60,730 0 122 0 25,374 0 127,350 11,461.5
Yellowstone 465,177 351 29,519 4,541,815 926,547 79,247 178,931 31,545 3,636,782 0 9,889,914 890,092.26
Yosemite 31,871 2380 14,152 1,687,611 118,943 33 15,992 567,413 913,173 24 3,351,592 301,643.28
Zion 0 0 4657 330,871 329 722 49 108,461 220,778 0 665,867 59,928.03
Total Pixel Count 6,942,021 594,484 338,515 25,489,631 3,588,860 2,589,979 3,112,913 6,515,409 37,026,437 17,844 86,216,093 86,216,093
Area in Hectares 624,782 53,504 30,466 2,294,067 322,997 233,098 280,162 586,387 3,332,379 1606 7,759,448 7,759,448
*I pixel = 900 m2 = 0.09 Ha
Area in square kilometers
6248 535 305 22,941 3230 2331 2802 5864 33,324 16 77,594 77,594
(km2 )Land 2019, 8, 54 15 of 17
Appendix B
Table A2. Land cover reclassification scheme and corresponding ESV.
Land Cover Type Biome Type ESV (2016$/ha/yr)
Water Water 14,639
Perennial Ice/Snow Ice/Rock 0
Developed, Open Space Urban 7793
Developed, Low Intensity Urban 7793
Developed, Medium Intensity Urban 7793
Developed, High Intensity Urban 7793
Barren Land Desert 0
Deciduous Forest Forest 4446
Evergreen Forest Forest 4446
Mixed Forest Forest 4446
Shrub/Scrub Grass/Rangeland 4874
Grassland/Herbaceous Grass/Rangeland 4874
Pasture/Hay Grass/Rangeland 4874
Cultivated Crops Cropland 6513
Woody Wetlands Tidal Marsh/Mangrove 226,796
Emergent Herbaceous Wetlands Swamps/Floodplains 30,047
All dollar values were converted to 2016 dollars using the Bureau of Labor Statistics website.
We used the conversion factor of 1.17 for every 2007 dollar. (https://www.bls.gov/data/inflation_
calculator.htm last accessed 3/24/2019)
Source for original ecosystem biomes 2007 U.S. dollars [7].
References
1. TEEB. The Economics of Ecosystems and Biodiversity: Mainstreaming the Economics of Nature: A Synthesis
of the Approach, Conclusions and Recommendations of TEEB. 2010. Available online: http://www.teebweb.
org/ (accessed on 27 October 2018).
2. Pitman, S.D.; Daniels, C.B.; Sutton, P.C. Characteristics associated with high and low levels of ecological
literacy in a western society. Int. J. Sustain. Dev. World Ecol. 2018, 25, 227–237. [CrossRef]
3. PBS. 2016. Available online: http://www.pbs.org/nationalparks/ (accessed on 14 December 2018).
4. Cullinane Thomas, C.; Koontz, L.; Cornachione, E. 2017 National Park Visitor Spending Effects:
Economic Contributions to local Communities, States, and the Nation; Natural Resource Report
NPS/NRSS/EQD/NRR—2018/1616; National Park Service: Fort Collins, CO, USA, 2018. Available
online: https://www.nationalparks.org/sites/default/files/NPS-TEV-Report-2016.pdf (accessed on
14 December 2018).
5. Costanza, R.; Cumberland, J.H.; Daly, H.; Goodland, R.; Norgaard, R.B.; Kubiszewski, I.; Franco, C. An
Introduction to Ecological Economics, 2nd ed.; CRC Press: Boca Raton, Fl, USA, 2011.
6. Costanza, R.; D’Arge, R.; De Groot, R.; Farber, S.; Grasso, M.; Hannon, B.; Limburg, K.; Naeem, S.;
O’Neill, R.V.; Paruelo, J.; et al. The value of the world’s ecosystem services and natural capital. Nature 1997,
387, 253–260. [CrossRef]
7. Costanza, R.; De Groot, R.; Sutton, P.; Van Der Ploeg, S.; Anderson, S.J.; Kubiszewski, I.; Farber, S.; Turner, R.K.
Changes in the Global Value of Ecosystem Services. Glob. Environ. Chang. 2014, 26, 152–158. [CrossRef]
8. Costanza, R.; de Groot, R.; Braat, L.; Kubiszewski, I.; Fioramonti, L.; Sutton, P.; Farber, S.; Grasso, M. Twenty
years of ecosystem services: how far have we come and how far do we still need to go? Ecosyst. Serv. 2017,
28, 1–16. [CrossRef]
9. Sutton, P. Space matters: Exploring problematic spatial issues in the valuation of ecosystem services. In
Valuing Ecosystem Services: Methodological Issues and Case Studies; Ninan, K.N., Ed.; Edward Elgar Publishing:
Cheltenham, UK, 2014; pp. 132–147.
10. Sutton, P.C.; Anderson, S.J.; Costanza, R.; Kubiszewski, I. The ecological economics of land degradation:
Impacts on ecosystem service values. Ecol. Econ. 2016, 129, 182–192. [CrossRef]Land 2019, 8, 54 16 of 17
11. Pitman, S.D.; Daniels, C.B.; Sutton, P.C. Ecological literacy and socio-demographics: who are the most
eco-literate in our community, and why? Int. J. Sustain. Dev. World Ecol. 2018, 25, 9–22. [CrossRef]
12. de Groot, R.; Brander, L.; van der Ploeg, S.; Costanza, R.; Bernard, F.; Braat, L.; Christie, M.; Crossman, N.;
Ghermandi, A.; Hein, L.; et al. Global estimates of the value of ecosystems and their services in monetary
units. Ecosyst. Serv. 2012, 1, 40–61. [CrossRef]
13. Costanza, R.; Hart, M.; Kubiszewski, I.; Posner, S. Lessons from the History of GDP in the Effort to Create
Better Indicators of Prosperity, Well-being, and Happiness. In Routledge Handbook of Sustainability Indicators;
Routledge: Abingdon, UK, 2018; pp. 147–153.
14. Díaz, S.; Pascual, U.; Stenseke, M.; Martín-López, B.; Watson, R.T.; Molnár, Z.; Hill, R.; Chan, K.M.A.;
Baste, I.A.; Brauman, K.A.; et al. Assessing nature’s contributions to people. Science 2018, 359, 270–272.
[CrossRef] [PubMed]
15. de Groot, R.; Costanza, R.; Braat, L.; Brander, L.; Burkhard, B.; Carrascosa, J.L.; Egoh, B.; Geneletti, D.;
Hansjuergens, B.; Hein, L.; et al. Ecosystem Services are Nature’s Contributions to People: Response to:
Assessing nature’s contributions to people. Sci. Prog. 2018, 359, 6373.
16. Daly, H.E.; Farley, J.C. Ecological Economics: Principles and Applications, 2nd ed.; Island Press: Washington, DC,
USA, 2011.
17. Mccauley, D.J. Selling out on Nature. Nature 2006, 443, 27–28. [CrossRef] [PubMed]
18. A Call to Action. 2016. Available online: https://www.nps.gov/calltoaction/ (accessed on 25 August 2018).
19. Duncan, S.; Sutton, P.C. An Ecosystem Service Valuation of Yellowstone and Grand Teton National Parks.
Presented at the USSEE Conference Macalaster College, Saint Paul, MN, USA, 25–28 June 2017.
20. Homer, C.G.; Dewitz, J.A.; Yang, L.; Jin, S.; Danielson, P.; Xian, G.; Coulston, J.; Herold, N.D.; Wickham, J.D.;
Megown, K. Completion of the 2011 National Land Cover Database for the conterminous United
States-Representing a decade of land cover change information. Photogramm. Eng. Remote Sens. 2015,
81, 345–354.
21. Anderson, S.; Giordano, A.; Costanza, R.; Kubiszewski, I.; Sutton, P.; Maes, J.; Neale, A. 5.7.2. National
ecosystem service mapping approaches. In Mapping Ecosystem Services; Pensoft Publishers: Sofia, Bulgaria,
2017; p. 237.
22. Burhard, B.; Maes, J. Mapping Ecosystem Services; Advanced Books; Pensoft Publishers: Sofia, Bulgaria, 2017.
[CrossRef]
23. Wickham, J.; Stehman, S.V.; Gass, L.; Dewitz, J.A.; Sorenson, D.G.; Granneman, B.J.; Poss, R.V.; Baer, L.A.
Thematic accuracy assessment of the 2011 National Land Cover Database (NLCD). Remote Sens. Environ.
2017, 191, 328–341. [CrossRef]
24. National Park Service. 2008 Director’s Report; National Park Service, U.S. Department of the Interior:
Washington, DC, USA, 2009.
25. Sutton, P.C.; Anderson, S.J. Holistic valuation of urban ecosystem services in New York City’s Central Park.
Ecosyst. Serv. 2016, 19, 87–91. [CrossRef]
26. Haefele, M.; Loomis, J.; Bilmes, L.J. Total Economic Valuation of the National Park Service Lands and
Programs: Results of a Survey of The American Public. 2016. Available online: https://www.nationalparks.
org/sites/default/files/NPS-TEV-Report-2016.pdf (accessed on 26 October 2018).
27. IPCC: Climate Change 2013: The Physical Science Basis. Contribution of Working Group I to the Fifth Assessment
Report of the Intergovernmental Panel on Climate Change; Stocker, T.F.; Qin, D.; Plattner, G.-K.; Tignor, M.;
Allen, S.K.; Boschung, J.; Nauels, A.; Xia, Y.; Bex, V.; Midgley, P.M. (Eds.) Cambridge University Press:
Cambridge, UK, 2013.
28. MEA: Millennium Ecosystem Assessment (Program). Ecosystems and Human Well-Being; Island Press:
Washington, DC, USA, 2005.
29. United Nations Environment Programme. Global Environment Outlook GEO 5: Environment for the Future We
Want; United Nations Environment Program: Nairobi, Kenya, 2012.
30. Lovins, H.; Stewart, W.; Wijkman, A.; Fullerton, J. A Finer Future: Creating an Economy in Service to Life; New
Society Press: Vancouver, BC, Canada, 2018.
31. Jadhav, A.; Anderson, S.; Dyer, M.J.; Sutton, P.C. Revisiting ecosystem services: Assessment and valuation as
starting points for environmental politics. Sustainability 2017, 9, 1755. [CrossRef]
32. Feynman, R. Appendix F: Personal Observations on the Reliability of the Shuttle. PCSSCA. Volume 11, p. F5.
Available online: https://www.refsmmat.com/files/reflections.pdf (accessed on 14 December 2018).Land 2019, 8, 54 17 of 17
33. Feynman, R. What do you Care What Other People Think? Further Adventures of a Curious Character; W. W.
Norton (US): New York, NY, USA, 1988; p. 237.
34. Wilkinson, R.G.; Pickett, K. The Spirit Level: Why Greater Equality Makes Societies Stronger; Bloomsbury Press:
New York, NY, USA, 2010.
35. Piketty, T. Capital in the Twenty-First Century; The Belknap Press of University Press: Cambridge, MA,
USA, 2014.
© 2019 by the authors. Licensee MDPI, Basel, Switzerland. This article is an open access
article distributed under the terms and conditions of the Creative Commons Attribution
(CC BY) license (http://creativecommons.org/licenses/by/4.0/).You can also read