VARIETY GUIDE 2020/2021 Southern Region - Sugar Research Australia
←
→
Page content transcription
If your browser does not render page correctly, please read the page content below
VARIETY GUIDE 2020/2021 Southern Region
HOW TO USE THIS GUIDE
This guide is designed to help growers in the Southern canegrowing region with their
agronomic considerations when selecting new varieties to plant and trial on their farms.
The information comes from the best available data of regional variety performance and
disease ratings. The information in the tables will help you understand:
New & recent varieties available in the Southern region 3
Disease resistance 5
Smut ratings 6
Pachymetra ratings 7
Harvest management 8
Variety by herbicide screening trials 10
Variety adoption in each mill area 12
Sugarcane Biosecurity Zone map 16
Propagating new varieties 17
Planting and managing tissue-cultured plantlets in the field 18
WANT TO KNOW WHAT IS HAPPENING
IN THE OTHER REGIONS?
You can find all the regional variety guides on the
SRA website sugarresearch.com.au
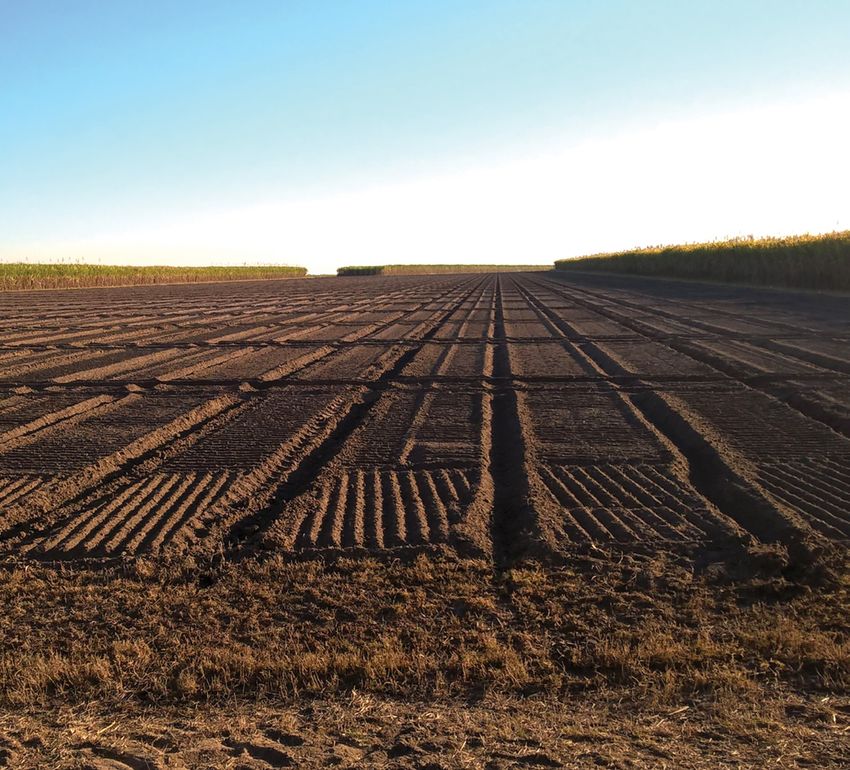
(Cover page) Prepared trial site for SRA Variety trial in 2018 on Darryl Rapley’s farm in Childers.
ISSN 2208-7605 (Online) ISSN 2208-7591 (Print) © Copyright 2020 by Sugar Research Australia Limited. All rights reserved. No part
of the Variety Guide 2020/21 Southern Region (this publication), may be reproduced, stored in a retrieval system, or transmitted
in any form or by any means, electronic, mechanical, photocopying, recording, or otherwise, without the prior permission of Sugar
Research Australia Limited. Sugar Research Australia Limited acknowledges and thanks its funding providers, including levy payers
(sugarcane growers and millers), the Commonwealth Government, and the Queensland Government (Department of Agriculture
and Fisheries). Disclaimer: In this disclaimer a reference to ‘SRA’, ‘we’, ‘us’ or ‘our’ means Sugar Research Australia Limited and our
directors, officers, agents and employees. Although we do our very best to present information that is correct and accurate, we make
no warranties, guarantees or representations about the suitability, reliability, currency or accuracy of the information we present in
this publication, for any purposes. Subject to any terms implied by law and which cannot be excluded, we accept no responsibility for
any loss, damage, cost or expense incurred by you as a result of the use of, or reliance on, any materials and information appearing
in this publication. You, the user, accept sole responsibility and risk associated with the use and results of the information appearing
in this publication, and you agree that we will not be liable for any loss or damage whatsoever (including through negligence) arising
out of, or in connection with the use of this publication. We recommend that you contact our staff before acting on any information
provided in this publication. Warning: Our tests, inspections and recommendations should not be relied on without further,
independent inquiries. They may not be accurate, complete or applicable for your particular needs for many reasons, including (for
example) SRA being unaware of other matters relevant to individual crops, the analysis of unrepresentative samples or the influence
of environmental, managerial or other factors on production.
NEW & RECENT VARIETIES
       AVAILABLE IN THE SOUTHERN REGION

Variety Recommendation and                             and Prod Services from Bundaberg, Isis,
Release Process                                        Maryborough and Rocky Point mill areas,                      If you would like more information
                                                       in total 12 voting members. Rocky Point                      on new variety release and
Regional Variety Committees (RVC) are                  also sits on the RVC in NSW as an observer.                  regional variety committees,
responsible for variety release decisions.             The Southern RVC requires a majority vote                    please visit the SRA website:
SRA supports these groups with secretariat             for progression of a variety through the                     sugarresearch.com.au/growers-
support and the provision of technical                 breeding program and a majority vote for
                                                                                                                    and-millers/varieties/regional-
information to assist the committee to                 the release of a variety.
                                                                                                                    variety-committees/
make decisions on particular varieties.
RVCs are composed of voting members
and observers to ensure transparency in
the decision making process. The Southern
RVC (Sugarcane Biosecurity Zone 4 and 5)
voting membership consists of one grower
representative, one miller representative

Presented below are the results of trials conducted in the Southern region. Yield (TCH) and
CCS for each new variety are compared with the trial results of various standard varieties.

Variety: SRA29               QS08-9474    Parentage: Q170 x QC90-289 / Summary: High tonnes cane, average CCS.

                              CROP                         YIELD (TCH)                                                   CCS                      # OF
 TRIAL HARVEST YEAR
                              CLASS       SRA29        Q208    A
                                                                     Q240    A
                                                                                 KQ228    A    SRA29         Q208    A
                                                                                                                               Q240A     KQ228A HARVESTS
  (2014 series FATs): 2015      Plant       105           95           83            99          17.1         17.1              16.5       16.9          4
                    2016         1R         116          118           115          116          16.4         16.4              16.2       16.9          4
                    2017         2R         106          106           109          110          16.3         16.6              16.3       16.7          4
                    2018         3R         106          105           121          104          16.3         16.3              16.5       16.8          3
 (2016 repeat FATs): 2017       Plant       109          100           100          105          15.4          16               15.9       15.8          5
                    2018         1R         104           91           98           100          14.7         14.7              15.1       15.3          5
                    2019         2R          87           81           81            82          14.3         14.3              14.7        15           5
 Overall Performance                        105           99           101          102          15.8         15.9             15.8        16.1         30
 Available 2021
                                         Reliable germination, good disease resistance. Resistant to Fiji , Pachymetra, Leaf Scald and Mosaic. Intermediate
 Comments:
                                         resistant to Smut.

 Variety: SRA20A             QS07-8815    Parentage: QN86-5279 x QS91-7008 / Summary: High tonnes cane, lower CCS.

                              CROP                         YIELD (TCH)                                                   CCS                      # OF
 TRIAL HARVEST YEAR
                              CLASS      SRA20    A
                                                       Q208    A
                                                                     Q240    A
                                                                                 KQ228    A
                                                                                               SRA20    A
                                                                                                             Q208    A
                                                                                                                               Q240A     KQ228A HARVESTS
 (2013 series FATs) : 2014      Plant        80           68           68            68          13.4         14.2              14.5       14.2          4
                    2015         1R          96           86           89            87          15.8         17.0              17.1       17.1          4
                    2016         2R         102           91           100           95           16          17.2              17.0       17.3          4
                    2017         3R          93           95           93            93          14.1         15.3              14.9       15.1          2
 (2015 repeat FATs): 2016       Plant       155          126           140          137          14.5         15.9              15.9       16.5          4
                    2017         1R         126          118           123          123          14.0         15.2              15.1       15.5          4
                    2018         2R          92           88           99            94          14.4         15.3              15.9       15.8          4
 Overall Performance                        107           96           102          100          14.6         15.8              15.8       16.0         26
 Available 2020
                                         Slow and reliable germination, good disease resistance. Resistant to Smut and Pachymetra, intermediate resistant to
 Comments:
                                         Fiji and Leaf Scald. Good fibre quality trends and good fibre content.

                                                                                                                         VARIETY GUIDE 2020/2021 Southern Region   3
Variety: SRA19A             QN02-1707    Parentage: QN86-640 x QN90-252 / Summary: High tonnes cane, lower CCS.

                                  CROP                         YIELD (TCH)                                               CCS                        # OF
     TRIAL HARVEST YEAR
                                  CLASS      SRA19A        Q208A         Q240A       KQ228A        SRA19A        Q208A         Q240A       KQ228A HARVESTS
      (2011 series FATs): 2012     Plant        117           91           109          102          15.0         15.7          15.7         15.8           4
                        2013        1R          120          101           116          105          16.3         17.1          17.2          17            4
                        2014        2R          116          108           121          111          15.4         16.2          16.1         16.1           4
                        2015        3R          116          115           125          117          16.6         18.0          17.5         17.7           3
                        2016        4R          122          115           136          118          17.5         18.7          18.0         18.4           1
     (2013 repeat FATs): 2014      Plant         86           78           77            77          12.6         13.6          13.9         13.8           5
                        2015        1R          100           93           92            92          14.4         15.8          16.1         16.3           5
                        2016        2R          104           96           104           99          15.0         16.5          16.5         16.8           5
                        2017        3R           92           95           93            93          13.9         15.3          14.9         15.1           2
     Overall Performance                        107           97           105           99          15.0        16.00          16.0         16.1          33
     Available 2020
                                             Maintains productivity in ratoons. It has been tested until 4th ratoon. Resistant to Pachymetra Root Rot and Leaf
     Comments:
                                             Scald and intermediate resistant to Smut and Fiji.

    SRA29                                                SRA20A                                               SRA19A

                                                                                                                  For more information on
                                                                                                                  variety field trials contact:
                                                                                                                  Southern Variety Officer Marija Tromp
                                                                                                                  E mtromp@sugarresearch.com.au
                                                                                                                  M 0467 709 572

4   VARIETY GUIDE 2020/2021 Southern Region
DISEASE RESISTANCE

Disease has the potential to lower the performance of varieties on your farm. This table will
help you select varieties given the diseases that may be present on your farm.

 Southern Disease Ratings

                  MILL AREA     FIJI LEAF                 LEAF                 CHLOROTIC ORANGE BROWN         YELLOW                PACHY-
VARIETY                                     MOSAIC                   SMUT                             RED ROT
                RECOMMENDED       GALL                   SCALD                  STREAK    RUST   RUST          SPOT                 METRA
 SRA29              B, I, M        R          R             R           I           U          U      U         U           U           R
 SRA20 A            B, I, M         I         R             I          R            U          U      U         R           U           R
 SRA19      A       B, I, M         I         R             R           I           U          R      U         U            I          R
 SRA11 A          B, I, M, RP      R          R             R          R            U          R      U          I          U           R
 SRA4 A           B, I, M, RP      R          R             R           I           U          R      U         R            I         I-R

 SRA2A            B, I, M, RP      R           I            R           I           U           I     U         R           U           R
 SRA1   A          B, I, RP         I         R             R           I           U          R      R          I          U           I
 Q252A            B, I, M, RP       I         R             R           I           U          R      U         R            I          I
 Q249A            B, I, M, RP      R          I-R           R          R            U          R      U         I-R         R           I
 Q247A               B, I          R          R             R           I           U          R      U         R           S           R
 Q245A            B, I, M, RP      R          R             R          R            U          R      U         S           R           R
 Q242A            B, I, M, RP      R          R             R           I           I          R      U         I-R         R           R
 Q240 A           B, I, M, RP      I-S        R             R          R           I-R         R      U         R            I          I
 Q238   A         B, I, M, RP      I-R        R             R          R            S          R      R         I-R         S           R
 Q235A            B, I, M, RP      R          R             R          R           I-S         I-R    U         R           R           R
 Q232A            B, I, M, RP       I         R             R          R            R          R      U         I-R         R           I
 KQ228 A          B, I, M, RP       I         R             R          R            S          R      R         R            I          I
 Q208 A           B, I, M, RP      I-S        R             R          I-R          R          R      R         R           R           I
 Q200 A              B, I           I         R             R          R            I          R      R         R           I-R         I
 Q183   A         B, I, M,RP       R          R             I          I-R          S          R      R          I          I-S         R
 Q151                B, I          R          R             R          R            U          R      R         I-R         U          I-S

 Q138             B, I, M, RP      R          I-S           R          I-S         I-R         R      R         I-S         I-S         R

Rotation of varieties is important in the           You will note that RSD resistance                           RESISTANT (R)
management of diseases. Arrange for                 ratings are not included in this variety                    INTERMEDIATE - RESISTANT (I-R)
                                                                                                                INTERMEDIATE (I)
your local productivity services officer            guide. Varietal resistance is not one
                                                                                                                INTERMEDIATE - SUSCEPTIBLE (I-S)
to inspect your farm for disease. The               of the three pillars of RSD disease                         SUSCEPTIBLE (S)
Diseases of Australian Sugarcane Field              management; growers should continue                         UNKNOWN (U)
Guide provides information on diseases              to ensure that disease-free seed cane
including how to identify and manage                                                                        B   BUNDABERG
                                                    is used to establish crops, that crops
                                                                                                            I   ISIS
them. The guide is available on the SRA             are planted into volunteer-free land                    M MARYBOROUGH
website sugarresearch.com.au.                       and equipment is decontaminated                         RP ROCKY POINT
                                                    regularly. SRA is reviewing methods for
                                                    screening varieties for RSD resistance.
                                                    Current ratings remain available on
                                                    QCANESelect ®. Current varieties are not
                                                    immune to RSD and some yield loss can
                                                    expected in all canes.

                                                                                                     VARIETY GUIDE 2020/2021 Southern Region       5
SMUT RATINGS
    Smut resistance ratings are calculated from the incidence and severity of infection compared
    to standard varieties in inoculated field trials. The graphic includes the rating and the 95%
    confidence interval for each variety. The confidence interval is influenced by factors such as the
    number of trials and the uniformity of smut infection. For example the variety SRA20A has been
    in three smut trials (P and 1R) and has a confidence interval from 1 to 3.4. Rating confidence will
    improve as more data is collected. SRA29 has been included in a fourth smut trial but the results
    are not presented here. Early indications are that the rating will remain as intermediate, with a
    lowering of the upper confidence limit from 7.0 to 6.1.

                         NUMBER OF TRIALS

                 Q138        9

                 SRA29       3

                SRA19A       4

                Q200A        28

                KQ228A       9

                 SRA2A       3

                 SRA1A       3

                Q247A        8

                Q252A        4

                Q208A        57
        CLONE

                Q242A        9

                Q232A        14

                 SRA4A       3

                Q238A        9

                Q183A        13

                 Q151        85

                SRA11A       4

                Q240A        12

                SRA20A       3

                Q245A        3

                Q249A        7

                                            1   2   3   4          5      6   7     8         9

                                                            SMUT RATING

                                                                                        RESISTANCE GROUP
                                                                                           RESISTANT
                                                                                           INTERMEDIATE

6   VARIETY GUIDE 2020/2021 Southern Region
PACHYMETRA RATINGS

Pachymetra resistance ratings are calculated from the severity of infection in a test clone
compared to standard varieties in inoculated bench trials. The graphic includes the rating and the
95% confidence interval for each variety. The confidence interval is influenced by factors such
as the number of times a variety has been tested and variability of Pachymetra infection within
each trial. For example the variety Q200A has been tested in 29 trials and has a narrow confidence
interval from 4.3 to 5.4 while the new variety SRA20A has only been tested in two Pachymetra
trials and ranges from 1.2 to 3.3. Rating confidence will improve as more data is collected.

                    NUMBER OF TRIALS

            Q151        5

           Q252A        4

           Q208A        8

           Q240A        3

           KQ228A       26

           Q200A        29

           Q232A        4

            SRA1A       3

           Q249A        2

           Q238A        4
   CLONE

            SRA29       2

            SRA4A       5

           SRA11A       3

           Q235A        3

            Q138        7

            SRA2A       4

           SRA20A       2

           Q245A        3

           Q247A        3

           Q242A        5

           SRA19A       3

           Q183A        4

                                       1   2   3    4        5         6   7            8          9

                                                   PACHYMETRA RATING

                                                                                             RESISTANCE GROUP
                                                                                                RESISTANT
                                                                                                INTERMEDIATE

                                                                               VARIETY GUIDE 2020/2021 Southern Region   7
HARVEST MANAGEMENT
Select varieties for a harvest plan that can be followed to maintain maximum CCS throughout
the year. The tables below indicate early, mid or late sugar varieties.
Bundaberg & Isis Harvest Management
VARIETY EARLY SUGAR MID SUGAR LATE SUGAR TRASHING LODGING
SRA29 Poor Good Good Free Average
SRA20 A Poor Average Good Free-Average Average
SRA19A Poor Average Good Average Average
SRA11 A Average Good Good Free Good
SRA4A Average Average Average Average Good
SRA2 A Good Good Good Free-Average Average
SRA1A Good Good Good Average Poor
Q252 A Good Good Good Free Average
Q249A Average Average Good Average Poor
Q247 A Poor Poor Poor Tight Average
Q245A Poor Average Average Average Average
Q242A Average Average Poor Average-Tight Poor
Q240A Good Good Good Free-Average Average
Q238A Poor Average Average Average Good
Q235 A Good Good Average Average Poor
Q232A Poor Average Poor Tight Poor
KQ228 A Good Good Average Average-Tight Average
Q208A Average Good Good Free Average
Q200 A Poor Average Good Free Average
Q183A Poor Average Good Free-Average Average
Q151 A Good Average Poor Average Average
Q138 Poor Poor Poor Average Average
Maximise your profit at harvest: SEASONAL SUGAR
AND LODGING
Selecting varieties for specific sugar
GOOD
maturity profiles, planting and harvesting AVERAGE
them for optimal CCS maturity can make LOW
a significant difference in the profit your POOR
UNKNOWN
crop can make for you. Making harvest
decisions based on in-field maturity
TRASHING
maximises profit making decisions.
FREE
FREE-AVERAGE
AVERAGE
AVERAGE-TIGHT
TIGHT
8 VARIETY GUIDE 2020/2021 Southern RegionMaryborough
VARIETY EARLY SUGAR MID SUGAR LATE SUGAR TRASHING LODGING
SRA29 Poor Good Good Free Average
SRA20 A Poor Average Good Free-Average Average
SRA19A Poor Average Good Average Average
SRA11 A Average Average Average Free Good
SRA4A Average Average Average Average Good
SRA2 A Good Good Good Free-Average Average
SRA1A Good Good Good Average Poor
Q252 A Good Good Average Free Average
Q249A Average Average Good Average Poor
Q242 A Average Average Average Average-Tight Poor
Q240A Good Good Good Free-Average Average
Q238A Poor Average Average Average Good
Q235A Good Good Average Average Poor
Q232A Poor Average Average Tight Average
KQ228 A Good Good Average Average-Tight Average
Q208A Average Good Good Free Average
Q138 Average Average Average Average Good
Rocky Point
VARIETY EARLY SUGAR MID SUGAR LATE SUGAR TRASHING LODGING
SRA11A Average Average Average Free Unknown
SRA4 A Average Average Average Average Unknown
SRA2A Good Good Average Free-Average Average
SRA1 A Good Good Good Average Average
Q252A Good Good Good Free Average
Q249 A Average Average Average Average Poor
Q245A Poor Average Average Average Unknown
Q242A Good Good Good Average-Tight Poor
Q240A Good Good Good Free-Average Average
Q238A Average Good Good Average Good
Q235A Good Good Average Unknown Poor
Q232 A Poor Average Average Tight Unknown
KQ228A Good Good Average Average-Tight Average
Q208A Good Good Good Free Average
Q183 A Average Good Good Free-Average Average
Q155A Good Good Good Unknown Unknown
Q138 Average Average Average Tight Unknown
VARIETY GUIDE 2020/2021 Southern Region 9VARIETY BY HERBICIDE SCREENING TRIALS
Sugarcane varieties are known to have variable responses to herbicides with some being more
impacted than others. As a result, data outlining susceptibility is critical to optimise productivity
outcomes.
Since 2014, SRA has been conducting In the pot trials, weekly phytotoxicity TABLE 1 EWRC selectivity rating scale
trials following a two-step process to ratings are conducted using the EWRC
obtain reliable data for the susceptibility (European Weed Research Council) rating NOTE SYMPTOMS SEVERITY
of varieties to herbicide scale (Table 1) and the aerial plant dry
biomass is measured 10 weeks after 1 No effect
• a fully randomised replicated pot
trial in year 1 to short list the most spraying. Very slight effects. Some stunting
2
and yellowing just visible
susceptible combinations of varieties In the field trials, plant cane yield is
and herbicides. Slight effects. Stunting and yellowing
measured at harvest using a weigh truck. 3
obvious, effects reversible
• a fully randomised replicated field
In all trials, KQ228 A is assessed and used 4
Substantial chlorosis and or stunting,
trial in year 2 to confirm that the most effects probably reversible.
as a reference susceptible variety to
shortlisted combinations have an
compare to other tested varieties. Strong chlorosis/stunting,
impact on yield. 5
thinning of stand. (50 % loss)
Tables 2 and 3 summarise all Increasing severity of damage
In year 3, the two-step process starts 6
phytotoxicity, biomass and yield results (70 % loss)
again with new combinations of newly
obtained in the pot and field trials from Increasing severity of damage
released varieties and herbicides. 7
2014 to 2020. These tables will be (85 % loss)
In these trials, products are applied updated yearly to include newly tested Increasing severity of damage
8
at their maximum label rate (and their combinations of varieties by herbicides. (90% loss) a few plants survive
minimum water label rate) when plant
9 Total loss of plants and yield
cane is at 4 to 6 leaf stage.
TABLE 2 Summary of phytotoxicity ratings and symptoms obtained on the reference susceptible variety KQ228A
2,4-D+ AMETRYN+
2,4-D AMETRYN TRIFLOXY AMICARBAZONE ASULAM DIURON FLUMIOXAZIN METOLACHLOR METRIBUZIN MSMA
IOXYNIL SULFURON
Slight
DESCRIPTION
Slight
SYMPTOM
Small white Small yellow Yellowing of Small white Bright yellowing Large
Slight yellow Large necrotic Small necrotic yellowing of
spotty spotty the whole spotty yellow of the necrotic
blotching lesions lesions the whole
discolorations discolorations plant discolorations blotching whole lesions
plant
plant
SYMPTOMS
PICTURE
NA
SEVERITY ON
SYMPTOMS
KQ228A
Medium to Medium
Mild Mild Mild Mild Medium Mild Severe Medium Mild
severe to severe
KQ228A PHYTO
RATING RANGE
1.2 to 1.9 1.2 1.8 to 3.2 1.3 1.3 to 1.5 1.1 to 2.6 1.8 3.9 to 4.1 1.1 to 2.8 1.2 to 1.8 1.7 to 3.5
NUMBER OF
TRIALS
5 1 4 1 3 5 1 2 5 5 5
MILD
MEDIUM
SEVERE
10 VARIETY GUIDE 2020/2021 Southern RegionTable 3 presents the herbicide symptoms yield was reduced by less than 10% KQ228A ’s response to metolachlor ranging
severity on the cane foliage on all tested compared to the untreated control. Cells from mild to severe depending on the year
varieties in a green to red scale (mild to with indicates varieties whose yield was and season it was trialled. Additionally,
severe symptoms due to the herbicide reduced by more than 10% compared to while visual symptoms might be seen in a
treatment compared to the untreated the untreated control (no yield loss was range of varieties trialled, in most cases no
control). Table 3 also presents the cane statistically significantly different to the yield loss is expected if the correct label
dry biomass measured 10 weeks after untreated control at P 0.05). rates are followed. However, a minor yield
spraying compared to the biomass of the loss might be expected in a variety such
Phytotoxicity symptoms and yield loss
untreated variety in a light to dark grey as SRA4 A when applying either MSMA or
observed on-farm may vary from those
scale (slight to severe biomass reduction asulam. The newer SRA11A variety is being
reported here, as severity of symptoms,
due to the herbicide treatment compared evaluated in the 2019-20 phytotoxicity
biomass and yield can vary depending
to the untreated control). Yield data from field trial to assess whether the biomass
on local environmental conditions
the field trials were also added to reductions observed in pot trials could
(temperature, humidity, soil moisture), the
Table 3 and the combinations of varieties translate into yield loss under field
condition of the crop (actively growing
by herbicide that were tested in the field conditions.
or stressed) and the weather conditions
are marked with the symbols or .
at the time of application, as was seen in
Cells with indicate varieties whose
TABLE 3 Phytotoxicity rating, biomass and yield difference compared to the untreated control of the same variety
AMETRYN+
2,4-D+ AMI- FLUMI- METOLA-
2,4-D AMETRYN TRIFLOXY- ASULAM DIURON METRIBUZIN MSMA
IOXYONIL CARBAZONE OXAZIN CHLOR
SULFURON
PHYTOTOXICITY
PHYTOTOXICITY
PHYTOTOXICITY
PHYTOTOXICITY
PHYTOTOXICITY
PHYTOTOXICITY
PHYTOTOXICITY
PHYTOTOXICITY
PHYTOTOXICITY
PHYTOTOXICITY
PHYTOTOXICITY
BIOMASS /YIELD
BIOMASS /YIELD
BIOMASS /YIELD
BIOMASS /YIELD
BIOMASS /YIELD
BIOMASS /YIELD
BIOMASS /YIELD
BIOMASS /YIELD
BIOMASS /YIELD
BIOMASS /YIELD
BIOMASS /YIELD
VARIETY
KQ228A
Q208A
Q232A
Q238A
Q240A
Q242A
Q249A
Q252A
SRA1A
SRA2A
SRA4 A
SRA11A
SRA19A
NO SYMPTOMS TO MILD PHYTOTOXICITY SYMPTOMS NO BIOMASS REDUCTION COMPARED TO UNTREATED
ON FOLIAGE SLIGHT BIOMASS REDUCTION COMPARED TO
MILD PHYTOTOXICITY SYMPTOMS ON FOLIAGE UNTREATED For more information contact:
MODERATE PHYTOTOXICITY SYMPTOMS ON FOLIAGE MODERATE BIOMASS REDUCTION COMPARED TO
SEVERE PHYTOTOXICITY SYMPTOMS ON FOLIAGE UNTREATED Senior Researcher
COMBINATION OF HERBICIDE BY VARIETY NOT TESTED SEVERE BIOMASS REDUCTION COMPARED TO Emilie Fillols
UNTREATED
COMBINATION OF HERBICIDE BY VARIETY TESTED IN T 07 4056 4510
FIELD TRIALS < 10% COMPARED TO UNTREATED
COMBINATION OF HERBICIDE BY VARIETY TESTED IN
FIELD TRIALS > 10% COMPARED TO UNTREATED
VARIETY GUIDE 2020/2021 Southern Region 11VARIETY ADOPTION IN EACH MILL AREA
Data below can be found in QCANESelect® under the regional reporting tab.
Use this information to assess yield performance of varieties over a number of years.
Caution should be taken when comparing commercial performance of newer varieties
(from plant and young ratoons) to older/established varieties (which include older ratoons).
Other
Q138
Bundaberg (% TONNES 2019)
Q232
Q18
In 2019, a total of 1,095,130 tonnes of
Q2
3
A
cane was harvested from 15,461 hectares
A
42
in the Bundaberg region. The Bundaberg
A
Mill area had an average yield of 70.8 Q2
tonnes of cane per hectare and an 52
A
average CCS of 14.62.
Q240 A - 33.3
Q240 A accounts for the majority of
Q23 A KQ228 A - 23.7
production in the Bundaberg region, 8 Q208 A - 15.3
increasing from 29% in 2018 to 33% in Q238 A - 7.2
2019. KQ228 A slightly decreased from Q252 A - 6.5
Q242 A - 5.5
25% to 24% of production between
Q183A - 4.0
2018 and 2019. Q208 A , Q242A and Q232 A - 2.1
Q208
A
Q232A declined slightly to 15%, Q138 - 1.1
5% and 2% respectively. Other - 1.3 Q2
4 0A
Q183A , Q208 A , Q240 A and Q252A
performed at or above mill average
for CCS in 2019.
228 A
KQ
(TCH & TSH 2019)
MILL AVG TSH (10.4)
MILL AVG TCH (70.8)
100 20
90 18
80 16
70 14
60 12
50 10
40 8
30 6
20 4
10 2
0 0
0A
8A
8A
3A
2A
2A
2A
8A
8
13
18
24
24
23
23
20
25
22
Q
Q
Q
Q
Q
Q
Q
Q
KQ
TONNES OF CANE PER HECTARE (TCH) TONNES OF SUGAR PER HECTARE (TSH)
12 VARIETY GUIDE 2020/2021 Southern RegionOther
Q232A
Isis (% TONNES 2019)
Q245
In 2019, a total of 971,582 tonnes of cane
Q2
A
42
was harvested from 13,184 hectares in
Q2
A
the Isis region. The Isis mill area had an
52
A
average yield of 73.7 tonnes of cane per
Q1
hectare and an average CCS of 14.76. 8 3A
Q240 accounts for the majority of
A
Q240 A - 39.6
production in the Isis region, increasing KQ228 A - 15.8
Q208 A - 14.3
from 37% in 2018 to 40% in 2019.
Q238 A Q238 A - 8.5
KQ228 A , Q208 A , and Q183A all declined Q183A - 7.1
to 16%, 14%, and 7% respectively. Q252 A - 5.1
Q242 A - 3.4
Q183A , Q208 A , Q240 A and Q252A Q245A - 3.4
performed at or above mill average Q232 A - 1.0
for CCS in 2019. Other - 1.8
08
A
Q2
Q2
4
0
A
28 A
KQ2
(TCH & TSH 2019)
MILL AVG TSH (10.9)
MILL AVG TCH (73.7)
100 20
90 18
80 16
70 14
60 12
50 10
40 8
30 6
20 4
10 2
0 0
0A
8A
8A
3A
5A
2A
2A
2A
8A
18
24
24
24
23
23
20
25
22
Q
Q
Q
Q
Q
Q
Q
Q
KQ
TONNES OF CANE PER HECTARE (TCH) TONNES OF SUGAR PER HECTARE (TSH)
VARIETY GUIDE 2020/2021 Southern Region 13KQ228 A
Q249A
Maryborough (% TONNES 2019)
Other
Q2
In 2019, a total of 592,216 tonnes of cane
Q2
48
was harvested from 9,603 hectares in the
42
A
A
Maryborough region. The Maryborough Q1
3
Mill area had an average yield of 61.7 8
tonnes of cane per hectare and an Q2
32 A
average CCS of 14.32.
Q208 A - 33.5
Q208 A accounts for the majority of Q240 A - 32.3
production in the region but declined Q252 A - 10.9
Q232 A - 7.6
slightly from 40% of the total harvest in Q252 A Q138 A - 4.1
2018 to 33% in 2019. Q240 A increased Q242 A - 3.6
from 28% in 2018 to 32% in 2019. Q248 A - 1.3
Q249A - 1.2
Q208 A , Q240 A , Q252A and SRA1 A KQ228 A - 1.0
performed at or above mill average Other - 4.45 Q2
0 8A
for CCS in 2019.
A
4 0
Q2
(TCH & TSH 2019)
MILL AVG TSH (8.8)
MILL AVG TCH (61.7)
100 20
90 18
80 16
70 14
60 12
50 10
40 8
30 6
20 4
10 2
0 0
0A
8A
8A
8A
8A
2A
2A
9A
2A
A
8A
A1
13
24
24
24
24
23
23
20
25
22
SR
Q
Q
Q
Q
Q
Q
Q
Q
Q
KQ
TONNES OF CANE PER HECTARE (TCH) TONNES OF SUGAR PER HECTARE (TSH)
14 VARIETY GUIDE 2020/2021 Southern RegionFor more information please visit:
sugarresearch.com.au
Rocky Point (% TONNES 2019)
Other
Q238
Q25
SR
In 2019, a total of 193,897 tonnes of cane
2A
A
A1
Q2
was harvested from 3,017 hectares in the
A
42
Rocky Point region. The Rocky Point Mill
A
Q1
had an average yield of 64.3 tonnes of 3 8A
cane per hectare and an average CCS of
13.58. Q232 A - 27.1
Q240 A - 21.2
Q18
Q232A remains the most dominant variety 3A Q208 A - 14.7
in 2019, accounting for 27% of the total KQ228 A - 10.0
Q183A - 7.4
harvest which is a decrease of 3% from
Q138 - 5.7
the previous year. Q240 A remained stable Q242 A - 4.5 Q232 A
at 21% of the crop and Q208 A increased SRA1 A - 2.5
KQ228
A
slightly to 15% of production. Q252 A - 2.2
Q238 A - 1.7
Q183A , Q208 A , Q240 A and Q252A Other - 2.9
performed at or above mill average for
CCS in 2019.
A
0 8
Q2
Q24 0
A
(TCH & TSH 2019)
MILL AVG TSH (8.7)
MILL AVG TCH (64.3)
100 20
90 18
80 16
70 14
60 12
50 10
40 8
30 6
20 4
10 2
0 0
0A
8A
8A
8A
3A
2A
2A
A
2A
8A
A1
13
18
24
24
23
23
20
25
22
SR
Q
Q
Q
Q
Q
Q
Q
Q
KQ
TONNES OF CANE PER HECTARE (TCH) TONNES OF SUGAR PER HECTARE (TSH)
VARIETY GUIDE 2020/2021 Southern Region 15SUGARCANE BIOSECURITY ZONE MAP
Far Northern
Biosecurity
Zone 1
Latitude: 11 degrees 49 minutes south
Weipa Far Northern
Biosecurity
Zone 2
Latitude: 13 degrees 45 minutes south
Coen Wood
f ord
sp
e ci
al
Cooktown Sugarcane
Biosecurity Zone 6:
Woodford special Nambour
Latitude: 26 degrees 50 minutes south
Sugarcane Cairns Bellthorpe
Biosecurity Zone 1:
Innisfail
Longitude: 152 degrees
Longitude: 152 degrees
Coen to Townsville
Peachester
Tully
Kilcoy
34 minutes east
53 minutes east
Georgetown
Ingham Woodford
Latitude: 19 degrees 15 minutes south
Mount Mee
Sugarcane Townsville Ayr
Latitude: 27 degrees
Biosecurity Zone 2: Charters Towers Bowen
Latitude: 19 degrees 53 minutes south 40 minutes south
Townsville to Abbot Point
Latitude: 20 degrees 33 minutes south
Richmond Collinsville
Mackay
Sugarcane
Biosecurity Zone 3:
Abbot Point to Rockhampton
Latitude: 23 degrees 27 minutes south Rockhampton
Gladstone
Bundaberg
Howard
Maryborough
Sugarcane
Biosecurity Zone 4: Nambour
Rockhampton to Victoria Point Kilcoy
Brisbane
Latitude: 27 degrees 37 minutes south Toowoomba
Sugarcane Rocky Point
Biosecurity Zone 5:
Condong
N
Victoria Point to NSW/QLD border
Broadwater
New South Wales Harwood
• All appliances (harvesters and • Machinery moving from NSW to Qld
other sugarcane machinery) moving requires a Plant Health Certificate
between sugarcane biosecurity issued by NSW Department of Primary
zones must: Industries.
> be free of cane trash and soil • Machinery inspections can be
> b
e inspected by an authorised arranged by contacting the local
inspection person who will issue a Productivity Service organisation.
Plant Health Assurance Certificate
• To move sugarcane plants (stalks,
(PHAC)
leaves, potted plants, etc) between
> b
e accompanied during biosecurity zones contact Biosecurity
transportation by the PHAC. Queensland (13 25 23).
16 VARIETY GUIDE 2020/2021 Southern RegionPROPAGATING NEW VARIETIES
Contact your local productivity services group for regional advice on varieties. They can supply
clean planting material of recommended varieties and place orders for tissue culture plantlets.
Isis Productivity Ltd: MSF Sugar Limited: Sugar Services Bundaberg: Rocky Point Productivity Services:
T 07 4126 1444 M 0487 017 811 T 07 4151 2555 T 07 5546 1481
Billet planting Tissue culture
Approved-seed provides cane growers with We’ve made it easier with our online tissue
disease-free seed of varieties that are true-to-type. culture calculator. It demonstrates the speed at
Disease-free seed (stalks, billets, setts or tissue CALCULATE HOW which large quantities of planting material can
PLANT MATERIAL culture plantlets used for planting) is a key control be produced from a set number of plantlets or
MUCH TISSUE
FROM AN measure for systemic diseases of sugarcane, for a set cost. Below is a look-up table including
CULTURE TO
APPROVED SEED including chlorotic streak, Fiji leaf gall, leaf scald, common results from the calculator (available at
ORDER
SOURCE mosaic, ratoon stunting disease (RSD) and smut. sugarresearch.com.au/calculator).
Provision of disease-free or approved-seed in
each mill area in the Australian sugar industry
is coordinated by SRA, in cooperation with the Tissue culture is an excellent source of clean seed
local productivity services group. SRA provides for all varieties and can help reduce the spread
a disease-free supply of DNA fingerprinted new of serious diseases such as RSD, smut and Fiji leaf
TRY TISSUE gall. Tissue-cultured plantings are more uniform
varieties. The local productivity services group CULTURE AS AN
multiplies the new varieties, maintaining the and produce more sticks than conventional
APPROVED CLEAN
disease-free status and distributes the approved- plantings so larger quantities of planting material
SEED SOURCE
seed to growers. are achieved the following year. This means earlier
commercial-scale production of more productive
new varieties can be achieved when using tissue
The block selected for growing plant material culture.
should be disease-free, weed-free and sugarcane
volunteer-free. When selecting cane for planting
GROW material the cane should be less than one year old, ORDER DEADLINE ORDER DEADLINE
SUGARCANE erect and free from damage. Plan for two or more STAGE FOR SPRING FOR AUTUMN
SPECIFICALLY eyes per sett when harvesting for billets or stick PLANTING PLANTING
FOR PLANTING planting. For non-irrigated regions plants should be
MATERIAL Grower finalises
well watered, have adequate nutrition immediately
prior to harvest for billet planting. For irrigated order. Productivity
15 November 1 July
regions you may need to reduce fertiliser rates, services group places
withhold irrigation or plant late in the season. The order with SRA.
cane should also have originated from an approved
seed plot and therefore be no more than three Productivity services
Delivery on agreed Delivery on agreed
years away from long hot water treatment. group receives
date between grower, date between grower,
established plantlets
productivity services productivity services
The best “whole farm” disease risk minimisation from nursery and
group and nursery. group and nursery.
and productivity strategies can be achieved distributes to
Available in August. Available in March.
through consistent access to clean seed. It is highly growers.
recommended that cane considered for use as
planting material be RSD tested well in advanced
of harvest so an informed choice can be made prior ESTIMATED COST AND TIME TO SCALE UP NEW VARIETY
to planting. PRODUCTION USING TISSUE CULTURE
No. plantlets ordered 100 250 500 1000
Rubber coating rollers and optimising the roller Yr
speeds to chopper speed will produce good quality Approximate cost $150 $375 $750 $1500
1
SET UP THE billets with minimal split or crushed ends and
damaged eyes. Reduce the speed of harvesting M row planted @ 0.8m 80 200 400 800
HARVESTER FOR
CUTTING HIGH and maintain sharp basecutter and chopper blades
M row available for planting 2400 6000 12000 24000
QUALITY for clean cutting. Disinfect the machinery used to Yr
SOUND BILLETS cut and plant new varieties to limit the spread of 2
Ha avail for planting @ 1.8m 0.4 1.1 2.2 4.3
disease and weeds.
For more information on tissue culture, contact:
SRA Tissue Culture Manager Clair Bolton E cbolton@sugarresearch.com.au T 07 3331 3374
VARIETY GUIDE 2020/2021 Southern Region 17PLANTING AND MANAGING
TISSUE-CULTURED PLANTLETS IN THE FIELD
Planting Fertiliser QCANESelect®
• Prepare soil to a fine tilth to ensure • Fertiliser requirements of the tissue • Using sugarcane varieties that
good soil/root contact. cultured plantlets are the same as for are best-suited to your farm may
billet plantings. help maximise productivity and
• A seedling planter can be used if one
profitability.
is available, although hand planting • If possible, plant with a planter mix to
small numbers is not a huge job. Plant maintain good early growth, and side- • To access QCANESelect ® and the
them deep at the bottom of a drill to dress later to avoid fertiliser burn. tissue culture calculator visit the SRA
prevent stool tipping. website sugarresearch.com.au
• Fill in after early growth. Weeds • Once you have identified the best
varieties for planting on your farm,
• Plant the plantlets 500 mm to 1 m Weed control is important for good contact your local productivity
apart. A good distance is 800 mm, establishment and growth. services group to place orders for
which will allow tillering to produce
• Ideally pre-irrigate the soil to tissue-cultured plantlets.
a high number of sticks.
germinate weeds, then apply a
knock-down herbicide or cultivate
Irrigating just prior to planting to reduce the
weed pressure on young plantlets.
• Provision of water is the most
critical factor for the successful • Allow at least one week after planting
establishment of tissue culture before applying pre-emergent
plantlets. herbicides, longer if planted into cold,
wet soils, as the root system needs
• Irrigate plantlets immediately after
time to establish:
planting and monitor them to ensure
they don’t dry out over the first tradex® at 2.5 kg/ha plus Dual
> A
three weeks to get the roots well Gold® at 1.5 L/ha has been
established. successfully applied over the top,
for grass and broadleaf weed control.
• If you do not have access to flood or
sprinkler irrigation a simple irrigation > D
o not use diuron as young plantlets
system can be set up using cheap drip are sensitive to this product.
tape and an in-line filter hooked up to
• Sempra® at 100 g/ha plus Activator
your garden tap or water tanker.
at 200 mL/100 L for nutgrass. Both
applications were sprayed over the
Insects top for nutgrass control.
• If you expect problems with insects • Do not use paraquat unless you
then an application of an insecticide have no other option and only on
drench (such as chlorpyrifos or established plantings.
imidacloprid) at planting will protect
the young plantlets.
• In canegrub-prone areas use your
standard grub control treatment.
18 VARIETY GUIDE 2020/2021 Southern RegionSugar Research Australia Limited ABN 16 163 670 068 Brisbane Office 50 Meiers Road, Indooroopilly QLD 4068 Australia Postal Address PO Box 86 Indooroopilly QLD 4068 Australia T 07 3331 3333 E sra@sugarresearch.com.au sugarresearch.com.au
You can also read