Visibility Driven Perception and Regulation of Air Pollution in Hong Kong, 1968-2020 - MDPI

Page created by Darrell Craig
 
CONTINUE READING
Visibility Driven Perception and Regulation of Air Pollution in Hong Kong, 1968-2020 - MDPI
environments

Article
Visibility Driven Perception and Regulation of Air Pollution in
Hong Kong, 1968–2020
Peter Brimblecombe

                                          Department of Marine Environment and Engineering, National Sun Yat-Sen University, Kaohsiung 80424, Taiwan;
                                          p.brimblecombe@uea.ac.uk

                                          Abstract: Visibility is a perceptible indicator of air pollution, so it is hardly surprising that it has
                                          been used to promote the regulation of air pollutants. In Hong Kong, poor visibility associated with
                                          air pollution has been linked with changes in tourist choices and health outcomes. Much research
                                          is available to examine the early deterioration of visibility in the city, and especially its relation to
                                          particulate sulfate. The period 2004–2012 saw especially poor visibility in Hong Kong and coincided
                                          with a time when pollutant levels were high. There is a reasonable correlation (multiple r2 = 0.57)
                                          between the monthly hours of low visibility (
Visibility Driven Perception and Regulation of Air Pollution in Hong Kong, 1968-2020 - MDPI
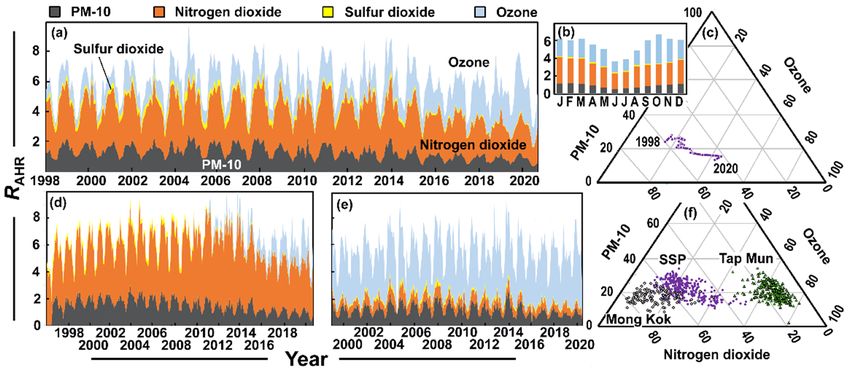
Environments 2021, 8, 51                                                                                                2 of 11

                           blue skies were related to air quality improvements under COVID-19 lockdowns [12] and
                           periods; with bushfire smoke in Sydney during December 2019 making improvements in a
                           COVID-19 plagued year seem especially dramatic [13].
                                  It may seem that visibility is a matter of aesthetics, yet it has been regarded as a serious
                           issue, notable in terms of the many legal battles between the USEPA and the Sierra Club
                           to maintain visibility in areas where air quality is higher than that required by national
                           secondary ambient air quality standards [14,15]. Visibility came to be protected under the
                           US Clean Air Act with the need to prevent “significant deterioration of existing air quality
                           in any portion of any state.” There have long been problems with smoke from bushfires
                           and prescribed burns [16,17], which continue to trouble many countries, such as the US,
                           Australia, etc.
                                  Urban areas often have tall observation decks for viewing the surrounding scenery [18],
                           so urban visibility can have an impact on tourism. In the United Kingdom, visual amenity
                           was used in marketing the London Eye; the world’s largest observation wheel was said
                           to offer visitors amazing views of the capital city, to a distance of 40 km on a clear day,
                           but when it was hazy, visitors were disappointed [2]. In China, Beijing haze days affect
                           the timing of tourist visits to the capital [19], though they may not respond directly to
                           visibility issues, rather to reports of poor air quality. Nevertheless, Zhou et al. [20] were
                           able to show tourism has a statistically significant and negative response to poor air quality
                           (PM10 ). Media, public interest groups and surveys, reveal continued public concern over
                           air pollution, and in the previous decade—the percentage of those thinking air pollution
                           was serious grew between 2000 and 2008. Furthermore, it was seen as more of a problem
                           than noise waste and water pollution [21]. The level of concern among Shanghai residents,
                           as estimated by the volume of searches on the Baidu Internet search engine, indicated there
                           was concern about air pollution when the air quality in Shanghai or other major Chinese
                           cities deteriorated [22]. Views about air pollution seem to be driven by external perceptions,
                           and although there may be a mismatch between actual and perceived air pollution, where
                           it is visible, the relationship may be stronger [23].
                                  In Hong Kong, the issue of worsening visibility has been a key driver in demanding
                           cleaner air pollution since the 1990s and continues to the present [24]. Air pollution became
                           an important public health issue for Hong Kong some decades ago, stimulated by scientists
                           such as Anthony Hedley and his research group in the 1990s (e.g., [25]), along with the
                           public policy think tank Civic Exchange and its associated organization, the Clean Air
                           Network (CAN). Worsening visibility became a rallying theme in the early 21st century, a
                           concern reflected by Hong Kong’s media (e.g., South China Morning Post). Sequeira and
                           Lai [26] suggested that the scattering of light in Hong Kong is mainly related to NH4 ,
                           SO4 , and NO3 , anions. Visibility was the subject of a study funded by the Hong Kong
                           Environmental Protection Department (HKEPD), leading to a report [27] that reaffirmed the
                           importance of sulfate as a control on visibility. In the Pearl River Delta, low visibility events
                           typically occur during periods of high particulate loading, commonly accompanied by
                           specific meteorological conditions such as high humidity [28,29]. Concerns over visibility
                           in relation to health [30] and energy as a driver [24] have maintained its importance as an
                           issue. More recently, there have been worries about the potential effect on tourism through
                           dissatisfaction with visibility in the city [31]. Yue et al. [32] examined the perceptions of
                           visibility degradation in Hong Kong and showed that both residents and visitors linked it
                           to environmental issues.
                                  This paper looks at the relationship between visibility and air pollution, but it is mostly
                           concerned with the effects these have on health, public perception, and policy. It will not
                           treat the relationship between the aerosol composition and visible range, but will consider
                           a loose relationship between air pollution and perceptions of visibility. Thus, advocacy
                           groups argue that the dangers of air pollutants may be concealed because threats may be
                           invisible; such groups will often use visibility as an indicator of air quality. This study takes
                           a particular interest in how the relationships between air pollution, visibility, and health
                           risk change over time, with a particular focus on the improvement in visibility in Hong
Visibility Driven Perception and Regulation of Air Pollution in Hong Kong, 1968-2020 - MDPI
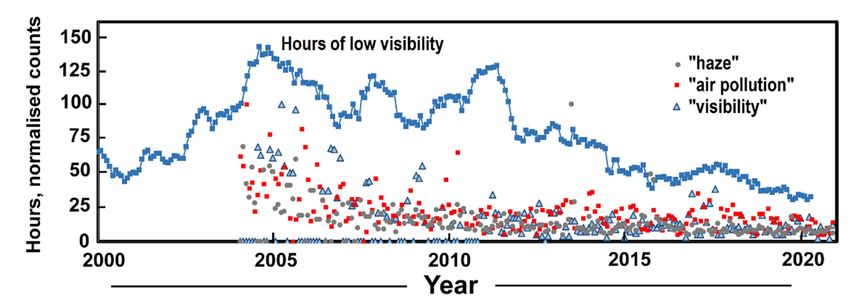
Environments 2021, 8, x FOR PEER REVIEW                                                                                                  3 of 12

Environments 2021, 8, 51          This study takes a particular interest in how the relationships between air pollution,     3 of 11 visi-
                                  bility, and health risk change over time, with a particular focus on the improvement in
                                  visibility in Hong Kong since 2004. It additionally considers the impact visibility has on
                                  public perception of pollution in the region. Many publications have looked mostly at
                                Kong since 2004. It additionally considers the impact visibility has on public perception
                                  visibility in Hong Kong over the period when it deteriorated [20,33]. Even relatively recent
                                of pollution in the region. Many publications have looked mostly at visibility in Hong
                                  papers
                                Kong over  [24,31,32] have
                                             the period     limited
                                                         when          their attention
                                                                it deteriorated [20,33].to the relatively
                                                                                         Even  part of the   record
                                                                                                          recent    when
                                                                                                                 papers    visibility was
                                                                                                                        [24,31,32]
                                have limited their attention to the part of the record when visibility was still in declineto(up
                                  still in decline (up  to ~2010),   so the aim  here is to examine    the  record through       2020 and
                                toinclude
                                    ~2010),asoperiod  of here
                                                the aim  improvement.
                                                              is to examine the record through to 2020 and include a period
                                of improvement.
                                 2. Materials and Methods
                                2. Materials and Methods
                                      Long-term records of visibility in Hong Kong are available from the Hong Kong Ob-
                                     Long-term
                                servatory         records
                                             (HKO).       of visibility
                                                     The lengthier       in Hong
                                                                       records   from Kong
                                                                                        1968are   available
                                                                                              present       from theofHong
                                                                                                        the number      hoursKong
                                                                                                                                of reduced
                               Observatory (HKO). The lengthier records from 1968 present the number of hours of
                                visibility observed at the HKO. Reduced visibility means that the visual range falls below
                               reduced visibility observed at the HKO. Reduced visibility means that the visual range
                                8 km, with relative humidity < 95% and no fog, mist, or precipitation. The values at the
                               falls below 8 km, with relative humidity
Environments 2021, 8, 51                                                                                             4 of 11

                           site has been used most frequently. Average air quality trends in Hong Kong are also well
                           documented [34].
                                 Google trends (https://trends.google.com/117 and accessed 3 June 2021) provides an
                           indication of the changing use of search terms over time and allows the search volume of
                           different queries over time to be explored. The data has been used in a variety of projects,
                           such as searching for movements in the stock market [35] or to public views of political
                           issues [36].
                                 The risk of daily hospital admissions imposed by pollutants in Hong Kong is embodied
                           in its Air Quality Health Index (AQHI). The index was introduced in late 2013 and adopts
                           a commonly used scale with eleven points 1 to 10 and 10+ [37]. The scale is seemingly
                           reversed as it expresses a kind of risk rather than air quality per se, because a low AQHI
                           represents a situation where air quality is high. The AQHI of the current hour is calculated
                           from the sum of the percentage added health risk (RAHR ) of daily hospital admissions
                           attributable to the 3 hour moving average concentrations of NO2 , SO2 , O3 , and particulate
                           matter. The latter is taken as respirable suspended particulate (RSP or PM10 ) or fine
                           suspended particulate matter (FSP or PM2.5 ), whichever poses a higher health risk. The
                           RAHR of each pollutant depends on its concentration and a risk factor derived from local
                           health statistics and air pollution data. The summation and equations are as follows:

                                               RAHR = RAHR,NO2 + RAHR,SO2 + RAHR,O3 + RAHR,PM                           (1)

                           where RAHR,PM is RAHR,PM10 or RAHR,PM2.5 , whichever is higher
                                The parameter RAHR,i is the added health risk of pollutant i determined as RAHR,i =
                           100(exp(βi ci ) − 1) and ci the 3 hour moving average concentration of pollutants (µg m−3 )
                           with the factors: βNO2 = 0.0004462559; βSO2 = 0.0001393235; βO3 = 0.0005116328;
                           βPM10 = 0.0002821751, and βPM2.5 = 0.0002180567 [38].
                                Data analysis in the study used simple UNIX scripts, while statistical calculations
                           took advantage of a number of online tools. Wessa Net was used for multiple regression.
                           The nonparametric Theil-Sen slope used the single case research calculator: (http://www.
                           singlecaseresearch.org/calculators/theil-sen, last accessed 3 June 2021).

                           3. Results and Discussion
                                 The classic picture of visibility in Hong Kong is shown in the graphical abstract. This is
                           frequently seen in popular presentations and academic publications and is a feature of the
                           HKO website. It conveys a sense of change occurring over more than fifty years. In the past,
                           this record has been used to convey the worsening visibility in the city up to the first decade
                           of the 21st and in parallel, represent the trend in long-term particulate levels given the lack
                           of long-term measurements. The visibility record shown in Figure 2a gives the hours of
                           low visibility (nLV ) each month as a function of time, with a line representing the smoothed
                           annual running mean. The visibility at the airport is shown in Figure 2b, and although it
                           initially has more hours of low visibility, it improves rapidly and continuously from peaks
                           early in the 21st century, showing a rather similar change over time to that at the HKO,
                           suggesting that these changes were widely experienced across the territory. The figure
                           indicates the situation of worsening visibility that created so much concern 10–20 years
                           ago. However, from about 2005, the number of hours of low visibility gradually decreased
                           and loosely aligned with improvements in PM, NO2 , SO2 , though not O3 (Figure 2c–f). The
                           years 2004–2006 contained seven of the worst months in the Hong Kong record. The other
                           five worst months were in February, March, July, August and November, between 2010
                           and 2012.
                                 The early decades of worsening visibility led early to it becoming an icon for Hong
                           Kong’s poor air quality. Even today, deteriorating visibility seems to be retained as accepted
                           truth and can still found in some quite recent publications [24,31,32] or presentations that
                           have not been updated. The preoccupation with worsening visibility is understandable
                           given the changes that have affected environmental quality in the region. The industrial-
                           ization has been so rapid that “deterioration in air quality and visibility have become quite
Environments 2021, 8, 51                                                                                                                   5 of 11

                                   prominent and the PRD (Pearl River Delta) region is one of China’s four top regions for
                                   severe haze” [39]. There has been continuing concern that evident haze is a strong reminder
                                   of the city’s poor air quality, which might limit its ability to attract tourists, professional
                                   workers, and investment. Concern about visibility deterioration is also supported by
Environments 2021, 8, x FOR PEER REVIEW                                                                                      5 of 12
                                   articles in the South China Morning Post, which has advocated strongly for improved           air
                                   quality in Hong Kong.

                                 Figure 2.
                                Figure    2. (a)(a) Hours
                                                    Hours of   of low
                                                                  low visibility
                                                                        visibility each
                                                                                     each month
                                                                                          month (nLV
                                                                                                   LV)) at
                                                                                                        at HKO
                                                                                                           HKO and
                                                                                                                 and (b)
                                                                                                                     (b) Hong Kong International
                                                                                                                                     International
                                Airport,
                                Airport, alongalong with
                                                     with the the change
                                                                   change inin monthly
                                                                                 monthly average
                                                                                          average air
                                                                                                  air pollutant
                                                                                                       pollutant concentrations
                                                                                                                 concentrations at
                                                                                                                                at Sam
                                                                                                                                   Sam Shui
                                                                                                                                       Shui Po
                                                                                                                                            Po for
                                                                                                                                               for
                                (c)  PM1010, ,(d)
                                 (c) PM        (d)NONO2,2 ,(e)
                                                            (e)SO
                                                                SO2,2and
                                                                     , and(f)(f)OO
                                                                                 3. .
                                                                                   3

                                       At times
                                      The  earlythere
                                                  decadesseems    to be a reluctance
                                                               of worsening             to acknowledge
                                                                                visibility led early to itimprovements
                                                                                                             becoming an icon  in visibility
                                                                                                                                    for Hong in
                                 Hong Kong.
                                Kong’s           However,
                                          poor air   quality.this
                                                                Evenhastoday,
                                                                         been noted    in some visibility
                                                                                 deteriorating    more recent    publications:
                                                                                                             seems                 “Shenzhen
                                                                                                                      to be retained    as ac-
                                 has experienced
                                cepted   truth andincreased       air pollution,
                                                      can still found     in some reflected  in thepublications
                                                                                    quite recent    frequency of [24,31,32]
                                                                                                                    haze events. or The worst
                                                                                                                                    presenta-
                                 period
                                tions     was
                                       that    in 2004,
                                            have          during
                                                   not been         which The
                                                                updated.    therepreoccupation
                                                                                   were 187 dayswith withworsening
                                                                                                            haze events”    [40]. Part
                                                                                                                         visibility     of the
                                                                                                                                    is under-
                                 reluctancegiven
                                standable     to accept   improvedthat
                                                     the changes        visibility may be environmental
                                                                           have affected    that it is strongly   coupled
                                                                                                               quality       to air
                                                                                                                         in the     pollution,
                                                                                                                                  region.  The
                                 so  drawing   attention    to improved     visibility might    suggest,  in parallel,  that
                                industrialization has been so rapid that “deterioration in air quality and visibility have    air quality  had
                                 improved     in the  city.  The  air  pollution   problem    is generally   perceived
                                become quite prominent and the PRD (Pearl River Delta) region is one of China’s four top  as  growing    more
                                 severe by
                                regions   forthe mediahaze”
                                               severe     and the    public
                                                                 [39]. There [41],
                                                                               hasand
                                                                                    beenwhere    improvements
                                                                                           continuing    concernare    acknowledged,
                                                                                                                    that  evident haze theyis a
                                 are often
                                strong      framedofinthe
                                         reminder         thecity’s
                                                               negative
                                                                     poorsense,    e.g., that
                                                                            air quality,  whichimprovements
                                                                                                  might limit itshave   not continued
                                                                                                                     ability               [42].
                                                                                                                              to attract tour-
                                Additionally,
                                ists,            it has
                                      professional       been argued
                                                      workers,            the public are
                                                                   and investment.         not able
                                                                                       Concern       to sense
                                                                                                   about        gradual
                                                                                                           visibility      improvements
                                                                                                                       deterioration         in
                                                                                                                                       is also
                                 air quality  and   are more    influenced    by  heavily  polluted   days   [43,44].
                                supported by articles in the South China Morning Post, which has advocated strongly for
                                improved air quality in Hong Kong.
                                 3.1. Visibility and Pollution
                                       At times there seems to be a reluctance to acknowledge improvements in visibility in
                                HongThe Kong.relationship
                                                 However,between
                                                              this has visibility
                                                                        been notedandin pollutant
                                                                                        some more    load  waspublications:
                                                                                                       recent    detailed in the  Study of
                                                                                                                              “Shenzhen
                                Visibility
                                has         Reductionincreased
                                      experienced        and its Causes in Hong Kong
                                                                   air pollution,       [27]. This
                                                                                   reflected  in therelationship
                                                                                                       frequencyisofcomplex,    especially
                                                                                                                        haze events.  The
                                 at short-time    resolution    and best  involves  considering    the  ions  in the
                                worst period was in 2004, during which there were 187 days with haze events” [40].   particulate  material.
                                                                                                                                      Part
                                 However,
                                of             the work
                                    the reluctance          presented
                                                        to accept       here focuses
                                                                   improved             onmay
                                                                               visibility   the be
                                                                                                 morethatgeneral   relationship
                                                                                                          it is strongly  coupledbetween
                                                                                                                                    to air
                                 visibility and monitored air pollutants. The changes in monthly average concentrations of
                                pollution, so drawing attention to improved visibility might suggest, in parallel, that air
                                 the four pollutants PM , NO , SO , and O at the SSP general urban site a few kilometers
                                quality had improved 10in the2 city.2 The air3 pollution problem is generally perceived as
                                 distant from the HKO are plotted in Figure 2c–e. It would have been preferable to use
                                growing more severe by the media and the public [41], and where improvements are
                                 PM2.5 , but the record did not become available until 2011. Other sites might have been
                                acknowledged,        they are often framed in the negative sense, e.g., that improvements have
                                 chosen to represent the HKO, but as the visual range integrates pollution over long path
                                not continued [42]. Additionally, it has been argued the public are not able to sense grad-
                                 lengths, it is hard to decide the most appropriate ground-level monitoring site. However,
                                ual improvements in air quality and are more influenced by heavily polluted days [43,44].
                                 it is evident from the data that there is a general decrease in average concentrations of
                                 PM10 , NO2 , SO2 , and O3 increases across a period when visibility is improving. The
                                3.1. Visibility  and Pollution
                                 changes in O3 may result from a decreased titration by NO. It is also possible that higher
                                       The relationship
                                 O3 concentrations       leadbetween   visibility
                                                               to higher          and pollutant
                                                                          concentrations            load was
                                                                                           of secondary          detailed matter
                                                                                                            particulate   in the in
                                                                                                                                  Study
                                                                                                                                    Hong of
                                Visibility
                                 Kong, whereReduction    and its
                                                  (i) a large    Causes in Hong
                                                              proportion         Kongof[27].
                                                                           (25–45%)          Thisisrelationship
                                                                                         sulfate    of secondaryisorigin
                                                                                                                      complex,
                                                                                                                           [45] especially
                                                                                                                                and (ii) in
                                at  short-timesecondary
                                wintertime,      resolution organic
                                                               and bestcarbon
                                                                         involves
                                                                                (asconsidering
                                                                                    carbon) makes the ions   in the particulate
                                                                                                       up slightly    more of thematerial.
                                                                                                                                   aerosol
                                However,
                                 than the sulfate, while in summer, it is about a half [46]. Particulate concentrationsvis-
                                              the  work   presented   here  focuses  on  the more   general    relationship between      of
                                ibility and monitored air pollutants. The changes in monthly average concentrations of
                                the four pollutants PM10, NO2, SO2, and O3 at the SSP general urban site a few kilometers
                                distant from the HKO are plotted in Figure 2c–e. It would have been preferable to use
                                PM2.5, but the record did not become available until 2011. Other sites might have been
                                chosen to represent the HKO, but as the visual range integrates pollution over long path
Environments 2021, 8, 51                                                                                             6 of 11

                           species likely to control visibility are not typically provided to the public on a regular
                           basis in Hong Kong. However, multiple linear regression reveals a satisfying relationship
                           between monthly hours of low visibility (nLV ) and the gaseous pollutant concentrations (c),
                           with Equation (2) suggesting:

                                                nLV = +1.5cNO2 + 0.3cO3 + 1.5cPM10 + 0.63cSO2 − 109                     (2)

                           with r2 (0.57), so the equation explains a reasonable amount of the variance. However, the
                           individual p2 values for both cSO2 and cO3 suggest little significance, i.e., 0.14 and 0.18. The
                           other parameters are all significant (p2 < 0.0001). Pollutant gases are hardly a driver of
                           visibility, but the relationship supports the view that pollution, as measured by the HKEPD
                           network and visibility are related, a link, likely indirect, that aligns with public expectation
                           (see also [9]) and health. Thus, we can perceive air pollution through its surrogate visibility,
                           as long RH < 95% and there is no low cloud, to avoid confusion with mist. Sequeira and
                           Lai [26], and later Wang [27], pointed out that visibility in Hong Kong seems primarily a
                           sulfate-driven process. Sulfur dioxide has long been in decline in Hong Kong as a result
                           of legislation which meant there were sharp reductions in SO2 (80%) and sulfate particles
                           (41%) in the early 1990s [47,48].
                                 Given the relationship between markers of air pollution and visibility, it seems natural
                           to argue that improved visibility in Hong Kong reflects a general improvement in its air
                           quality. However, such improvements are not well accepted and do not align with the
                           representation of pollution in the media or opinion surveys [41]. It could be argued that
                           although the pollutant load decreased in line with improving visibility, health effects did
                           not. As different pollutants have different health outcomes, these might not improve even
                           though some pollutant concentrations declined. Nevertheless, earlier studies (e.g., [30])
                           promoted the idea of a relationship between visibility and health in Hong Kong.

                           3.2. Pollutants and the Health Index
                                The tensions noted in the previous paragraph mean it is worth exploring the way that
                           key air pollutants and health risk have changed over time. In Hong Kong, power stations
                           have long been an important source of air pollutants, but they have improved, such that
                           shipping has become a more dominant source, especially for SO2 . Road transport is relevant
                           to NO2 , and the volatile organic emissions and carbon monoxide contribute as precursors in
                           the production of O3 . Many studies in the past have explored the notion that air pollution,
                           visibility, and health are interconnected [49–51], though here, this relation is explored in
                           terms of perceptions in Hong Kong and its special health index. The AQHI is only available
                           from December 2013, but the method can be applied using earlier measurements, although
                           there are difficulties, most notably, the absence of PM2.5 . In the calculations here, where
                           PM2.5 is not available, PM10 is used, and while this leads to error, PM10 and PM2 .5 tend to
                           be well correlated (r2 ~ 0.88), so it is not as serious as one might first imagine.
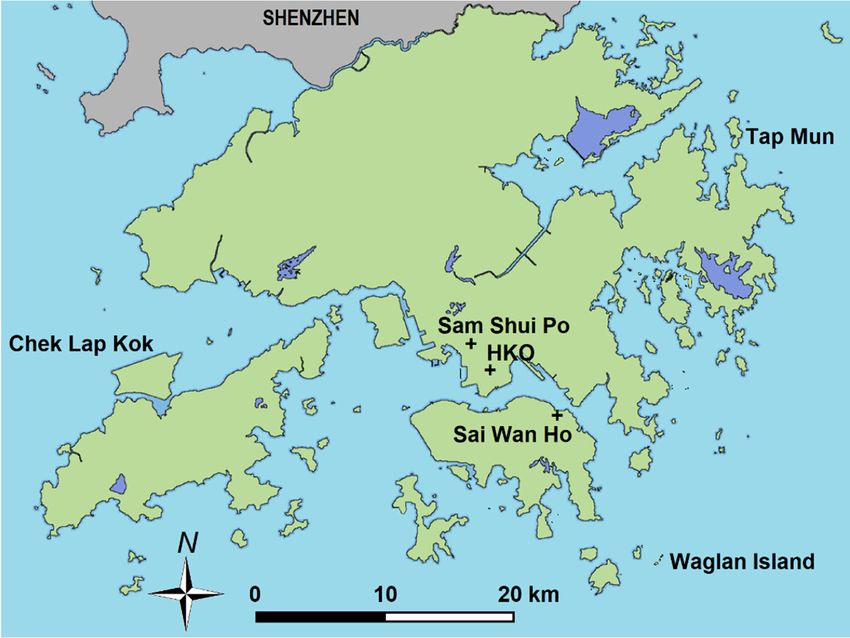
                                The added health risk calculated for each pollutant is plotted additively in Figure 3a
                           and gives a sense of the strong seasonal variation, with the total risk almost doubling from
                           summer to winter. However, the overall risk seems to have declined. Across the record,
                           since 1998 the dominant risk derives from NO2 (about half) as illustrated by the large
                           shaded-area for NO2 in Figure 3a. Figure 3b shows the monthly proportions during the
                           years 2015–2019. Little risk is associated with SO2 , so the changing balance can be largely
                           attributed to PM, NO2 , and O3 as represented in the ternary plot (Figure 3c), illustrating
                           that over time the risk has come to be dominated by ozone; now at ~38%.
                                The general site at SSP cannot properly represent risk throughout Hong Kong, so it is
                           worth examining roadside and rural values. This is not to say they represent exposures
                           of any individual person, but reminds us of differences that arise, especially because of
                           the heterogeneity of pollutants in urban areas. Figure 3d shows calculated risk at the
                           roadside using the Mong Kok site on busy Nathan Road, at its junction with Lai Chi Kok
                           Road, ~1.5 km from the HKO. Since 1996, high concentrations of NO2 make it a large
                           and dominant contributor to risk. However, much as expected, this declines in line with
Environments 2021, 8, 51                                                                                                                      7 of 11

                                decreases in NO2 at Hong Kong roadside sites, despite increases in the ratio: NO2 /NO in
Environments 2021, 8, x FOR PEER REVIEW
                                  emissions                                                                             7 of
                                           [52]. Particulate matter has also decreased over time at roadside sites. There    12
                                                                                                                           are
                                slight increases in the risk imposed by ozone, though the record is short (Figure 3d).

                                Figure 3. (a) Added
                                                Added contributions
                                                        contributionsto  tothe
                                                                            thehealth
                                                                                healthrisk
                                                                                        risk(R(RAHR))from
                                                                                               AHR     fromPM
                                                                                                            PM1010,, NO
                                                                                                                     NO22, SO
                                                                                                                            SO22, and O33 at Sam Shui
                                                                                                                                                 Shui
                                Po,  (colloquially  SSP). (b) Monthly     averages  of health   risk  for the pollutants    for the  years
                                Po, (colloquially SSP). (b) Monthly averages of health risk for the pollutants for the years 2015–2019.    2015–2019.
                                (c) Ternary
                                (c) Ternary diagram
                                                diagram showing
                                                         showing average
                                                                    average annual
                                                                               annual health
                                                                                       health risk
                                                                                                 riskfrom
                                                                                                       fromPMPM10,, NONO2,, and
                                                                                                                             and OO3 at
                                                                                                                                      at Sam
                                                                                                                                         Sam Shui
                                                                                                                                              Shui Po
                                                                                                                                                   Po
                                                                                                               10         2         3
                                from 1998–2020. (d) Added contributions to the health risk from PM10, NO2, SO2, and O3 at the Mong
                                from 1998–2020. (d) Added contributions to the health risk from PM10 , NO2 , SO2 , and O3 at the
                                Kok roadside site. (e) Added contributions to the health risk from PM10, NO2, SO2, and O3 at the
                                Mong Kok roadside site. (e) Added contributions to the health risk from PM10 , NO2 , SO2 , and O3 at
                                rural site on Tap Mun (Grass Island). (f) Ternary diagram showing average monthly health risk
                                the
                                from rural
                                       PMsite    on Tap Mun (Grass Island). (f) Ternary diagram showing average monthly health risk
                                           10, NO2, and O3 at Sam Shui Po (1998–02/2020-09), Mong Kok (2011-01/2020-09), and Tap
                                from
                                Mun PM     10 , NO2 , and O3Note:
                                       (1998-01/2020-04).     at Sam
                                                                   (i) Shui
                                                                       scale Po  (1998-02/2020-09),
                                                                              change  between Figure     Mong   Kok
                                                                                                           3a,d,e   (ii)(2011-01/2020-09),    and Tap
                                                                                                                         color/shades and order    for
                                Mun    (1998-01/2020-04).
                                the pollutants              Note: the
                                                  plotted remain    (i) scale
                                                                        samechange     between
                                                                               for Figure          Figure 3a,d,e (ii) color/shades and order for
                                                                                            3a,b,d,e.
                                the pollutants plotted remain the same for Figure 3a,b,d,e.
                                      The general site at SSP cannot properly represent risk throughout Hong Kong, so it
                                      The  heterogeneity
                                is worth examining           of the and
                                                        roadside     potential
                                                                          rural health
                                                                                  values.threat   can
                                                                                            This is  notbetofurther
                                                                                                              say they explored    at the
                                                                                                                           represent       remote
                                                                                                                                        exposures
                                rural site of Tap Mun (or Grass Island). The rural record represents a situation largely
                                of any individual person, but reminds us of differences that arise, especially because of
                                free from nearby sources of primary pollutants, but the total health risk is not notably
                                the heterogeneity of pollutants in urban areas. Figure 3d shows calculated risk at the road-
                                smaller than the roadside site (Figure 3e) and is dominated by O3 , with NO2 making little
                                side using the Mong Kok site on busy Nathan Road, at its junction with Lai Chi Kok Road,
                                contribution. There are subtle decreases in the potential health impact of NO2 , SO2 , and
                                ~1.5 km from the HKO. Since 1996, high concentrations of NO2 make it a large and domi-
                                particulate matter at Tap Mun. The risk associated with O3 is dominant and increases
                                nant contributor to risk. However, much as expected, this declines in line with decreases
                                slightly over time, the Theil-Sen slope suggesting an annual decline in risk RAHR,O3 of
                                in NO2 at Hong Kong roadside sites, despite increases in the ratio: NO2/NO in emissions
                                ~0.017. This aligns with rural NO2 , SO2 , and particulate matter concentrations being low,
                                [52]. Particulate matter has also decreased over time at roadside sites. There are slight
                                while O3 has been about 70 µg m−3 during the first decades of the century.
                                increases in the risk imposed by ozone, though the record is short (Figure 3d).
                                      The relative health risks imposed by the pollutants at the three sites are shown in
                                      The heterogeneity of the potential health threat can be further explored at the remote
                                the ternary diagram (Figure 3f). They acquire risk from different pollutants, so hint at the
                                rural site of Tap Mun (or Grass Island). The rural record represents a situation largely free
                                range of risk exposures experienced by Hong Kong residents. Some who live close to busy
                                from nearby
                                roads  may besources      of primaryby
                                                 best represented        pollutants,    but the totalashealth
                                                                            a risk accumulating                    risk is
                                                                                                           indicated     fornot notably
                                                                                                                             Mong      Kok,smaller
                                                                                                                                             while
                                than  the  roadside   site  (Figure   3e)  and   is dominated     by   O  3, with NO2 making little contri-
                                those in rural areas or the islands may be more akin to the balance of risk suggested by
                                bution.
                                Tap  Mun.There
                                            The are   subtle
                                                 remote    sitedecreases
                                                                could alsoinrepresent
                                                                                the potential    health impact
                                                                                           the exposures      of thoseof NO
                                                                                                                          who2, SO2, and partic-
                                                                                                                                live in high-rise
                                ulate  matter  at Tap   Mun.     The   risk  associated    with   O 3 is dominant and increases slightly
                                apartments far above roads. It is important to note that in Hong Kong, more than half
                                overpopulation
                                the   time, the Theil-Sen
                                                   lives above slope   suggesting
                                                                   Floor   No. 15; an     annual
                                                                                      in that      decline
                                                                                                sense,   it is in
                                                                                                                therisk  RAHR,O3
                                                                                                                     tallest cityofin~0.017.  This
                                                                                                                                       the world.
                                aligns  with  rural  NO  2, SO2, and particulate matter concentrations being low, while O3 has
                                High O3 at more remote locations means that there is surprisingly little difference between
                                beenrisk
                                the   about   70 µg
                                         in rural  andm−3urban
                                                           during    the first
                                                                  areas.        decades
                                                                          Overall,         of the century.
                                                                                      the health   risk shows strong seasonal variation
                                      The  relative  health   risks  imposed     by  the  pollutants
                                and gradual improvement in the threat from primary pollutant            at the three
                                                                                                                   risk, sites
                                                                                                                         whileare   shown
                                                                                                                                 that  from in
                                                                                                                                             O3the
                                                                                                                                                 is
                                ternary diagram
                                increasing           (Figure
                                             as an issue        3f). They acquire
                                                           of considerable      concern risk
                                                                                           in from
                                                                                              Hongdifferent
                                                                                                       Kong [53].   pollutants, so hint at the
                                range of risk exposures experienced by Hong Kong residents. Some who live close to busy
                                3.3.
                                roadsPerception
                                        may be of   Visibility
                                                 best           and AirbyQuality
                                                       represented          a risk accumulating as indicated for Mong Kok, while
                                thoseThe
                                       in rural
                                           general picture of trends inmay
                                                 areas   or  the  islands          be more
                                                                             air quality      akin toimprovement
                                                                                           suggests      the balance of   andrisk  suggested
                                                                                                                               a slight         by
                                                                                                                                          decrease
                                Tap   Mun.   The  remote     site could   also   represent   the  exposures       of  those
                                in risk to many Hong Kong residents, living as they do in urban areas. In parallel, visibilitywho    live in high-
                                rise apartments
                                has  improved, yet far above     roads. It come
                                                        such changes        is important    to note
                                                                                    at a time         that in Hong
                                                                                                 of increased            Kong,
                                                                                                                    public        moreabout
                                                                                                                             anxiety     than half
                                                                                                                                                air
                                the population
                                pollutants.  This lives
                                                   concernabove    Floor No.in15;
                                                              is portrayed        thein  that sense,
                                                                                       media            it is the
                                                                                               and through           tallest cityof
                                                                                                                  publications     inCAN,
                                                                                                                                       the world.
                                                                                                                                             often
                                High O3 at more remote locations means that there is surprisingly little difference between
                                the risk in rural and urban areas. Overall, the health risk shows strong seasonal variation
                                and gradual improvement in the threat from primary pollutant risk, while that from O3 is
                                increasing as an issue of considerable concern in Hong Kong [53].
often drawing attention to episodes or that Hong Kong’s air quality objectives ar
                              stringent as the guidelines recommended by the World Health Organisation.
                                    A trend
                           3.3. Perception       in public
                                            of Visibility       opinion
                                                           and Air   Qualityabout air quality in Hong Kong can be seen from
                              Trends,
                                 The general picture of trends infrequency
                                          which     provides       the                  of search
                                                                          air quality suggests        queries inand
                                                                                                  improvement         Google
                                                                                                                         a slightover
                                                                                                                                    de- time (F
Environments 2021, 8, 51   crease
                              Theinrecord
                                      risk to goes
                                               many back
                                                      Hong to  Kong
                                                                  2004residents,
                                                                         and is living     as theyfor
                                                                                   displayed        do the
                                                                                                       in urban
                                                                                                            searchareas.  In parallel,
                                                                                                                      terms         8 of 11
                                                                                                                                (i) “visibility”
                           visibility has improved,
                              pollution”,      and (iii) yet“haze”.
                                                              such changes
                                                                        Searchcome   at a time of increased
                                                                                  frequencies       roughlypublic     anxiety
                                                                                                                parallel     theabout
                                                                                                                                   smoothed d
                           air pollutants. This concern is portrayed in the media and through publications of CAN,
                              hours of low visibility. Search frequency appears noisy because sometimes the nu
                           often drawing attention to episodes or that Hong Kong’s air quality objectives are not as
                             drawing
                              searches  attention  to so
                                                      episodes
                                           is guidelines
                                              low,         there  orare
                                                                     thatfrequent
                                                                          Hong Kong’s      air quality objectives areisnot  as stringent
                           stringent  as the                 recommended       by the zero
                                                                                       Worldvalues.      Caution
                                                                                                Health Organisation.     needed       when inte
                             as the guidelines recommended by the World Health Organisation.
                              these   changes.
                                 A trend           Although
                                           in public   opinion abouttheyairshow    a declining
                                                                              quality  in Hong Kong interest
                                                                                                         can beinseen
                                                                                                                   searching,
                                                                                                                       from Google  this does no
                                   A trend in public opinion about air quality in Hong Kong can be seen from Google
                           Trends,
                              sarily which
                                      reflectprovides
                                                a decline the  frequency
                                                               in concern,  of search
                                                                               as  it   queries
                                                                                      could    bein  Google
                                                                                                   that publicover
                             Trends, which provides the frequency of search queries in Google over time (Figure     time
                                                                                                                  knowledge(Figure    4).4).reached
                                                                                                                                     has
                           The  record
                              where
                             The         goes
                                       searches
                                  record       back
                                           goes back to
                                                    are  2004
                                                        to no
                                                            2004and  is
                                                                longer  displayed   for the  search  terms  (i) “visibility”,  (ii)
                                                                          frequent.for the search terms (i) “visibility”, (ii) “air
                                                                  and is displayed                                                  “air
                           pollution”,
                             pollution”,  and
                                            and(iii) “haze”.
                                                  (iii) “haze”.Search
                                                                 Search frequencies
                                                                           frequenciesroughly
                                                                                         roughly parallel the
                                                                                                   parallel   smoothed
                                                                                                            the  smoothed decline inin
                                                                                                                            decline
                           hours
                             hours ofof
                                     low lowvisibility.
                                              visibility.Search
                                                           Searchfrequency
                                                                   frequency   appears
                                                                                 appears noisy
                                                                                          noisybecause
                                                                                                 because sometimes
                                                                                                           sometimes  the number
                                                                                                                        the numberofof
                           searches   is  low,  so  there   are frequent     zero values.  Caution   is needed    when  interpreting
                             searches is low, so there are frequent zero values. Caution is needed when interpreting these
                           these  changes.
                             changes.         Although
                                          Although      theythey show
                                                              show       a declining
                                                                    a declining        interest
                                                                                   interest     in searching,
                                                                                            in searching,   thisthis does
                                                                                                                  does notnot neces-
                                                                                                                           necessarily
                           sarily
                             reflect a decline in concern, as it could be that public knowledge has reached a pointpoint
                                  reflect  a decline    in concern,  as it  could be that  public knowledge      has reached a  where
                           where   searches
                             searches    are noare  no longer
                                                 longer         frequent.
                                                           frequent.

                             Figure 4. Hours of low visibility each month at the HKO as the annual running mean, an
                             quency of search queries from Hong Kong in Google Trends 2004–2020 for “visibility”, “
                             tion”, and “haze”.
                              Figure
                           Figure  4. 4. Hours
                                      Hours       of low
                                              of low      visibility
                                                      visibility eacheach month
                                                                      month       at HKO
                                                                             at the  the HKO
                                                                                          as theasannual
                                                                                                   the annual  running
                                                                                                         running  mean,mean,
                                                                                                                          and theand  the
                                                                                                                                   fre-
                           quency   of search
                              frequency        queries
                                          of search     from Hong
                                                      queries         Kong in
                                                               from Hong      Google
                                                                            Kong       Trends Trends
                                                                                   in Google  2004–2020   for “visibility”,
                                                                                                       2004–2020            “air pollu-
                                                                                                                   for “visibility”, “air
                           tion”,
                                     Perceptions of the relationship between visibility and air pollution
                                  and “haze”.
                                                                                                                                                  may
                              pollution”, and “haze”.
                              sensed in images chosen by the media. Hong Kong’s English language newspa
                              South     China Morning
                                 Perceptions
                                   Perceptions    ofofthe       Post published
                                                       the relationship
                                                            relationship   between     70   articles
                                                                            betweenvisibility
                                                                                        visibility  and
                                                                                                  and    onair
                                                                                                        air    air  pollution
                                                                                                                 pollution
                                                                                                            pollution    maymayalsofrom
                                                                                                                                     also
                                                                                                                                    be     December
                                                                                                                                           be
                                                                                                                                        sensed
                             in
                           sensedimages
                                     in     chosen
                                         images       by
                                                   chosen thebymedia.
                                                                 the     Hong
                                                                      media.     Kong’s
                                                                               Hong         English
                                                                                        Kong’s         language
                                                                                                  English
                              December 2020 to hint at current perceptions. Forty of these contained images s       newspaper,
                                                                                                              language              the
                                                                                                                           newspaper,    South
                                                                                                                                          the
                             ChinaChina
                           South     Morning     Post published
                                            Morning                 70 articles
                                                        Post published          on air pollution
                                                                           70 articles               from December
                                                                                         on air pollution                  2018 to December
                                                                                                                from December        2018 to
                              visibility
                             2020   to   hint
                                             degraded
                                               at current
                                                             by haze, suggesting
                                                             perceptions.    Forty   of
                                                                                           thatcontained
                                                                                        these
                                                                                                  haze remains images
                                                                                                                        an   important
                                                                                                                         showing
                                                                                                                                             icon for a
                                                                                                                                     visibility
                           December 2020 to hint at current perceptions. Forty of these contained images showing
                              tion. Haze
                             degraded
                           visibility  degraded wasbysuggesting
                                           by haze,    more
                                                         haze, frequently
                                                                     that haze
                                                                suggesting      associated
                                                                                remains
                                                                              that               with
                                                                                           an important
                                                                                    haze remains          airicon
                                                                                                                pollution
                                                                                                     an important   for icon   than
                                                                                                                         air pollution.
                                                                                                                              for      other
                                                                                                                                          Hazeimages,
                                                                                                                                  air pollu-
                              traffic
                             was
                           tion.   more
                                  Haze   or
                                          was factories
                                            frequently      chimneys
                                                          associated
                                                more frequently            with
                                                                        with   air plumes
                                                                      associated   pollution
                                                                                   with        of
                                                                                                thansmoke.
                                                                                          air pollution other
                                                                                                            than Figure
                                                                                                                images,      5 shows
                                                                                                                           such
                                                                                                                   other images,  as such the
                                                                                                                                           asorkey rep
                                                                                                                                     traffic
                             factories
                              tions
                           traffic or in  chimneys
                                           the pictures
                                        factories      with plumes
                                                    chimneys  featured  of smoke. of Figure
                                                                           in articles,
                                                                 with plumes         smoke.   5Figure
                                                                                                shows
                                                                                            e.g.,  haze5the     key representations
                                                                                                            surgical
                                                                                                            shows    themask,      plumesin the
                                                                                                                           key representa-     from a c
                             pictures
                           tions  in  thefeatured
                                           pictures infeatured
                                                        articles,in
                                                                  e.g., haze surgical
                                                                    articles, e.g., hazemask,    plumes
                                                                                           surgical   mask, from   a chimney,
                                                                                                                plumes    from  ablue  or clear
                                                                                                                                   chimney,
                              blue or clear sky notions from images associated with these articles.
                             skyornotions
                           blue           from
                                   clear sky   images
                                             notions   associated
                                                     from images with  these articles.
                                                                  associated with these articles.

                           Figure 5. The number of representations of haze, surgical masks, plumes from a chimney and blue
                           orFigure
                              clear skies from
                                     5. The     pictures
                                             number       in 70 articles about
                                                     of representations         airsurgical
                                                                          of haze,  pollution published
                                                                                            masks,      infrom
                                                                                                   plumes  the South China Morning
                                                                                                                a chimney
                             Figure
                           Post        5. The
                                December    2018number
                                                 to Decemberof representations
                                                                2020.                of haze,  surgical  masks,    plumesand  blue or
                                                                                                                           from  a chimney
                             clear skies from pictures in 70 articles about air pollution published in the South China Morning Post
                             or clear skies from pictures in 70 articles about air pollution published in the South China
                             December 2018 to December 2020.
                             Post December 2018 to December 2020.
                                  Air quality and visibility in Hong Kong since the earliest measurements, but neither
                             are yet satisfactory—taking average PM2.5 as ~20 µg m−3 ranks the city 43rd worst among
                             national capitals [54]. Among European capitals, only Sarajevo, Skopje, Sofia, Pristina,
Environments 2021, 8, 51                                                                                               9 of 11

                           Belgrade, and Athens were worse. The general improvements in Hong Kong, while framed
                           by the HKEPD in terms of its air quality objectives [55], receive little public comment.
                           Stakeholders remain concerned that these objectives are less stringent than WHO guide-
                           lines [56] or that there are continued exceedance for NO2 at general and roadside stations
                           and ozone breaches the standard at general sites [57]. Concentrations of air pollutants are
                           at times undesirably high, yet the annual concentrations of primary air pollutants have
                           decreased over the years. The smoothed health impact of these pollutants, as illustrated
                           in Figure 3, also suggests a declining health risk, although there is a substantial seasonal
                           variation. Although the threat from particulate matter and NO2 has decreased over the last
                           decade, the risk from O3 has grown, justifying the concerns expressed by CAN [40].
                                Despite improved visibility in Hong Kong, it remains an icon for poor air quality in
                           the media. It is also possible to discern a decreased frequency of searches for visibility, air
                           pollution, and haze on Google, though the meaning of those declines is open to a range
                           of explanations. Lower air pollutant concentrations and better visibility are in contrast
                           with a public perception that conditions in the city have become poorer. The CAN [41]
                           Survey on Air Quality and Respiratory Health of Children suggests that of the 512 respon-
                           dents, more than half believed that air quality had become worse over the previous three
                           years. Sometimes positive public visions of change can be apparent with quite modest
                           or localized improvements in air pollution, e.g., changes during road blockages during
                           the 2014 Umbrella Movement [58], which drew comments long afterwards [59]. In 2020,
                           the public readily accepted improvements to air pollution during COVID-19 lockdowns,
                           though it was hard to assess whether views derived from personal observations, media
                           promotion, vivid imagery, or desire to see something positive a time of crisis [13]. Reasons
                           for our perceptions can be hard to ascertain, but as Bickerstaff and Walker [60] pointed out,
                           monitoring data does not drive public opinion as much as localized social perceptions.

                           4. Conclusions
                                 Poor visibility in Hong Kong has often been linked to air pollution and its health
                           impact, particularly in a period when visibility was in decline. As the primary pollutants
                           have decreased in concentration in recent years, visibility has improved. However, ozone
                           has been increasing, and while this poses an increasing risk to health, a secondary pollutant
                           is likely to have little direct effect on visibility. Exposure to ozone may be especially relevant
                           to those living away from busy streets in high-rise apartments or in rural areas where
                           intuitively, one might believe risks from air pollution to be lower. Increasing concentrations
                           of ozone weakens the direct link between visibility and the health risk imposed by air
                           pollution. Despite some general improvements in air quality, these are not necessarily
                           reflected in the public or media views about air pollution, and visibility or haze remains an
                           important icon for air pollution in Hong Kong. The air quality problem is seen as one that
                           is becoming ever more severe. Policymakers need to account for the air quality perceptions
                           of stakeholders and acknowledge that these are not necessarily bound to concentration
                           measurements from a monitoring network. Improvements in air quality are hard-won, but
                           conveying the nature of improvements to the public can be a continuing struggle.

                           Funding: This research received no external funding.
                           Institutional Review Board Statement: Not applicable.
                           Informed Consent Statement: Not applicable.
                           Data Availability Statement: Data is publicly available as denoted by URLs.
                           Acknowledgments: Visibility in Hong Kong has been a popular discussion topic with my students
                           over a number of years and I learned much from these discussions, especially an undergraduate
                           dissertation: Politics of Visibility.
                           Conflicts of Interest: The author declares no conflict of interest.
Environments 2021, 8, 51                                                                                                          10 of 11

References
1.    Brimblecombe, P. The Big Smoke; Methuen: London, UK, 1987.
2.    Doyle, M.; Dorling, S. Visibility trends in the UK 1950–1997. Atmos. Environ. 2002, 36, 3161–3172. [CrossRef]
3.    Founda, D.; Kazadzis, S.; Mihalopoulos, N.; Gerasopoulos, E.; Lianou, M.; Raptis, P.I. Long-term visibility variation in Athens
      (1931–2013): A proxy for local and regional atmospheric aerosol loads. Atmos. Chem. Phys. 2016, 16, 11219. [CrossRef]
4.    Chen, H.; Wang, H. Haze days in North China and the associated atmospheric circulations based on daily visibility data from
      1960 to 2012. J. Geophys. Res. Atmos. 2015, 120, 5895–5909. [CrossRef]
5.    Deng, J.; Du, K.; Wang, K.; Yuan, C.S.; Zhao, J. Long-term atmospheric visibility trend in Southeast China, 1973–2010. Atmos.
      Environ. 2012, 59, 11–21. [CrossRef]
6.    Zhang, Y.; Gao, L.; Cao, L.; Yan, Z.; Wu, Y. Decreasing atmospheric visibility associated with weakening winds from 1980 to 2017
      over China. Atmos. Environ. 2020, 224, 117314. [CrossRef]
7.    Fu, W.; Chen, Z.; Zhu, Z.; Liu, Q.; Qi, J.; Dang, E.; Wang, M.; Dong, J. Long-term atmospheric visibility trends and characteristics
      of 31 provincial capital cities in China during 1957–2016. Atmosphere 2018, 9, 318. [CrossRef]
8.    Fu, S.; Ma, Z.; Peng, J. “Political blue sky” in fog and haze governance: Evidence from the local major international events in
      China. Environ. Sci. Pollut. Res. 2020, 28, 775–788. [CrossRef] [PubMed]
9.    Brimblecombe, P.; Zong, H. Citizen perception of APEC blue and air pollution management. Atmos. Environ. 2019, 214, 116853.
      [CrossRef]
10.   Ghanem, D.; Zhang, J. Effortless Perfection: Do Chinese cities manipulate air pollution data? J. Environ. Econ. Manag. 2014, 68,
      203–225. [CrossRef]
11.   Shen, Y.; Ahlers, A.L. Blue sky fabrication in China: Science-policy integration in air pollution regulation campaigns for
      mega-events. Environ. Sci. Policy 2019, 94, 135–142. [CrossRef]
12.   Kotnala, G.; Mandal, T.K.; Sharma, S.K.; Kotnala, R.K. Emergence of Blue Sky over Delhi Due to Coronavirus Disease (COVID-19)
      Lockdown Implications. Aerosol Sci. Eng. 2020, 4, 228–238. [CrossRef]
13.   Brimblecombe, P.; Lai, Y. Subtle Changes or Dramatic Perceptions of Air Pollution in Sydney during COVID-19. Environments
      2021, 8, 2. [CrossRef]
14.   Disselhorst, T.M. Sierra Club v. Ruckelshaus: On a Clear Day . . . . Ecol. Law Q. 1974, 4, 739.
15.   Ostrov, J. Visibility protection under the Clean Air Act: Preserving scenic and parkland areas in the Southwest. Ecol. Law Q. 1982,
      10, 397.
16.   Packham, D.R.; Vines, R.G. Properties of bushfire smoke: The reduction in visibility resulting from prescribed fires in forests. J.
      Air Pollut. Control Assoc. 1978, 28, 790–795. [CrossRef]
17.   Ravi, V.; Vaughan, J.K.; Wolcott, M.P.; Lamb, B.K. Impacts of prescribed fires and benefits from their reduction for air quality,
      health, and visibility in the Pacific Northwest of the United States. J. Air Waste Manag. Assoc. 2019, 69, 289–304. [CrossRef]
      [PubMed]
18.   Hyslop, N.P. Impaired visibility: The air pollution people see. Atmos. Environ. 2009, 43, 182–195. [CrossRef]
19.   Zhang, A.; Zhong, L.; Xu, Y.; Wang, H.; Dang, L. Tourists’ perception of haze pollution and the potential impacts on travel:
      Reshaping the features of tourism seasonality in Beijing, China. Sustainability 2015, 7, 2397–2414. [CrossRef]
20.   Zhou, X.; Santana Jiménez, Y.; Pérez Rodríguez, J.V.; Hernández, J.M. Air pollution and tourism demand: A case study of Beijing,
      China. Int. J. Tour. Res. 2019, 21, 747–757. [CrossRef]
21.   Wong, T.K.Y.; Wan, S.P. Environmental awareness and behavior in Hong Kong: A decade of development. In Proceedings of the
      TASPAA Partnership with the International Conference on Sustainable Development, Taichung City, Taiwan, 24 May 2008.
22.   Dong, D.; Xu, X.; Xu, W.; Xie, J. The Relationship between the Actual Level of Air Pollution and Residents’ Concern about Air
      Pollution: Evidence from Shanghai, China. Int. J. Environ. Res. Public Health 2019, 16, 4784. [CrossRef]
23.   Peng, M.; Zhang, H.; Evans, R.D.; Zhong, X.; Yang, K. Actual air pollution, environmental transparency, and the perception of air
      pollution in China. J. Environ. Dev. 2019, 28, 78–105. [CrossRef]
24.   To, W.M.; Lee, P.K. Energy consumption and economic development in Hong Kong, China. Energies 2017, 10, 1883. [CrossRef]
25.   Ong, S.G.; Liu, J.; Wong, C.M.; Lam, T.H.; Tam, A.Y.C.; Daniel, L.; Hedley, A.J. Studies on the respiratory health of primary school
      children in urban communities of Hong Kong. Sci. Total Environ. 1991, 106, 121–135. [CrossRef]
26.   Sequeira, R.; Lai, K.H. The effect of meteorological parameters and aerosol constituents on visibility in urban Hong Kong. Atmos.
      Environ. 1998, 32, 2865–2871. [CrossRef]
27.   Wang, T. Study of Visibility Reduction and Its Causes in Hong Kong, Report to the Air Services Group; Tender Ref. AS 01-286; The
      Environmental Protection Department of HKSAR: Kowloon, Hong Kong, 2003.
28.   Chen, H.H.; Wu, D.; Tan, H.B.; Li, F.; Fan, S.J. Study on the character of haze weather process from the year 2001 to 2008 over the
      Pearl River Delta. J. Trop. Meteorol. 2010, 26, 147–155.
29.   Deng, H.; Tan, H.; Li, F.; Cai, M.; Chan, P.W.; Xu, H.; Huang, X.; Wu, D. Impact of relative humidity on visibility degradation
      during a haze event: A case study. Sci. Total Environ. 2016, 569, 1149–1158. [CrossRef]
30.   Thach, T.Q.; Wong, C.M.; Chan, K.P.; Chau, Y.K.; Chung, Y.N.; Ou, C.Q.; Yang, L.; Hedley, A.J. Daily visibility and mortality:
      Assessment of health benefits from improved visibility in Hong Kong. Environ. Res. 2010, 110, 617–623. [CrossRef] [PubMed]
31.   Yue, R.P.; Lee, H.F.; Hart, M.A. The human dimension of visibility degradation in a compact city. Nat. Hazards 2016, 82, 1683–1702.
      [CrossRef]
Environments 2021, 8, 51                                                                                                               11 of 11

32.   Yue, R.P.; Lee, H.F.; Hart, M.A. Perceptions of visibility degradation in Hong Kong. J. Environ. Plan. Manag. 2017, 60, 1073–1091.
      [CrossRef]
33.   Chan, C.K.; Yao, X. Air pollution in mega cities in China. Atmos. Environ. 2008, 42, 1–42. [CrossRef]
34.   HKEPD. Pollutant Long-Term Trends (1990–2018). 2019. Available online: https://www.aqhi.gov.hk/api_history/english/
      report/files/aqt18e.pdf (accessed on 3 June 2021).
35.   Ball, P. Counting Google searches predicts market movements. Nature 2013, 12879. [CrossRef]
36.   Corbi, R.; Picchetti, P. The cost of gendered attitudes on a female candidate: Evidence from Google Trends. Econ. Lett. 2020, 196,
      109495. [CrossRef]
37.   GovHK. Air Quality Health Index. Hong Kong Special Administrative Region Government, 2014. Available online: http:
      //www.gov.hk/en/residents/environment/air/aqhi.htm (accessed on 3 June 2021).
38.   Wong, T.W.; Tam, W.W.S.; Lau, A.K.H.; Ng, S.K.W.; Yu, I.T.S.; Wong, A.H.S.; Yeung, D. A Study of the Air Pollution Index Reporting
      System, Report to the Air Services Group; Tender Ref. AP 07-085; The Environmental Protection Department of HKSAR: Kowloon,
      Hong Kong, 2012.
39.   Tan, H.B.; Yin, Y.; Li, F.; Liu, X.T.; Chan, P.W.; Deng, T.; Deng, X.J.; Wan, Q.L.; Wu, D. Measurements of particle number size
      distributions and new particle formation events during winter in the Pearl River Delta region, CHINA. J. Trop. Meteorol. 2016, 22,
      191.
40.   Yang, H.-L.; Zhang, Y.; Li, L.; Chan, P.W.; Lu, C.; Zhang, L. Characteristics of Aerosol Pollution under Different Visibility
      Conditions in Winter in a Coastal Mega-City in China. J. Trop. Meteorol. 2020, 26. [CrossRef]
41.   CAN. Survey on Air Quality and Respiratory Health of Children. 2020. Available online: http://www.hongkongcan.org/doclib/
      Parentsurveyppt.pdf (accessed on 10 January 2021).
42.   CAN. Deterioration of Air Quality in PRD Region as Ozone Level Continues to Break Record High and Level of Nitrogen
      Dioxide and Particulate Matters Cease to Drop. 2020. Available online: http://www.hongkongcan.org/hk/article/deterioration-
      airquality-prd-region/ (accessed on 3 June 2021).
43.   Li, X.; Qiao, Y.; Zhu, J.; Shi, L.; Wang, Y. The “APEC blue” endeavor: Causal effects of air pollution regulation on air quality in
      China. J. Clean. Prod. 2017, 168, 1381–1388. [CrossRef]
44.   Zheng, Y.; Xue, T.; Zhang, Q.; Geng, G.; Tong, D.; Li, X.; He, K. Air quality improvements and health benefits from China’s clean
      air action since 2013. Environ. Res. Lett. 2017, 12, 114020. [CrossRef]
45.   Guo, H.; Ding, A.J.; So, K.L.; Ayoko, G.; Li, Y.S.; Hung, W.T. Receptor modeling of source apportionment of Hong Kong aerosols
      and the implication of urban and regional contribution. Atmos. Environ. 2009, 43, 1159–1169. [CrossRef]
46.   Yuan, Z.B.; Yu, J.Z.; Lau, A.K.H.; Louie, P.K.K.; Fung, J.C.H. Application of positive matrix factorization in estimating aerosol
      secondary organic carbon in Hong Kong and its relationship with secondary sulfate. Atmos. Chem. Phys. 2006, 6, 25–34. [CrossRef]
47.   Hedley, A.J.; Wong, C.M.; Thach, T.Q.; Ma, S.; Lam, T.H.; Anderson, H.R. Cardiorespiratory and all-cause mortality after
      restrictions on sulphur content of fuel in Hong Kong: An intervention study. Lancet 2002, 360, 1646–1652. [CrossRef]
48.   Peters, J.; Hedley, A.J.; Wong, C.M.; Lam, T.H.; Ong, S.G.; Liu, J.; Spiegelhalter, D.J. Effects of an ambient air pollution intervention
      and environmental tobacco smoke on children’s respiratory health in Hong Kong. Int. J. Epidemiol. 1996, 25, 821–828. [CrossRef]
49.   Han, L.; Sun, Z.; He, J.; Hao, Y.; Tang, Q.; Zhang, X.; Zheng, C.; Miao, S. Seasonal variation in health impacts associated with
      visibility in Beijing, China. Sci. Total Environ. 2020, 730, 139149. [CrossRef] [PubMed]
50.   Huang, W.; Tan, J.; Kan, H.; Zhao, N.; Song, W.; Song, G.; Chen, G.; Jiang, L.; Jiang, C.; Chen, R.; et al. Visibility, air quality and
      daily mortality in Shanghai, China. Sci. Total Environ. 2009, 407, 3295–3300. [CrossRef]
51.   Lee, J.Y.; Jo, W.K.; Chun, H.H. Long-term trends in visibility and its relationship with mortality, air-quality index, and meteorolog-
      ical factors in selected areas of Korea. Aerosol Air Qual. Res. 2014, 15, 673–681. [CrossRef]
52.   Tian, L.; Hossain, S.R.; Lin, H.; Ho, K.F.; Lee, S.C.; Ignatius, T.S. Increasing trend of primary NO 2 exhaust emission fraction in
      Hong Kong. Environ. Geochem. Health 2011, 33, 623–630. [CrossRef]
53.   Xue, L.; Wang, T.; Louie, P.K.; Luk, C.W.; Blake, D.R.; Xu, Z. Increasing external effects negate local efforts to control ozone air
      pollution: A case study of Hong Kong and implications for other Chinese cities. Environ. Sci. Technol. 2014, 48, 10769–10775.
      [CrossRef] [PubMed]
54.   IQAir. 2019 World Air Quality Report; IQAir Group: Goldach, Switzerland, 2020.
55.   HKEPD. Hong Kong’s Air Quality Objectives. 2014. Available online: https://www.epd.gov.hk/epd/english/environmentinhk/
      air/air_quality_objectives/air_quality_objectives.html (accessed on 3 June 2021).
56.   WHO. Air Quality Guidelines for Particulate Matter, Ozone, Nitrogen Dioxide and Sulfur Dioxide, Global Update; World Health
      Organization: Geneva, Switzerland, 2005.
57.   HKEPD. Compliance Status of Air Quality Objectives in 2019. 2020. Available online: https://www.epd.gov.hk/epd/sites/
      default/files/epd/english/environmentinhk/air/air_quality_objectives/files/compliance_eng.pdf (accessed on 3 June 2021).
58.   Brimblecombe, P.; Ning, Z. Effect of road blockages on local air pollution during the Hong Kong protests and its implications for
      air quality management. Sci. Total Environ. 2015, 536, 443–448. [CrossRef] [PubMed]
59.   Kan, C. Expanding pedestrian zones can solve Hong Kong’s air pollution problems. South China Morning Post, 27 October 2015;
      P2.
60.   Bickerstaff, K.; Walker, G. Public understandings of air pollution: The ‘localisation’ of environmental risk. Glob. Environ.
      Chang.-Hum. Policy Dimens. 2001, 11, 133–145. [CrossRef]
You can also read