Visit SLO CAL County-Wide Conference Center Market - April 2017 - Simpleview CMS
←
→
Page content transcription
If your browser does not render page correctly, please read the page content below
Visit SLO CAL
County-Wide Conference Center Market
                               Study
                            April 2017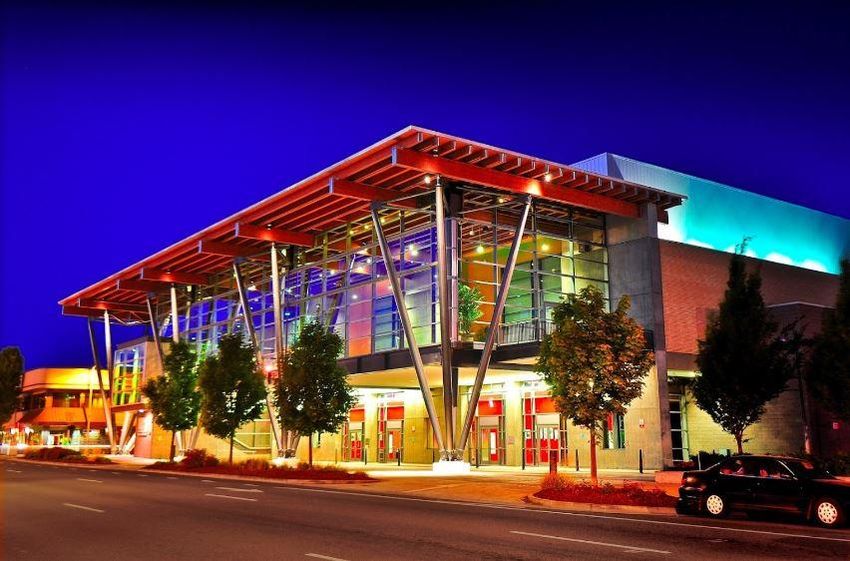
TABLE OF CONTENTS
Sections
1.0 Preface………………………………………………………...                2
2.0 Executive Summary………………………………………….             3
3.0 Local Market Conditions…………………………………...... 9
  3.1 Demographics…………………………………………..... 10
  3.2 Transportation…………………………………………….. 18
  3.3 Lodging……………………………………………………. 23
  3.4 Local Meeting Space…………………………………….. 30
4.0 Demand Analysis…………………………………………….. 34
  4.1 Conference and Convention Center Trends…………… 35
  4.2 Competitive Market Analysis…………...……………….. 40
  4.3 Comparable Facilities ……………………………........... 44
  4.4 Meeting Planner Survey…………………………………. 66

                                                        1              Vi s i t S L O C A L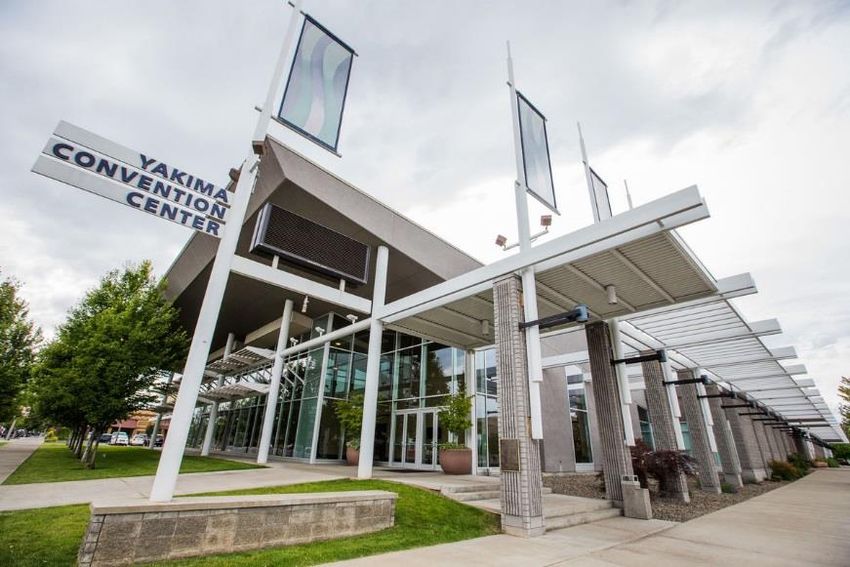
1.0 - PREFACE
In December of 2016, Visit SLO CAL (“Client ”) engaged Brailsford & Dunlavey (“B&D”) to analyze the market potential for a conference center (“the Project”) located in
San Luis Obispo County (“the County”). The Client has no intention of building, owning, or operating the Project. The plan outlined herein is designed to be advanced by
a local municipality, private party, or a combination of both. To complete this project, B&D conducted a detailed market study and demand analysis. Based on information
contained herein, a series of next steps to complete the work effort includes a site analysis and evaluation, development of a financial pro forma, and quantifying
economic and fiscal benefits.
B&D completed each analysis under the conditions and assumptions outlined below:
The analyses, recommendations, observations, and conclusions contained in this study represent the
THE PROJECT TEAM WAS COMPRISED
professional opinions of B&D with such opinions based on original research conducted using primary,
OF THE FOLLOWING INDIVIDUALS:
secondary, and tertiary sources, and the project team’s professional experience.
• Bill Mykins, Vice President, RA, LEED AP
The project team performed its work using industry information and public documents that are deemed
• Matt Bohannon, Regional Vice President
reliable, but whose accuracy cannot be guaranteed.
• Bryan Slater, Project Manager
Due to variations in national and regional economic conditions, as well as other important factors, actual
• Nick Champagne, Project Analyst
expenses and revenues may vary from projections, and these variances may be significant. As such, B&D
makes no assurance and provides no guarantee that results identified in this study will be
achieved. Economic and market conditions, management action or inaction, and implementation timing, as
well as other important circumstances, often do not occur as planned and such deviations can be material
2 Vi s i t S L O C A L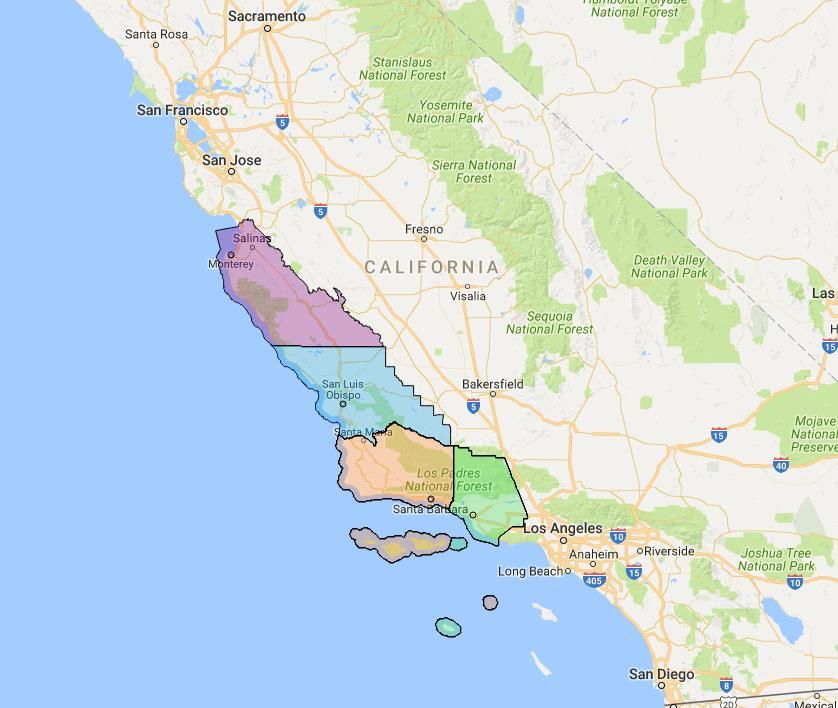
2.0 - EXECUTIVE SUMMARY
Objectives
                                                                                                   Local Market
                                                                                                    Conditions                         •    Demographics
The purpose of this study is to assess the feasibility of a new conference center in San Luis
                                                                                                                                       •    Transportation
Obispo County and develop a building program that is supportable by the market. The
                                                                                                                                       •    Lodging
project’s feasibility is evaluated by its ability to capture unaccommodated demand due to
                                                                                                                                       •    Local Meeting Space
current space restrictions with County space inventory.                                                Demand
                                                                                                       Analysis                        •    Conference Center Trends
                                                                                                                                       •    Competitive Market Analysis
Demographics
                                                                                                                                       •    Comparable Facilities

                                                                                                     Market                            •    Meeting Planner Survey
The figure to the right examines County demographic characteristics in relation to state and
national characteristics. The County’s population of 284,000 is expected to grow at 0.7%
                                                                                                   Supported
                                                                                                                                       •    Building Program
                                                                                                Building Program
over the next five years, which is slightly below the estimated state and national growth of
0.9% and 0.8%, respectively. The County’s population increases to 1.9 million when a 100-
                                                                                                                         Est                                      Est.
mile radius is applied. This 100-mile population is the considered a conference center’s          San Luis Obispo               Population 5-      Total
                                                                                                                     Population                                Normalized
                                                                                                      County                    Year Growth %   Households
primary catchment area and is the basis in which comparable facilities were chosen. The                                (2016)                                   Income

County’s normalized income of $57,000 is comparatively lower than both the state and                    County        283,892        0.7%         108,654        56,615
national levels by 19% and 34%, respectively.                                                            State       39,500,000      0.9%        13,400,000      68,747
                                                                                                        National    323,900,000      0.8%        124,300,000     79,549

                                                                                                Source: SitesUSA

                                                                                                 FIGURE 2.1: County, State, and National Demographics

                                                                                     3                                                            Vi s i t S L O C A L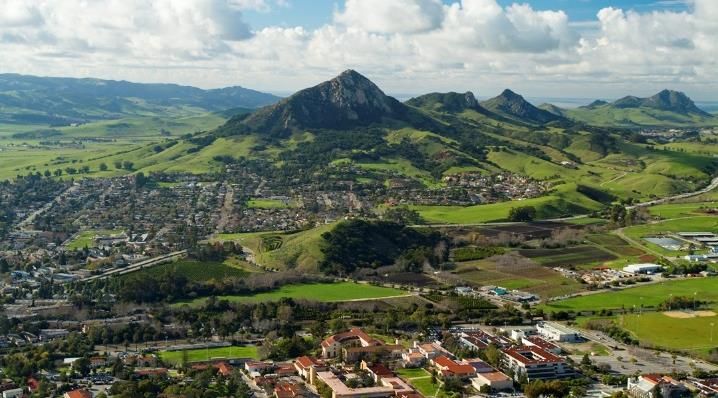
2.0 - EXECUTIVE SUMMARY
Meeting Space Inventory and Hotel Performance
Largest Space Total Indoor Total Sellable
Area # of Properties
B&D identified 46 properties within the County that offer sellable meeting space, (SQ FT) Sellable SQ FT SQ FT
34 of which have on-site lodging. The largest spaces in the County are two Atascadero 4,425 5 24,737 27,237
Five Cities 2,977 12 23,015 47,165
exhibit halls, which measure 20,000 (Madonna Inn) and 18,600 (Paso Robles
Morro Bay 2,500 1 5,325 10,985
Event Center) SQ FT. The Embassy Suites in San Luis Obispo offers the largest Paso Robles 18,624 8 68,482 138,145
ballroom at 5,100 SQ FT. The average ballroom size in comparable facilities San Luis Obispo 20,000 16 79,452 102,412
Other 3,360 4 8,045 20,045
(discussed further on page 6) is 17,500 SQ FT, which speaks to an obvious
Average 8,648 8 34,843 57,665
shortcoming in ballroom space in the County. Ballrooms are generally the most Total - 46 209,056 345,989
sought after space in conference centers due to their flexibility and ability to host Source: Internet research
FIGURE 2.2: Existing Meeting Space by County Area
plenary sessions. As such, the County is severely restricted in its ability to host
San Luis Obispo County Hotel Performance
larger groups due to a lack of suitable ballroom space alone.
$200.00 100%
$180.00 90%
$160.00 80%
86%
There are over 150 hotels within the County that combine to offer nearly 9,000 $140.00
70%
$160
60%
$120.00
rooms. Figure 2.3 displays key hotel performance metrics, which shows that the 50%
$100.00
40%
County demand patterns for hotel room nights are highly seasonal. RevPAR $80.00
30%
$60.00 20%
(Revenue per available room) of $160 during peak summer months is 172% $40.00 $59
10%
$20.00 0%
higher than the January low of $59 and occupancy levels of 50% in January are November December January '16 February March '16 April '16 May '16 June '16 July '16 August '16 September October '16
'15 '15 '16 '16
72% lower than occupancy in peak summer months (86% in July). ADR RevPAR Occupancy
FIGURE 2.3: County Hotel Performance
4 Vi s i t S L O C A L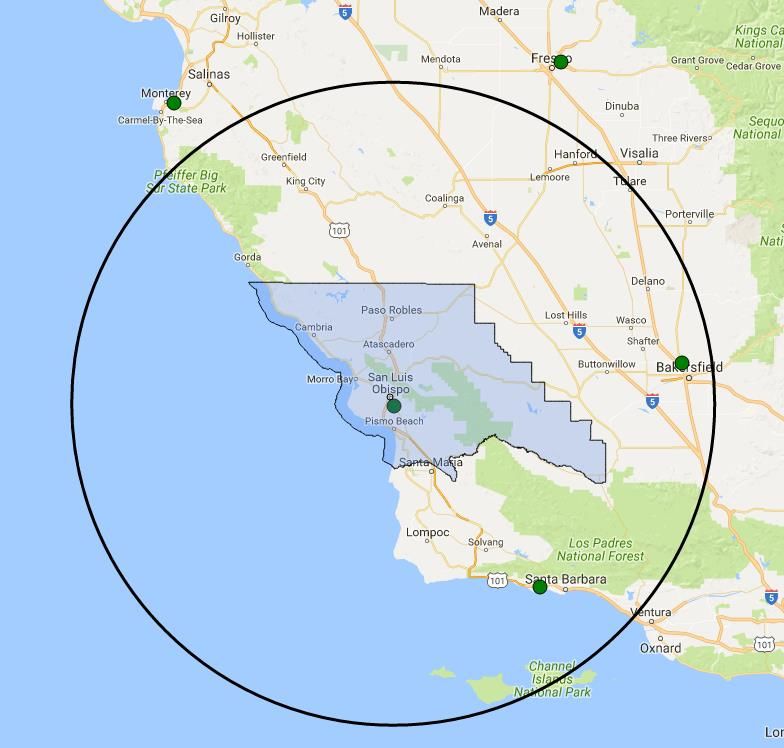
2.0 - EXECUTIVE SUMMARY
Competitive Regional Markets

B&D identified four competitive regional markets: Santa Barbara, Fresno, Monterey, and Bakersfield. Monterey is San Luis Obispo County’s primary competitive
market due to its existing conference center, like population, similar destination appeal, and hotel inventory. Although Santa Barbara is similar to Monterey in terms of
population (each have MSA populations of nearly 450,000) and would otherwise be considered a close competitor, it lacks a dedicated conference / public assembly
facility, which marginalizes its competitive positioning. The Monterey Conference Center has the largest ballroom in any market at nearly 20,000 SQ FT, while the
County’s largest ballroom is 5,100 SQ FT, placing it last among competitors. Monterey and San Luis Obispo rank first and second in terms of sleeping rooms, with
12,224 and 8,887, respectively. The County’s hotel inventory in relation to other competitors speaks to its suitability for a conference center development.

                                                                     San Luis Obispo             Fresno               Monterey          Bakersfield       Santa Barbara
                                                                    Total       Rank     Total            Rank    Total      Rank    Total       Rank    Total      Rank

                                Hotels                              153             2     93               3      250         1       46          5       81         4
             Hotel Statistics

                                Sleeping Rooms                     8,887            2    4,895             4     12,224       1      4,675        5      4,897       3
                                Average Daily Rate (ADR)           $132             3    $93               4      $196        1      $78          5      $190        2
                                RevPAR                             $106             3    $60               4      $145        1      $48          5      $142        2

                                Largest Exhibit Space (SQ FT)      20,000           4   66,371             1        0         5     29,450        3     34,375       2
           Conference

                                Largest Ballroom / Meeting Room
                                                                   5,708            5   13,120             3     19,600       1      7,560        4     14,000       2
             Space

                                (SQ FT)
                                Total Sellable SQ FT              345,989           3   229,274            4     391,000      2     177,000       5     470,790      1
                                SQ FT per Hotel Room                38.7            3    46.8              2      32.0        5      37.9         4      96.1        1

         Source: NAICS Business Patterns, SitesUSA, CVENT, Internet research, STR
         FIGURE 2.4: Competitive Market Characteristics

                                                                                                     5                                                     Vi s i t S L O C A L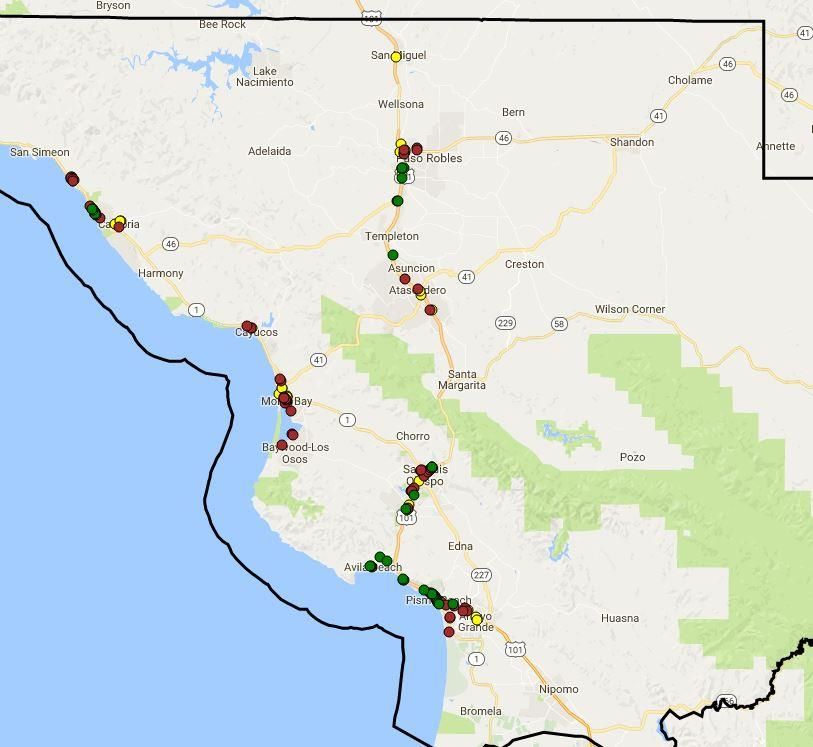
2.0 - EXECUTIVE SUMMARY
Comparable Facilities Analysis
B&D identified 11 comparable conference facilities with public ownership and similar 100-mile populations. The average comparable ballroom size is over 17,500 SQ FT,
as shown in Figure 2.6. On average, comparable facilities held 259 events in the most recent year and had a total average attendance of 68,000. Comparable facilities
attract an average of two attendees per square foot of sellable space on an annual basis. Three of the five comparable venues with attendees per SQ FT under 2.0
contain exhibit space. This comparatively lower ratio implies that exhibit space provides diminishing returns for attracting additional events and patrons. For reference,
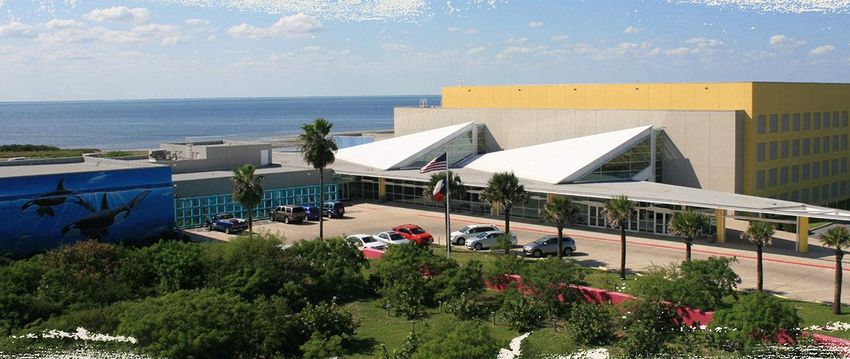
exhibit space in comparable facilities measure between 7,500 SQ FT at Wenatchee and 30,000 SQ FT at Wilmington. The three top performing conference centers in
terms of attendance per SQ FT (Two Rivers, Yakima, and Pueblo) offer no exhibit space.
Conference Center Attendance Sellable SQ FT Attendees per SQ FT Ballroom Size (SQ FT)
Two Rivers Convention Center 59,310 20,700 2.9 Yakima Convention Center 29,568
Yakima Convention Center 101,762 37,367 2.7 Emerald Coast Convention Center 21,000
Pueblo Convention Center 48,377 23,500 2.1 Monterey Conference Center 20,395
Wenatchee Convention Center 50,510 25,462 2.0 Salem CC & The Grand Hotel 20,150
Vicksburg Convention Center 50,510 25,557 2.0 Two Rivers Convention Center 18,600
Salem Convention Center & The Grand Hotel 58,000 30,000 1.9 Average 17,588
The Conference & Event Center Niagara Falls 84,123 51,000 1.6 Pueblo Convention Center 16,200
Wilmington Convention Center 85,246 57,580 1.5
Wilmington Convention Center 11,800
Monterey Conference Center 61,931 43,000 1.4
The CC Niagara Falls 10,500
Emerald Coast Convention Center 78,000 55,495 1.4
Wenatchee Convention Center 10,080
Average 67,777 36,966 1.95 Vicksburg Convention Center 0
Median 60,621 33,684 1.95 South Padre Island Convention Centre 0
Maximum 101,762 57,580 2.87
0 5,000 10,000 15,000 20,000 25,000 30,000 35,000
Source: Internet research, telephone interviews with city officials, telephone interviews with site staff
FIGURE 2.6: Comparable Facilities Ballroom Size
FIGURE 2.5: Comparable Facilities Attendance per SQ FT
6 Vi s i t S L O C A L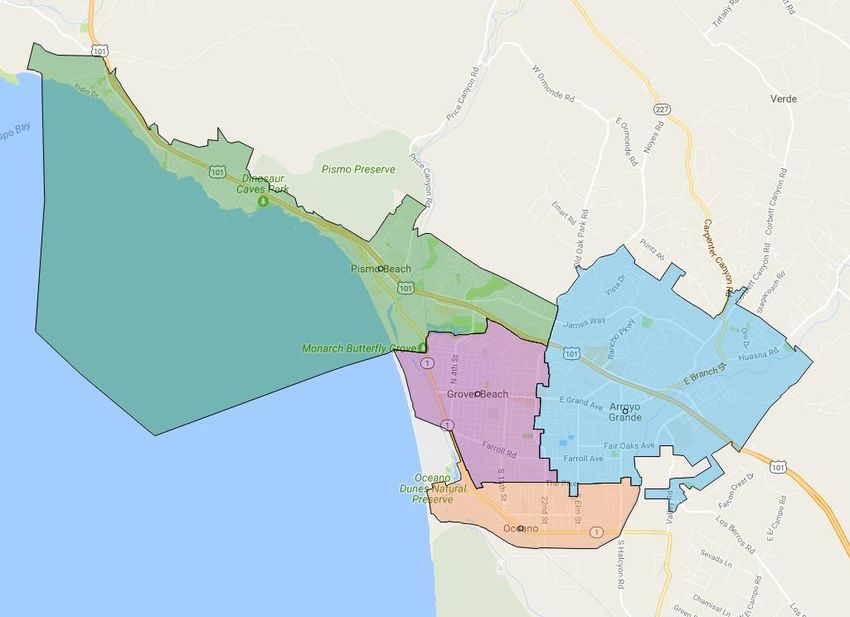
2.0 - EXECUTIVE SUMMARY
Survey Analysis What size (in square feet) ballroom does your organization
require? (n=46)
B&D conducted an Internet-based survey that measured the opinions and desires of 100% 100%
90% 95%
meeting planners related to location and building layout. Responses indicated that a 80%
70%
ballroom of 15,000 SQ FT would satisfy 70% of demand and a ballroom of 20,000 SQ FT 71%
60%
50% 56%
would satisfy 95%. Nearly 60% of respondents indicated that no exhibit space was
40%
necessary for their organization’s event. Other key survey findings are listed below: 30%
27%
20%
10%
0%
Two-thirds of respondents indicated that choice of city within the County would impact Less than 5,000 SQ 5,000 - 10,000 SQ FT 10,000 - 15,000 SQ FT 15,000 - 20,000 SQ FT More than 20,000 SQ
FT FT
their decision to book an event. Respondents were then asked to choose their preferred
FIGURE 2.7: Required Ballroom Size
location within the County to book an event: 50% chose San Luis Obispo, 27% chose
Five Cities (Arroyo Grande, Grover Beach, Pismo Beach), and 17% chose Paso Robles. What day(s) of the week is your organization most likely to
book a meeting / event in San Luis Obispo County? (Select
Survey results indicated that meeting planners are most likely to book events during the all that apply) (n=46)
week (Tuesday through Friday) during the fall and spring. These responses are positive 76% 74%
80%
63%
indicators for improving both mid-week visitation and low-season visitation. 57%
60%
43%
Consistent with B&D’s competitive market analysis, over 60% of respondents indicated 40% 30% 33%
that they have chosen to utilize meeting venues in Monterey as opposed to booking in 20%
San Luis Obispo County. Respondents indicated that meeting space inventory is the 0%
Monday Tuesday Wednesday Thursday Friday Saturday Sunday
primary reason for choosing Monterey. FIGURE 2.8: Day-of-Week Preference
7 Vi s i t S L O C A L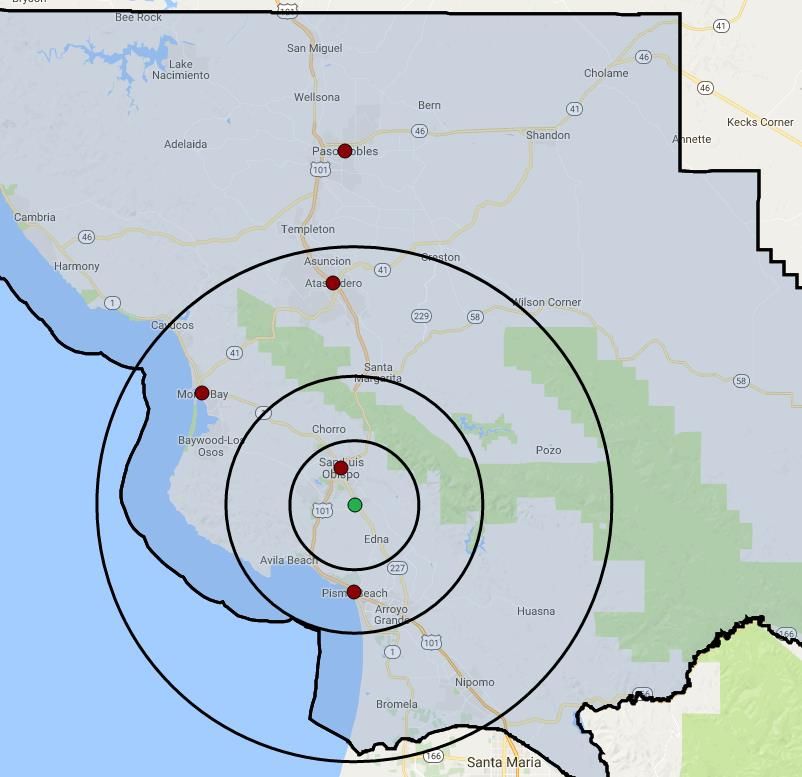
2.0 - EXECUTIVE SUMMARY
Outline Building Program

Based on analyses contained herein, the maximum market-supportable conference                                       Ballroom                     Breakout Spaces
                                                                                                                                                                                          Exhibition    Outdoor Total Indoor
                                                                                                Program                   Division                            Total SQ
center development ranges from 21,000 to 27,000 SQ FT of sellable square footage.                                SQ FT                      Quantity SQ FT                                  Space        Space Sellable SQ FT
                                                                                                                           Factor                                FT
The program will address current ballroom supply shortages, maximize return on                 Program 1         12,000           3              9            1,000       9,000                0          5,000         21,000
capital investment, provide an efficient footprint, and work to minimize operating costs.      Program 2         14,000           4              10           1,000      10,000                0          5,000         24,000
The program will need to be refined and scaled up or down as a site and location are           Program 3         16,000           5              11           1,000      11,000                0          5,000         27,000

selected. Primary factors influencing this recommendation are provided below:                Note: Build program are dependent on selected jurisdiction

                                                                                            FIGURE 2.9: Proposed Building Program Options I
• The County’s 100-mile population of 1.86 million is approximately 20% smaller than
  comparable markets. This alone would suggest a building program of 30,000 SQ FT.                                                Proposed Building Program (SQ FT)
                                                                                            30,000
                                                                                                                                                                                      27,000
• As discussed before, overbuilt facilities generally attract fewer attendees per SQ FT     25,000                                                        24,000
                                                                                                                         21,000
  of sellable space. Therefore, B&D’s recommendations align with the smaller                20,000
                                                                                                                                                                      16,000                           Ballroom
  comparable facilities that do not offer exhibit space.                                                                               14,000                                                          Breakout Space
                                                                                            15,000
                                                                                                        12,000
                                                                                                                                                                          11,000                       Outdoor Space
                                                                                                                                            10,000
                                                                                            10,000            9,000
                                                                                                                                                                                                       Total Indoor Sellable SQ FT
• Survey results indicate demand for up to 1,000 in a banquet capacity for a plenary                                5,000                         5,000                           5,000
                                                                                             5,000
  session. Depending on architectural considerations, this would justify a ballroom of
                                                                                                 0
  approximately 14,000 to 15,000 SQ FT. Survey respondents also indicated the                                 Program 1                      Program 2                     Program 3
  preference for up to 10 meeting rooms                                                     FIGURE 2.10: Proposed Building Program Options II

                                                                                     8                                                                                                    Vi s i t S L O C A L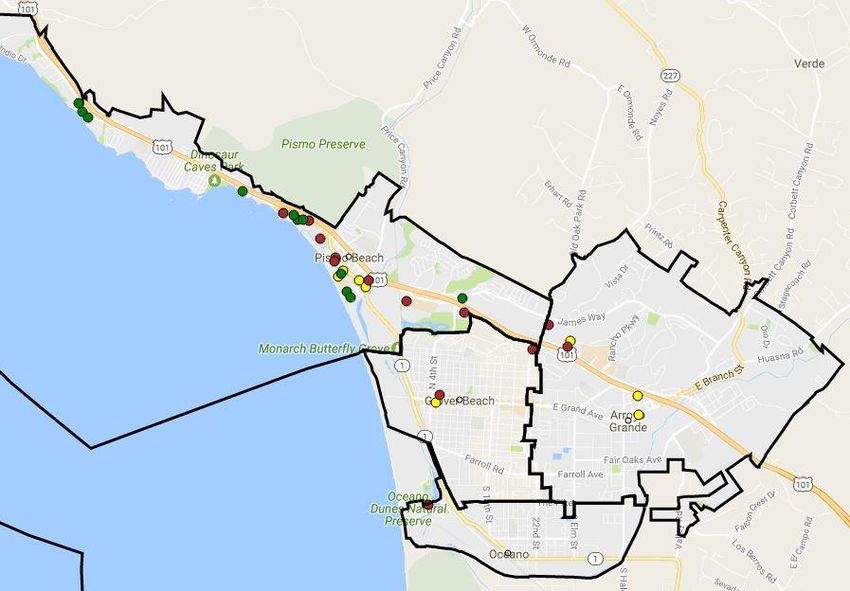
2.0 - EXECUTIVE SUMMARY
Next Steps

In alignment with the project understanding, B&D understands that a local municipality will be relied upon to advance the market study into a full conference center
development plan. To move forward, B&D recommends the following:

•   A Project Initiation meeting with the selected municipality to verify and confirm study objectives, discuss work completed-to-date on behalf of Visit SLO CAL,
    discuss timelines, and gather background information.
•   Update the Local Market Conditions section to, at a deeper level, examine the characteristics and traits of the community advancing the effort.
•   A Site Analysis to analyze opportunities and constraints of sites regarding the development of the project. This step can be bypassed if the community wishes to
    proceed with a predetermined site.
•   A Financial Analysis involving a recommended facility program, conceptual development budget, utilization estimate, integrated financial model, sensitivity
    analysis, and the identification of potential funding options.
•   An Economic and Fiscal Benefits Analysis to quantify the impact of operating projections and construction costs on the City, County, and state.
•   Upon completion of all tasks previously discussed, complete Project Reporting activities, including a draft final report, final presentation, and final report.

                                                                                       9                                                               Vi s i t S L O C A L
3.0 - LOCAL MARKET CONDITIONS
Introduction Methodology
The Local Market Conditions Analysis provides an overview of demographic and Utilizing primary and secondary sources, B&D completed a series of related
socioeconomic conditions that influence demand for a conference center project exercises to gain an understanding of the demographic and economic
in the County. The analysis is utilized as a starting point for evaluating the overall environment of the San Luis Obispo County market. B&D utilized data provided
suitability of the County for a conference center development and selecting peer by SitesUSA to develop all demographic comparisons and analyses. The
conference center developments, which is the crux of the assignment along with software program combines geographic information systems (“GIS”) technology
an Internet survey. B&D analyzed several components in the local market with extensive demographic, consumer, and business information to generate a
conditions analysis, including: detailed statistical profile for the County. The five areas listed below are
examined in detail throughout this section and are those that are the most
• Analysis of Demographic measurements such as population, household suitable incorporated areas for development of the facility.
income, median age, and business climate within the County;
• Examination of Transportation Factors including Interstate access, air • Atascadero
access, and rail access; • Five Cities (Pismo Beach, Grover Beach, Arroyo Grande, and Oceano)
• Evaluation of Lodging Infrastructure including property type, seasonality • Morro Bay
trends, and key metrics (ADR, RevPAR, and Occupancy); and • Paso Robles
• An analysis of Meeting Space Inventory analysis of sellable meeting space • San Luis Obispo
in the County and facility elements (SQ FT, lodging, area, etc.).
10 Vi s i t S L O C A L3.0 - LOCAL MARKET CONDITIONS
Demographics
Market Definition
San Luis Obispo County is located in California’s “Central Coast” Region. The
region is primarily comprised of four counties located between the San Francisco
and Los Angeles regions and include the counties of Monterey, San Luis Obispo,
Santa Barbara, and Ventura.
The County is part of the San Luis Obispo-Paso Robles Metropolitan Statistical Monterey
Area (MSA). The federal government’s Office of Management and Budget defines
County
an MSA as a region with a densely populated core surrounded by less populated
San Luis Obispo
communities that pose a high degree of economic and social integration. San Luis County
Obispo County and San Luis Obispo-Paso Robles MSA share the same Ventura County
boundaries, a shared delineation that is somewhat atypical in B&D’s experience. Santa Barbara
As such, the MSA and County have the same demographic measurements. County
FIGURE 3.1: Central Coast Region Overview
11 Vi s i t S L O C A L3.0 - LOCAL MARKET CONDITIONS
Demographics
Local, Regional, and National Demographics
The table below examines population, projected population growth, household size, and the Household Income
median age for the County and MSA in relation to state and national averages. The County has a $100,000 $92,809
$90,000 $84,356
projected population growth rate that is slightly under with state and national averages. The $79,549 $79,549
$80,000
$68,747
Median age is 38.5, which is elevated in relation to the state and national averages. The County $70,000
$56,615
household income level of $84,356 is 9% below California’s average of $92,809. When income is $60,000
$50,000
normalized by the area’s cost of living that is 49% higher than the national average, the County $40,000
has an estimated normalized household income of $56,615, which is less than both the state and $30,000
$20,000
national averages. Normalized household income is a conceptual measurement and only utilized
$10,000
to show the impact that cost of living has on discretionary dollars for entertainment purchases. $-
MSA State National
Est. Avg. Household Income Est. Normalized Income
Est Population Population 5- Total Avg Household
Area Median Age
(2016) Year Growth % Households Size
FIGURE 3.3: Household Income Comparisons
Source: SitesUSA
MSA 283,892 0.7% 108,654 2.5 38.5
State 39,500,000 0.9% 13,400,000 2.9 35.6
National 323,900,000 0.8% 124,300,000 2.5 37
Source: SitesUSA
FIGURE 3.2: MSA, State, and National Demographics
12 Vi s i t S L O C A L3.0 - LOCAL MARKET CONDITIONS
Demographics
County Population Distribution
The City of San Luis Obispo is the County’s largest city with 47,900 residents. Paso Total 5-Year Pop. Total Household Average HH
Market
Robles and Atascadero are the second and third largest cities with over 30,000 Population Growth % Households Size Income
residents, respectively. The remainder of County cities have under 20,000 residents. San Luis Obispo 47,900 0.7% 19,813 2.3 $71,512
Paso Robles 31,624 0.7% 11,466 2.7 $79,173
Nearly all population centers within the County have 5-year population growth rates
Atascadero 30,328 0.9% 11,547 2.5 $87,145
consistent with the national and state averages. Though growth measurements are Arroyo Grande* 18,163 0.8% 7,507 2.4 $85,698
consistent, income measurements vary significantly, ranging from $61,400 at Oceano to Los Osos 14,869 0.8% 6,239 2.4 $83,771
Grover Beach* 13,700 0.7% 5,330 2.5 $71,557
$87,100 at Atascadero. Morro Bay 10,745 0.8% 5,106 2.1 $68,567
Pismo Beach* 8,325 0.7% 4,190 2.0 $84,789
Oceano* 7,781 0.5% 2,751 2.8 $61,381
In this analysis, B&D refers to the “Five Cities Area” on several occasions. This includes
Avila Beach 1,729 0.9% 886 2.0 $83,697
Arroyo Grande, Grover Beach, Pismo Beach, and Oceano. Shell Beach was previously
Average - 0.7% 7,748 2.4 $78,747
part of this designation but has since been integrated with Pismo Beach. Between these
Source: SitesUSA
four cities, the population is 48,000. A map depicting the Five Cities area and other *Included in Fiv e Cities area
FIGURE 3.4: San Luis Obispo County Population Distribution (2016)
areas under consideration in this study is provided on the following page.
.
13 Vi s i t S L O C A L3.0 - LOCAL MARKET CONDITIONS
Demographics
County Areas
The map to the right shows the geographical relationship between the five areas under consideration for Paso Robles
development of the project. The Five Cities area is broken out in greater detail on the smaller map.
The shading outlines the city borders for each community. Four of the five areas are located on U.S.
Route 101/California State Route 1. The Five Cities and Morro Bay border the Pacific Ocean, while San Atascadero
Luis Obispo is located approximately eight to 10 miles east of the two. Atascadero and Paso Robles
are located to the north of San Luis Obispo, as designated by the blue and red shading on the map. Morro
Bay
San Luis
Obispo
Five
Cities
Pismo Beach
FIGURE 3.5: San Luis Obispo County Areas
Arroyo
Grover Beach Grande
Oceano
14 Vi s i t S L O C A L3.0 - LOCAL MARKET CONDITIONS
Demographics
County Areas
Atascadero Five Cities
Atascadero is located in the northern portion of the County on
Route 101 below Paso Robles. The city has a population of just
over 30,000. Average household income of over $87,000 is the
highest in the County. Atascadero has been the home of
Pismo Beach
Charles Paddock Zoo, which attracts approximately 72,000
Arroyo
visitors a year (According to American Zoos). Grover Beach Grande
The Five Cities area is the County’s most populated area and is
Oceano
comprised of four separate municipalities: Arroyo Grande,
Grover Beach, Oceano, and Pismo Beach. The area is primarily
located along the coast, just west of San Luis Obispo. U.S. FIGURE 3.6: City of Atascadero Boundaries FIGURE 3.7: Five Cities Boundaries
Route 101 reaches 79,000 in daily traffic counts, which is the
highest in the County. Pismo Beach is a popular vacation
destination and has more luxury (4) hotels than all other areas
combined. The location of the Five Cities Area makes it a prime
tourist destination.
15 Vi s i t S L O C A L3.0 - LOCAL MARKET CONDITIONS
Demographics
County Areas (Cont.) Morro Bay Paso Robles
Morro Bay is located northwest of the City of San Luis Obispo
and is the only city not located on U.S. Route 101. Vehicular
access to Morro Bay is provided via CA – 1 and CA – 41. The
city’s population (11,000) and average household income
($68,000) are the lowest in respect to other areas under
consideration.
Paso Robles is the northernmost area under consideration in
the County and is located on U.S. Route 101. The city has an
estimated population of nearly 32,000, ranking third behind San
Luis Obispo and the Five Cities. The average household FIGURE 3.8: City of Morro Bay Boundaries FIGURE 3.9: City of Paso Robles Boundaries
income in Paso Robles is just over $78,000, which is
commensurate with the County average. Paso Robles is a
popular tourist destination due to numerous wineries and an
emerging craft brewery scene. Firestone Walker Brewery,
which distributes beer nationally, is located in Paso Robles.
16 Vi s i t S L O C A L3.0 - LOCAL MARKET CONDITIONS
Demographics
County Areas (Cont.)
San Luis Obispo
The City of San Luis Obispo is located inland along U.S. Route 101 with direct
freeway access to Morro Bay via CA – 1. The City has the second highest population
behind the Five Cities area with nearly 48,000 residents. Average Household income
in the city is $72,000, which is nearly 7,000 below the County Average. San Luis
Obispo’s higher population is partly attributable to Cal Poly’s student presence. San
Luis Obispo’s downtown is a popular destination for tourists and full-time residents
and is generally considered the region’s commercial hub.
FIGURE 3.10: City of San Luis Obispo Boundaries
17 Vi s i t S L O C A L3.0 - LOCAL MARKET CONDITIONS
Demographics
Business Climate Rank Industry Business Employment
1 Education California Polytechnic State University 3,055
Retail trade is San Luis Obispo County’s top industry with 1,150 total establishments. This is 2 Healthcare Department of State Hospitals - Atascadero 2,000
followed by healthcare and social assistance (1,000), construction (930), scientific and 3 Correctional Facility California Men's Colony 1,540
technical services (890), and accommodation / foodservice (890). These five industries make 4 Public Utility Pacific Gas & Electric 1,900
5 Services Cal Poly Corp 1,400
up 58% of total business establishments. The largest employers in the County are Cal Poly,
6 Healthcare Tenet Healthcare 1,272
Atascadero State Hospital, and the California Men’s Colony. 7 Healthcare Compass Health Inc. 1,200
8 Education Lucia Mar Unified School District 1,000
Number of Establishments by Industry
1200 1,150 9 Education Paso Robles Public Schools 935
1,016
1000 933 10 Education San Luis Coastal Unified School District 902
885 894
800
11 Healthcare Dignity Health (Central Coast) 864
580 12 Software MINDBODY 650
600
412 439 447 13 Education Atascadero Unified School District 600
379
400 306
14 Government California Department of Transportation 544
200 122 125 132
84 51 56
3 11 8 9 7 13 24 3 4 5 12 16 40 15 Parks and Recreation California State Parks 440
0
Total 18,302
Education 35%
Healthcare 29%
Other 35%
Total Establishments 50 or More Employees Source: SLO Chamber of Commerce
FIGURE 3.11: San Luis Obispo County Establishments by Industry FIGURE 3.12: San Luis Obispo County Largest Employers
Source: NAICS Business Patterns
18 Vi s i t S L O C A L3.0 - LOCAL MARKET CONDITIONS
Transportation Factors
Vehicular Accessibility
Figure 3.13 shows San Luis Obispo County’s primary transportation arteries for
vehicular access. U.S. Route 101 is the County’s most used interstate, with daily traffic
CA - 41
counts reaching 79,000 in Pismo Beach. Four of the five areas under consideration CA - 46
(Paso Robles, Atascadero, San Luis Obispo, and Five Cities) are located along this
route. Morro Bay is the only area under consideration not located on U.S. Route 101.
California State Route 41 provides access to Morro Bay from Atascadero and provides
CA - 58
direct connectivity to Fresno. California State Route 1 allows access to the northwest
coast of San Luis Obispo County from the City of San Luis Obispo. Other Key routes
that are also outlined on the map include:
U.S. Route 101
• CA-166 links the County to the San Joaquin Valley via Santa Maria, which is
located just out of the County
• CA-46 provides access to Cambria from U.S. Route 101
CA - 166
• CA-58 provides access to Bakersfield through Santa Margarita
FIGURE 3.13: San Luis Obispo County Transportation Arteries
19 Vi s i t S L O C A L3.0 - LOCAL MARKET CONDITIONS
Transportation Factors
Air Accessibility
FAT
San Luis Obispo County Regional Airport is the primary passenger airport for the County. MRY
For frame of reference, Santa Barbara Municipal Airport (SBA), Bakersfield Meadows
Field Airport (BFL), Monterey Regional Airport (MRY), and Fresno Yosemite International
Airport (FAT) are also shown on the map. Each of these airports are the primary
passenger airports for regional competitive markets, which are identified in Section 4.0 –
Demand Analysis. Fresno and Monterey are the only passenger airports located outside
the 100-mile radius shown to the right. In B&D’s professional opinion, only SBA and MRY
BFL
could be utilized as secondary options for non-local patrons attending larger events such
SBP
as conferences or conventions.
SBA
100-Mile Radius
FIGURE 3.14: Regional Air Transportation Overview
20 Vi s i t S L O C A L3.0 - LOCAL MARKET CONDITIONS
Transportation Factors
Air Accessibility
Figure 3.15 below shows average passenger enplanement from 2011 to 2015 among regional airports. San Luis Obispo Regional Airport (SBP) ranks fifth in average
enplanement from 2011 to 2015 with 138,000 annual enplanements. Fresno-Yosemite International Airport (FAT) ranks first at 670,000 and is beneficiary off 11 non-stop
destinations. Figure 3.16 below also shows non-stop destinations by airport. Fresno offers air service to the most locations, with 10 domestic destinations and one
international (Guadalajara, Mexico). SBP currently offers four flight services: Los Angeles, Phoenix, San Francisco, Seattle/Tacoma, and Denver. B&D anticipates that
passenger totals at SBP will more closely resemble Monterey (MRY) in forthcoming years with the recent addition of Seattle/Tacoma and Denver as non-stop destinations.
Non-Stop Destinations
Passenger Enplanements (2011-2015 Average) SBP SBA BFL FAT MRY
800,000 Denver, CO Dallas/Fort Worth, TX Denver, CO Dallas/Fort Worth, TX San Francisco, CA
700,000 669,176 Los Angeles, CA Denver, CO Houston, TX Denver, CO Los Angeles, CA
600,000 Phoenix, AZ Los Angeles, CA Phoenix, AZ Guadalajara, Mexico Las Vegas, NV
500,000 San Francisco, CA Phoenix, AZ San Francisco, CA Las Vegas, NV Phoenix, AZ
350,770 Seattle/Tacoma, WA Portland, OR Los Angeles, CA San Diego, CA
400,000
San Francisco, CA Phoenix, AZ
300,000 Seattle/Tacoma, WA Portland, OR
190,103
200,000 140,990 138,318 Salt Lake City, UT
100,000 San Diego, CA
0 San Francisco, CA
FAT SBA MRY BFL SBP Seattle/Tacoma, WA
Source: Internet research
FIGURE 3.15: Regional Airport Average Passenger Enplanement
Source: FAA FIGURE 3.16: Regional Airport Services
21 Vi s i t S L O C A L3.0 - LOCAL MARKET CONDITIONS
Transportation Factors
Air Accessibility in Relation to County Areas
San Luis Obispo Regional Airport (SBP) is located 3.5 miles south of the City of San Luis
Obispo. The next closest area under consideration in this analysis is Five Cities, which is Paso Robles
located approximately 10 miles away. In comparison, Morro Bay is located 17 miles from
the airport, Atascadero 22 miles, and Paso Robles 36 miles. The close proximity of the
Five Cities and San Luis Obispo in relation to SBP provides the two cities with a strategic
advantage over the more distant areas of Morro Bay, Atascadero, and Paso Robles. Atascadero
Morro Bay
5 Miles
SLO
SBP
Five Cities
10 Miles 20 Miles
FIGURE 3.17: San Luis Obispo Regional Airport Location
22 Vi s i t S L O C A L3.0 - LOCAL MARKET CONDITIONS
Transportation Factors
Rail Accessibility
The County has three Amtrak stations, which are located in Paso Robles, San Luis
Obispo, and Grover Beach. The region is served by two lines, including the “Pacific
Surfliner” and “Coast Starlight.” The Coast Starlight, which is shown to the right,
provides service from Los Angeles to Seattle. As a result, there is connectivity to
major population centers including Seattle, Portland, Sacramento, Oakland / San
Francisco, and Los Angeles. San Luis Obispo County ranks fourth among regional
competitive markets in Amtrak boardings in 2014 with nearly 143,000. In Paso Robles
comparison, the Bakersfield station had nearly 514,000 boardings in 2014.
California Amtrak Boardings (2014)
600,000
513,884
500,000
387,640
San Luis Obispo
400,000 333,994
300,000
Grover Beach
200,000 142,552 FIGURE 3.19: Coast
Starlight Route
100,000
-
Bakersfield Fresno Santa Barbara San Luis Obispo County
FIGURE 3.18: San Luis Obispo County Amtrak Boardings
FIGURE 3.20: San Luis Obispo County Amtrak Stations
Source: Amtrak Fact Sheet, 2014
23 Vi s i t S L O C A L3.0 - LOCAL MARKET CONDITIONS
Lodging Infrastructure
Hotel Inventory
B&D Identified 153 hotels in San Luis Obispo County comprising 8,887 total rooms. The map
to the right shows hotel properties located within the County by classification as designated
by STR Global. STR Global classifies hotel chains based on their average daily rate (ADR).
There are six class segments: Economy, Midscale, Upper Midscale, Upscale, Upper Upscale,
and Luxury. Examples of each are listed below:
Economy: Days Inn, E-Z 8, Motel 6
Midscale: La Quinta, Vagabond Inn, Quality Inn
Upper Midscale: Best Western Plus, Holiday Inn Express, Hampton Inn & Suites
Upscale: Courtyard Marriott, Hilton Garden Inn, Spyglass Inn
Upper Upscale: Wyndham Hotels, Oakwood Premier, La Bellasera Inn & Suites
Luxury: The Cliffs Resort, Grand Hyatt, JW Marriot
Hotel classification is important since different groups gravitate toward different properties. Economy
For instance, “SMERF” (social, military, ethnic, religious, fraternal) groups are generally very Midscale and Upper
Midscale
price sensitive while corporate travelers are not. As such, understanding the depth and
Upscale and Above
breadth of offerings in each community is an important consideration.
FIGURE 3.21: San Luis Obispo County Hotel Inventory by Classification
24 Vi s i t S L O C A L3.0 - LOCAL MARKET CONDITIONS
Lodging Infrastructure
Hotel Inventory
Figure 3.22 below shows the number of total hotels in each area by their classification. Five Cities ranks first in total hotels (31) and is followed closely by San Luis Obispo
(30) and Morro Bay (27). The Five Cities also have the greatest number of “Upper Midscale” or better properties with 17. B&D has called out the number of “Upper
Midscale” or better properties since this classification often represents in the minimum desired quality by meeting planners. Atascadero has the smallest number of total
hotels with seven properties. Consistent with total hotel count, the Five Cities have the most hotel rooms at over 2,300. San Luis Obispo and Paso Robles are second and
third with 2,100 and nearly 1,400 rooms, respectively.
Hotel Rooms by County Area
San Luis 2,500 2,351
Property Type Atascadero Five Cities Morro Bay Paso Robles
Obispo 2,104
Economy 3 7 15 9 10 2,000
Midscale - 7 6 2 7
1,500 1,378
Upper Midscale 3 6 6 4 9
Upscale 1 4 - 2 2
Upper Upscale - 3 - 1 1 1,000 858
Luxury - 4 - 1 1 511
500
Total Hotels 7 31 27 19 30
Upper Midscale or Better 4 17 6 8 13
0
Source: Visit SLOCAL, Internet research
Five Cities San Luis Obispo Paso Robles Morro Bay Atascadero
FIGURE 3.22: San Luis Obispo County Hotel Inventory by Classification FIGURE 3.23: San Luis Obispo County Hotel Inventory
Source: Visit SLO CAL
25 Vi s i t S L O C A L3.0 - LOCAL MARKET CONDITIONS
Lodging Infrastructure
Seasonality
B&D used key hotel metrics defined below to evaluate seasonality trends in
San Luis Obispo County Hotel Performance
the San Luis Obispo County hotel market: $200.00
$187
$180.00
• Average Daily Rate (ADR): Represents the average rental income per $160.00
paid occupied room in a given time period.
$140.00
$160
• Occupancy: The proportion of rooms occupied or in use. $120.00
$100.00 $117
• Revenue Per Available Room (RevPAR): Calculated by multiplying ADR $80.00
by occupancy rate. $60.00
$40.00 $59
Figure 3.24 to the right shows ADR and RevPAR in the County. The San Luis $20.00
$-
Obispo hotel market is significantly impacted by seasonal demand patterns.
Key metrics such as RevPAR and ADR are highest during the summer months
at $160 and $186, respectively. This represents a 172% increase over the
ADR RevPAR
January RevPAR low of under $59. Occupancy in the County ranges from
Source: STR
50% in January to 86% in July. This variance of 70% is greater than the 60% FIGURE 3.24: San Luis Obispo County Hotel Performance Metrics and Seasonality
variance in ADR, which indicates that hotel seasonality is primarily a function
of occupancy.
26 Vi s i t S L O C A L3.0 - LOCAL MARKET CONDITIONS
Lodging Infrastructure
Seasonality & Revenue per Hotel Average Revenue per Hotel
$475,000 $424,414
$425,000
The line graph to the right shows average revenue per hotel over a 12- $375,000
$325,000
$275,000
month period from November 2015 to October 2016. The Five Cities $225,000
$175,000 $145,666
area has the greatest average revenue figure at $424,000. This is likely $125,000
$75,000
a reflection of the hotel inventory in this area, which includes the $25,000
greatest number of upscale, upper upscale, and luxury hotels with 11.
High-end hotels in Five Cities constitute over one-third of total hotels in
the area while high-end hotels comprise up to 20% of total hotels in the Source: STR
Atascadero Morro Bay Paso Robles San Luis Obispo Five Cities
other four markets. FIGURE 3.25: Average Revenue per Hotel
RevPAR
$200.00
$180.00 $185.87
The graph to the right shows RevPAR over a 12-month period from $160.00
$140.00
November 2015 to October 2016. The County’s average RevPAR $120.00
$100.00
$80.00
ranges from $59 in January to $160 in July. RevPAR figures by County $60.00
$40.00
area vary significantly with a $45 low in Atascadero (January) and a $20.00
$45.30
$-
$186 high in Five Cities (July).
Morro Bay Paso Robles San Luis Obispo SLO County Average Five Cities Atascadero
FIGURE 3.26: RevPAR Trailing Twelve Months
27 Vi s i t S L O C A L3.0 - LOCAL MARKET CONDITIONS
Lodging Infrastructure
Atascadero Hotel Inventory
Figure 3.27 to the right shows the location of hotels in Atascadero. All seven hotels in Atascadero are
located along U.S. Route 101 and offer just over 500 sleeping rooms, combined. The City’s only hotel
classified as “Upscale” or better is the 130-room Springhill Suites, located near the City’s northern border.
The limited inventory of properties would greatly restrict group sizes for plenary sessions.
Economy
Midscale and Upper
FIGURE 3.27: Atascadero Hotel Inventory Midscale
Upscale and Above
Five Cities Hotel Inventory
Figure 3.28 to the right shows the location of hotels in the Five Cities area. The majority of hotels in the
Five Cities are located on the south coast of Pismo Beach along U.S. Route 101. The Five Cities’ 31
hotels offer over 2,300 sleeping rooms. Pismo’s north coast has less hotel inventory but has three of the
area’s “Upscale” or better hotels: The Cliffs Resort, Dolphin Bay Hotel, and Spyglass Inn.
FIGURE 3.28: Five Cities Hotel Inventory
28 Vi s i t S L O C A L3.0 - LOCAL MARKET CONDITIONS
Lodging Infrastructure
Morro Bay Hotel Inventory
Figure 3.29 to the right shows the location of hotels in Morro Bay. The city has 27 hotels that offer
nearly 900 sleeping rooms, combined. The majority of hotels are located near the intersection of
Morro Bay Blvd and Main St. Morro Bay’s hotel inventory consists of hotels classified as
“Economy,” “Midscale,” and “Upper Midscale.” In contrast to the other areas within the County,
Morro Bay has no hotels classified as “Upscale,” “Upper Upscale,” or “Luxury.”
Economy
FIGURE 3.29: Morro Bay Hotel Inventory Midscale and Upper
Midscale
Paso Robles Hotel Inventory
Upscale and Above
Figure 3.30 to the right shows the location of hotels in Paso Robles. The city has 19 hotels that offer
nearly 1,400 sleeping rooms. All but two hotels are located west of U.S. Route 101 and provide
convenient interstate access. Paso Roble’s hotels classified as “Upscale” or better are located in the
southwest portion of the city borders along U.S. Route 101.
FIGURE 3.30: Paso Robles Hotel Inventory
29 Vi s i t S L O C A L3.0 - LOCAL MARKET CONDITIONS
Lodging Infrastructure
San Luis Obispo Hotel Inventory
Figure 3.31 to the right shows the location of hotels in San Luis Obispo. The city has 30
hotels that offer just over 2,100 sleeping rooms. Hotel inventory in San Luis Obispo is
concentrated along U.S. Route 101 in the downtown area near Cal Poly. The majority of San
Luis Obispo’s hotels are classified as “Economy,” “Midscale,” and “Upper Midscale.” Four
city properties are rated “Upscale” or better and include the Apple Farm Inn, Courtyard San
Economy
Luis Obispo, Embassy Suites, and Sycamore Mineral Springs Resort.
Midscale and Upper
Midscale
FIGURE 3.31: San Luis Obispo Hotel Inventory
Upscale and Above
30 Vi s i t S L O C A L3.0 - LOCAL MARKET CONDITIONS
Meeting Space
Meeting Space Overview
B&D identified 46 properties in the County that offer sellable meeting
space. Figure 3.32 shows the location and if it includes a residential
component, which indicates the presence of on-site lodging. Properties
are largely concentrated in four areas along US Route 101: Paso
Robles, Atascadero, San Luis Obispo, and Five Cities. Space
inventories include exhibit space, ballrooms, meeting rooms, and
outdoor meeting space, all of which will be discussed further on
subsequent pages.
Thirty-four of the 46 properties that offer meeting space are residential
properties. SeaVenture Beach Hotel offers the fewest sleeping rooms at
51 while Embassy Suites offers the most at 195 (excluding Ragged
Point Resort, which is a geographical outlier). Other property types that
Residential
offer meeting space include restaurants, special organizations (SLO
Non-Residential
Veteran’s Memorial Hall), vineyards / wineries, and Cal Poly.
FIGURE 3.32: Meeting Space Overview – Residential and Non-Residential Properties
31 Vi s i t S L O C A L3.0 - LOCAL MARKET CONDITIONS
Meeting Space
Meeting Space Inventory & Space Classification
Space Type Count Total SQ FT
The table to the right provides a breakdown of the meeting spaces within the County. There are four exhibition
Exhibit Halls 4 64,711
spaces, 20 ballrooms, 108 meeting rooms, and nearly 140,000 SQ FT of outdoor rentable space. In B&D’s opinion, Ballrooms 20 71,124
the County’s exhibit space more closely resembles small expo halls than traditional prime exhibit space. Further, Meeting Rooms 108 100,631
Outdoor Space - 136,933
B&D acknowledges the outdoor space inventory is difficult to define due to the number of wineries located within
Indoor Sellable SQ FT - 209,056
the County. Meeting space types are defined below: Total Sellable SQ FT - 345,989
[1] 'Total Indoor Sellable SQ FT' accounts for ov erlap from div idable rooms
• Exhibit Space: Exhibit Halls are large spaces of basic décor. These spaces are generally over 25,000 SQ FT Source: Internet research
and have ceiling heights of 40 feet or greater, polished concrete flooring, minimal columns, and ample utility FIGURE 3.33: County-Wide Meeting Space Inventory
Summary
connectivity. Events include conventions, trade shows, and consumer shows that attract non-local patrons.
• Exposition Space: Exposition space is similar to exhibit space but is typically larger and utilized for a wider range of events, including events such as flea
markets and swap meets that attract primarily local patrons. Events that utilize exposition centers are often stand-alone and do not require break-out spaces.
• Ballrooms: Ballrooms are often the most utilized space in a conference center due to its central importance in attracting events such as banquets and
weddings that create greater ancillary spending ratios. Full-size ballrooms generally range from 10,000 to 20,000 SQ FT in size and can be divided into
several smaller partitions by utilizing movable walls. Ballrooms feature higher-quality finishes, are absent of columns or pillars, and contain carpeted floors and
higher quality finishes. Ballrooms can also be adapted to serve as exhibition space utilized for small trade shows.
• Meeting Rooms: Meeting rooms are utilized for smaller meetings, conferences, and educational sessions. In comparison to a ballroom, meeting spaces are
smaller (800 SQ FT to 2,000 SQ FT) and more intimate. The meeting rooms are typically utilized as break-out spaces during conferences or conventions.
32 Vi s i t S L O C A L3.0 - LOCAL MARKET CONDITIONS
Meeting Space
Meeting Space Inventory Distribution
Figure 3.34 examines County meeting space inventory. Paso Robles has the greatest Largest Space Total Indoor Total Sellable
Area # of Properties
amount of sellable square with 138,000 SQ FT. San Luis Obispo has the second (SQ FT) Sellable SQ FT SQ FT
greatest amount at slightly over 100,000 SQ FT. The other four areas combined offer Atascadero 4,425 5 24,737 27,237
Five Cities 2,977 12 23,015 47,165
just over 105,000 SQ FT, highlighting the high concentration of space in Paso Robles Morro Bay 2,500 1 5,325 10,985
and San Luis Obispo. San Luis Obispo and the Five Cities have the highest number of Paso Robles 18,624 8 68,482 138,145
San Luis Obispo 20,000 16 79,452 102,412
total meeting spaces with 16 and 12, respectively. Although the Five Cities has a
Other 3,360 4 8,045 20,045
significant quantity of meeting spaces, indoor sellable SQ FT is just over 23,000 SQ FT.
Average 8,648 8 34,843 57,665
Total - 46 209,056 345,989
Paso Robles Event Center and the Madonna Inn (San Luis Obispo) are the County’s two Source: Internet research
FIGURE 3.34: Meeting Space Inventory Distribution by Area
largest spaces at 18,600 SQ FT and 20,000 SQ FT, respectively. Further discussion of
the County’s largest meeting spaces can be found on the next page.
33 Vi s i t S L O C A L3.0 - LOCAL MARKET CONDITIONS
Meeting Space
Largest Spaces
SLOC Largest Sellable Spaces
San Luis Obispo
SeaCrest OceanFront Hotel 2,500
Paso Robles
Figure 3.35 to the right shows largest County meeting spaces
Inn at Morro Bay 2,500
Atascadero
in ascending order. The spaces are color coded according to Courtyard by Marriott San Luis Obispo 2,840
Five Cities
their location within the County. The Madonna Inn (San Luis The Cliffs Resort 2,977
Morro Bay
Obispo) and Paso Robles Event Center are the two largest SpringHill Suites Atascadero 3,000
Other
Cambria Pines Lodge 3,360
spaces in the market. Chumash Auditorium offers over 9,228
Paso Robles Inn 3,600
of leasable SQ FT but is seldom available for external rentals.
Allegretto Vineyard Resort 4,000
Embassy suites is the largest ballroom in the County at 5,100 Carlton Hotel 4,212
SQ FT. This is considered a “junior” ballroom by B&D and Pavilion at the Lake 4,425
speaks to the limited amount of ballroom space in the County. Embassy Suites Hotel 5,100
SLO Veteran's Hall 5,708
[1] Cal Poly 9,228
Paso Robles Event Center 18,624
Madonna Inn 20,000
0 5,000 10,000 15,000 20,000
[1] Primarily utilized for student / university events
FIGURE 3.35: San Luis Obispo County Largest Sellable Spaces
Source: Internet research
34 Vi s i t S L O C A L4.0 – DEMAND ANALYSIS
Introduction Methodology
The Demand Analysis builds on the Local Market Conditions Analysis. The analysis Analysis of convention and conference trends contained in this analysis is
provides the primary basis for developing an outline building program. Component based on Internet articles and newsletters published by Meeting Professionals
tasks to the demand analysis are listed below: International (MPI) and the International Association of Conference Centers
(IACC). The purpose of this analysis is to identify macro-level demand trends
• Analysis of Convention and Conference Center Trends as well as key that affect demand for the project. The regional competitive markets were
national and state trends that affect demand for the project; identified based on input from the Client and B&D’s judgment; for each market,
• Examination of Regional Competitive Market characteristics observed at demographic, business climate, hotel, and meeting space inventory were
Bakersfield, Fresno, Monterey, and Santa Barbara; compared and contrasted to evaluate the County’s competitive position.
• Analysis of Comparable Conference Center, including space configurations Comparable conference centers were then utilized as the primary benchmarking
and event characteristics; and tool for program development. The Meeting Planner Survey builds on the three
• Development of a Meeting Planner Survey to assess building program and city previous analyses and brings into focus the appropriate building program, types
preferences for a new conference center as well as general meeting elements of spaces, and preferred area within the County.
(Size, attendance, duration, hotel requirements, etc.).
35 Vi s i t S L O C A L4.0 – DEMAND ANALYSIS
Convention and Conference Center Trends
Economic Indicators
Macroeconomic indicators such as GDP and unemployment are closely correlated with demand for conferences and conventions. National GDP has grown over the past
seven years at an average compound growth rate of nearly 4%. However, GDP is expected to grow at just over 2% in 2017 according to Trading Economics, which is
considerably less than post-recession average growth rates between 2009 and 2016. Figure 4.2 examines U.S. unemployment from 2006 to 2016, which has decreased
steadily from 9.6% in 2010 to 4.9% in 2016. Furthermore, a survey conducted by MPI revealed that 63% of respondents predict “favorable business conditions for the year
ahead,” which is a positive near-term indicator of demand for meeting space.
U.S. GDP (In Billions)
Annual Unemployment Rate
20,000
12.0%
18,037
18,000 9.6%
10.0%
16,000
16,397.2
8.0% 7.4%
14,000
14,418.7
6.0% 5.3%
5.8%
12,000 6.2%
10,000 4.0% 4.9%
8,000 2.0%
6,000 0.0%
2000 2001 2002 2003 2004 2005 2006 2007 2008 2009 2010 2011 2012 2013 2014 2015 2006 2007 2008 2009 2010 2011 2012 2013 2014 2015 2016
GDP in billions of current dollars GDP in billions of chained 2009 dollars Source: U.S. Bureau of Labor Statistics
Source: U.S. Bureau of Economic Analysis
FIGURE 4.2: Annual Unemployment Rate
FIGURE 4.1: U.S. GDP
36 Vi s i t S L O C A L4.0 – DEMAND ANALYSIS
Convention and Conference Center Trends
California & Central Coast Region Travel Spending
California has experienced consistent levels of growth in direct travel total spending from 2004 to 2015. Spending grew at an average of 6% reaching $122.5 billion in
2015. Travel spending for the central coast of California has grown steadily since 2004 at a compound average of 6%, consistent with the state average. Though figures
for 2016 and 2017 have yet to be published the consistent, upward-sloping trend line suggests continued growth.
California Direct Travel Spending (In Billions) Central Coast Direct Travel Spending (In Millions)
$140 $9,000
$8,000
$120
$122.5 $7,000 $7,819 $8,078
$118.4 $7,292
$6,000
$100 $110.6 $6,522 $6,712 $6,540
…
$100.3 $5,000 $5,767
$97.1
$80 $4,000
$85.5
$3,000
$60
$2,000
$1,000
$40
2004 2006 2008 2010 2012 2014 2015 $-
2004 2006 2008 2010 2012 2014 2015
FIGURE 4.3: California Direct Travel Spending FIGURE 4.4: Central Coast Direct Travel Spending
37 Vi s i t S L O C A L4.0 – DEMAND ANALYSIS
Convention and Conference Center Trends
Consumer Needs
What Meeting Venue Elements Will Be Most Important
Looking Toward the Next Five Years?
As participant demographics change and evolve, a different set of convention,
100%
conference, and exhibition elements take on different levels importance to
attendees and planners. Figure 4.5 to the right lists the elements that are growing
in importance to meeting planners. The Meeting Professionals International (“MPI”) 80%
reveals a 33% projected growth from 2012 to 2022 in the meeting, convention and
event planner profession. This profession’s growth is 22 percentage points higher 60%
than the average growth rate of other occupations, suggesting that planners
expectations will continue to evolve significantly.
40%
Preferences
20%
The most important meeting venue element over the next five years is access to
interactive technology (78%), followed by flexible meeting space (47%), and
networking spaces (37%). Comparatively less important factors include multiple 0%
Access to Flexibility of Networking Multiple Options Access to Availability of
options for food and beverage, access to local area experiences, and availability of Interactive Meeting Space Spaces Adjacent for Food and Authentic Local Team Building
Technology to the Meeting / Beverage Area Activities
team-building activities. Event Space Service Styles Experiences
and Spaces
Source: IACC Annual Report 2016. Recreated by B&D
FIGURE 4.5: Important Meeting Elements Over the Next Five Years
38 Vi s i t S L O C A L4.0 – DEMAND ANALYSIS
Convention and Conference Center Trends
Experience Creation
Degree to Which Respondents Agree with the Following
Statements (on a scale of 1 (strongly disagree) to 10
Seventy-five percent of meeting planners report a growing importance of “experience (Strongly agree
creation” in their professional role. The term “experience creation” involves
Availability of high quality broadband is critical in
collaboration and the exchange of ideas in an engaging manner in contrast to the meeting venues
conventional speaker-audience relationship. As such, incorporation of technology and
Meeting room acoustics impact the overall quality of
collaboration is growing in importance over one-way presentations. the meeting / conference
Meeting room lighting impacts the overall quality of the
Figure 4.6 to the right highlights several important elements to meeting planners meeting / conference
regarding what culminates in creating a positive experience. Quality broadband internet
It is important to have collaborative spaces outside of
is the highest concern among meeting planners. The lowest concern is the availability the meeting room for informal gatherings at my meeting
of outdoor space. Although depicted as the lowest concern in Figure 4.6, a ranking of
It is important to have the flexibility to change layouts
above 5.0 still reflects agreement with the statement. in meeting rooms
I am looking for different meeting space elements today
than I was two to five years ago
It is important to have outdoor meeting facilities when
choosing a meeting venue
0.0 1.0 2.0 3.0 4.0 5.0 6.0 7.0 8.0 9.0 10.0
Source: IACC Annual Report 2016. Recreated by B&D
FIGURE 4.6: Experience Creation Elements
39 Vi s i t S L O C A LYou can also read