Visually Exploring Books along their Subject Headings
←
→
Page content transcription
If your browser does not render page correctly, please read the page content below
Visually Exploring Books along their Subject Headings

Cody Coljee-Gray1, Marian Dörk2 and Sheelagh Carpendale1
1
    University of Calgary
2
    University of Applied Sciences Potsdam

    Abstract
    We present a visualization of subject headings that typically accompany books as flat textual metadata.
    The purpose of the visualization is twofold: first to expose the implicit structure in subject headings as
    an overview of a library collection and second to present a visual web of keywords to invite exploration
    of books. Taking a tag cloud as a starting point, the visualization extends it to a networked tag cloud
    that respects the hierarchy that is implicit in subject headings. By allowing an information seeker to
    successively build a subject filter, while seeing the results at each step, we hope to improve the searcher’s
    orientation in a comprehensive book collection
    Keywords: information visualization, tag clouds, information seeking, subject headings, library search
    Citation: Coljee-Gray, C., Dörk, M., & Carpendale, S. (2014). Visually Exploring Books along their Subject Headings. In
    iConference 2014 Proceedings (p. 729–734). doi:10.9776/14347
    Copyright: Copyright is held by the authors.
    Acknowledgements: We would like to thank Tim Au Young for his feedback and the members of iLab who took part in the
    sketching workshop. Funding was provided by SMART Technologies, NSERC, and AITF.
    Contact: cody.cg@gmail.com, doerk@fh-potsdam.de, sheelagh@ucalgary.ca

1       Introduction
With many libraries digitizing their collections it is becoming a challenge to explore these information
spaces. In a traditional brick-and-mortar library one may walk past many displays and magazine racks
encountering many aspects of the book collection. The development towards digital library collections and
high-density storage makes it more difficult to get that sense of a collection. However, many libraries have
already put considerable effort into categorizing their collections with textual subject headings. These
subject headings are typically ordered as lists of topics, which identify what subject matters are discussed
in the book. For example, a subject string such as “Spain – History – 20th century” contains three topics.
Topics that appear first are more general, while topics that appear later are more specific for a given book.
A cataloguer would attach one or more subject headings to each book each having three to four topics.
          Traditionally a library visitor would use a physical card catalog to search through subject headings
in order to find a book on a given topic. Today, subject headings are used in keyword search as part of
digital library interfaces. Either way this requires a searcher to have a relatively specific goal. The searcher
cannot easily browse the collection by subject headings or get a sense how many books are about the
respective topics. In a digital library, a reader enters a search query comprising one or several keywords
leading to a list of search results. These results will be related to the search terms and rarely contain an
unrelated book, which is great when the searcher’s goal is specific. However, when the searcher has a more
general interest, they typically only see subsets of the collection. There is no sense of the entire collection.
In a physical library books are shelved according to a given system such as Dewey Decimals or simply by
the author’s last name. Books related to a given topic may not be placed next to each other. In a digital
library books are often presented in decreasing order of relevance to a search term. This is very different to
the physical library where books cannot be reordered based on each visitors preference.
          We aim to bring a sense of the whole back while supporting the successive filtering and refinement
of a collection. Towards that goal we present a visualization tool that uses textual subject headings in a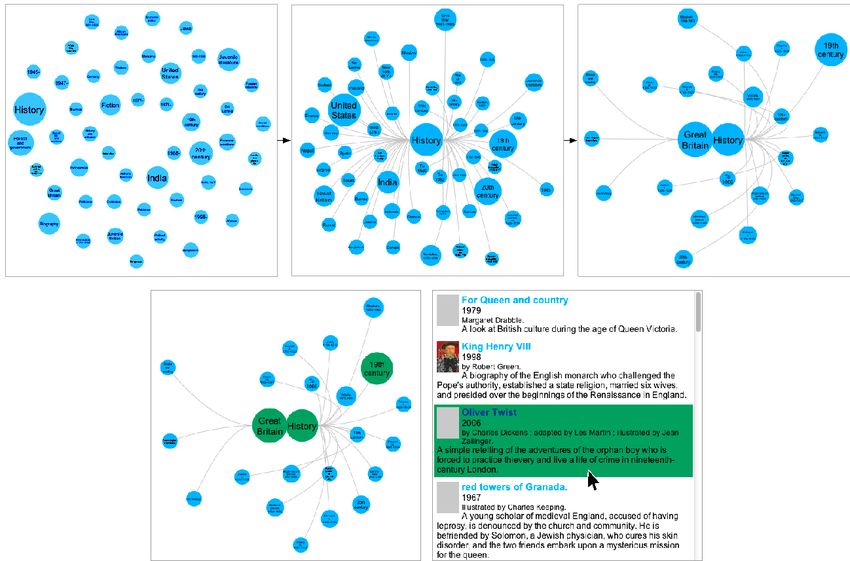
iConference 2014                                                                   Cody Coljee-Gray et al.

collection of books to aid exploration. Subject headings offer a rich under-utilized data source that can help
provide a sense of context to a library collection in a digital interface.

2       Background
The initial aims behind this work were to expose interesting aspects of a library catalog, facilitate the casual
filtering of books, and help the searcher to gain a better understanding of the collection. We have refined
these goals in collaboration with a library professional whose work relates to the management of catalogs
at our university library. In conversations with him we learned about the various fields of the typical
database schema for library collections. Especially subject headings such as Library of Congress Subject
Headings (LCSH) repeatedly popped up. On the one hand, subject headings are a form of metadata that
are very useful in characterizing books, on the other hand they have not been fully utilized in catalog
interfaces. We subsequently ran a sketching session with six researchers from our lab who were asked to
sketch visual representations of 15 books and their subject headings to facilitate information exploration.
Several sketches focused on the directionality of tags in subject headings, which our library expert responded
positively about. While he acknowledged the variation among cataloguers, he viewed subject headings as a
fruitful middle ground between highly structured classifications such as the Dewey Decimal System and less
structured approaches like free-form tagging. Based on our initial goals and the subsequent discussions and
explorations, we developed a visualization technique that exposes the ordered relationships among tags in
subject headings.
          Many visualizations systems have been developed that represent the tags or words in a collection
or document. For unstructured text, several visualization techniques have been introduced that allow for
the exploration of relationships among terms in textual documents and tags in collections. Word tree
(Wattenberg & Viegas, 2008) presents a visual concordance that exposes the varying distributions of word-
to-word sequences in a single text. Based on a selected word acting as the tree’s root, any words that follow
the selected word are branched off of it. Words which appear further away are connected to its respective
predecessor. Phrase nets is a related technique that represents the latent network structure in a text where
the words are connected by specific words, phrases, or patterns (van Ham, Wattenberg, & Viegas, 2009)
providing a network approach to an unstructured text. Both techniques present uniques perspectives on a
single text, but are not designed to facilitate search across a collection of resources.
          Tag clouds (Viégas & Wattenberg, 2008) are the most widely deployed text visualizations providing
an overview of the frequency of words or terms either of a text or of a collection of photos or bookmarks.
Tag clouds use font size to indicate the frequencies of terms in a data set. While it may not be ideal for a
precise reading, a tag cloud provides a general sense of which terms are dominant in a given text or
collection. However, tag clouds are not designed to work with sets of ordered tags such as subject headings
and typically do not display connections between such tags. The tag cloud are also used in the VisGets
(Dörk, Carpendale, Collins, & Williamson, 2008) interface supporting besides filtering a brushing mechanism
that shows the correspondence between other facet values as well as the results.

3       Spidey Sense
For the purpose of designing a visualization of a book collection we used a subset of books from the Open
Library 1, an online project to create a universal book catalog. Besides typical metadata such as author,
title, year, and blurb, the site also exposes LCSH terms as ordered tags. We focus here on the interplay
between the visualization of the subject headings and the display of the books as the result space.
         The Spidey Sense interface has two main parts: a subject visualization on the left and a result view
on the right (see Figure 1). The results contain the books retrieved from the query that is formulated in

1
    http://openlibrary.org

                                                      730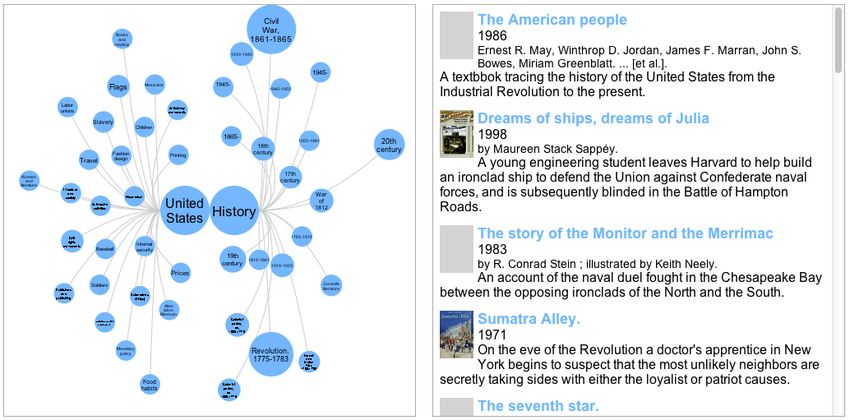
iConference 2014 Cody Coljee-Gray et al.
the visualization view by selecting tags. With no tag selected, the visualization view shows the top 50 tags
from all subject headings across all books in the collection. At this initial stage the visualization is similar
to a tag cloud: each tag represents a topic from a subject heading from a book. We decided to encode the
frequency of tags using a circle instead of font size alone to make it easier to compare the differences in
frequency.
Once a tag is selected the visualization is separated into three parts: left, middle and right (see Figure 1).
Constituting the current query, the selected tags are placed into the middle of the visualization. The left
side of the view has many tags varying in size scattered from the top to the bottom. These are tags that
immediately precede the current selection in the subject headings across all the books that match the current
tag selection. The right side is structured similarly but shows tags that immediately follow the current
selection. The tags are connected with subtle curves indicating the ordering of subject tags.
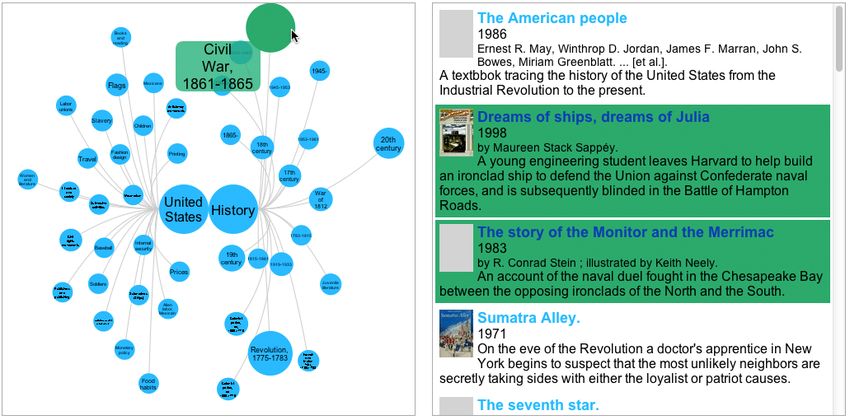
Figure 1: The visualization view on the left is juxtaposed with the results view on the right.
A tag’s label and association with the books in the result list can be explored by hovering. When the cursor
is moved over a circle the tag label is enlarged and moved out of the circle so that it can be read in full (see
Figure 2). The hover operation also highlights the books in the result view that have a subject heading
containing that tag. Likewise hovering over an entry in the result list highlights the corresponding tags in
the visualization. Brushing allows an information seeker to draw connections between tags and books. Its
aim is to strengthen the relationship between the visualization and the results to help the searcher gain a
sense of orientation in the larger collection.
731iConference 2014 Cody Coljee-Gray et al.
Figure 2: Brushing over a tag in the visualization highlights relevant books in the results view.
When a tag is clicked the visualization transitions to the filtered stage. The selected tag will move to the
center. All tags that have a first-order relationship to the chosen tag remain visible and are linked to the
chosen tag. Tags that appear immediately before the selected tag will move to the left and tags that appear
immediately after will be moved to the right. All tags are visually connected by curved lines to the center
tag or tags either to the left or right of it depending on their position in the subject headings. Considering
that the tags at the beginning of a subject heading represents more general topics, the left side of the
visualization contains more general tags. Similarly the tags on the right side in the visualization should be
more specific. Clicking on a tag on either side (left or right) will add that tag to the selected nodes in the
middle which results in a refinement of the result space. On the flip side, clicking on a tag in the middle
will remove that tag from the selection, which broadens the query and expands the result space. If the last
remaining middle tag is clicked, the system returns back to the initial stage.
The intention behind the design is to help making sense of the changing arrangement of tags as the
searcher navigates between sets of books. The tags are gradually transitioned between display states to help
the viewer make sense of the changes on the screen. After a query change is issued, tags which exist in both
the before state and the after state are not removed but rather moved to their new location. This is done
to try to keep a sense of fluidity.
The prototype queries a set of 1000 books from the Open Library database. Open Library is open
for anyone to add bibliographic information about books. The project is implemented as a web-based system,
written in JavaScript. Processing.js 2 is used to draw to the canvas element of HTML5 and the JavaScript
library springy.js 3 is used to control the force directed layout. When the web page is loaded it retrieves a
JSON file containing the metadata about the books. It immediately parses it and stores it in memory. Each
query is then made on this data store.
2
http://processingjs.org/
3
https://github.com/dhotson/springy
732iConference 2014 Cody Coljee-Gray et al.
Figure 3: Example use case showing the initial state (top left), one selected tag (top middle), two selected
tags (top right) and the brushing when hovered over a book (bottom)
4 Use-Case Scenario
To demonstrate the potential of this project we provide a brief scenario. Suppose there is a searcher, named
John, who is interested in finding a new book to read. He uses the Spidey Sense interface to find a book. In
the initial view, he notices that “History” is fairly large compared to the other tags (see Figure 3, top left).
This indicates there is a large amount of items in this collection about “History.”. Being generally interested
in history, John clicks on the tag and the system updates the other tags. With “History” selected in the
center he can see that the largest circles have the tags “United States”, “19th century” and “20th century”
(top middle). This indicates these tags are the most common tags occurring in subject headings directly
before or after a “History” tag. John clicks the tag marked “Great Britain.” Now the visualization indicates
that most of the books in this subset are about the “19th century” because that tag is the largest (top
right). After seeing Oliver Twist among the results (bottom right), John moves his mouse over the book
and some tags in the visualization change color (bottom left). He can see that Oliver Twist has at least one
subject heading containing the substring “Great Britain – History – 19th century.” John selects “19th
century” and hovers over Oliver Twist again. Now the “Fiction” tag highlights. John decides he wants to
read Oliver Twist. He selects the result and puts a hold on the book in his local library.
Alternatively John could have started with “Fiction”, then “19th century”, next “History” and
finally “Great Britain.” He would be essentially navigating through the hierarchy from the bottom up. This
also works if you start with “Great Britain” or “19th century.” John can form the same query by multiply
paths.
This is contrary to the typical top down category structure often employed.
733iConference 2014 Cody Coljee-Gray et al.
5 Conclusions
The Spidey Sense interface takes tag clouds as a visualization many people are familiar with as a starting
point and introduces hierarchy to aid a more structured exploration of books. While the visualization allows
an information seeker to use subject headings to explore books, it does not impose a certain order of
navigating the collection. As digital libraries become more prevalent it is possible to explore new types of
visual interfaces for navigating their contents. Considering that a lot of effort is invested in the creation
and maintenance of a catalog, there is an opportunity to expose the rich relationships that collections
contain. The visualization of the Spidey Sense interface adds a sense of order to an otherwise orderless tag
cloud. By presenting this order to the searcher they can gain a different perspective on a library data set.
There are many ways this project can be taken further. First, it would be interesting to deploy the
interface with an actual library catalog to investigate how searchers would make use of it. Second, it would
be promising to investigate how such a subject visualization can be integrated with the search mechanisms
of existing catalog interfaces. Third, we are interested in application areas beyond the library where the
order of tags, for example, in the hierarchy of a shopping website, could be respected in order to provide a
more exploratory experience. Often these hierarchies are loosely defined. For example if one is searching for
paper this might be in the stationary department if the intent was writing paper or in the household
department if the intent was a paper towel. Spidey Sense provides an elegant way of exposing this
ambiguity.
6 References
Dörk, M., Carpendale, S., Collins, C., & Williamson, C. (2008, Nov./Dec.). Visgets: Coordinated
visualizations for web-based information exploration and discovery. IEEE Transactions on
Visualization and Computer Graphics, 14(6), 1205-1212.
van Ham, F., Wattenberg, M., & Viegas, F. (2009, nov.-dec.). Mapping text with phrase nets.
Visualization and Computer Graphics, IEEE Transactions on, 15(6), 1169 -1176. doi:
10.1109/TVCG.2009.165
Viégas, F. B., & Wattenberg, M. (2008, July). Timelines: Tag clouds and the case for vernacular
visualization. interactions, 15, 49–52. Retrieved from
http://doi.acm.org/10.1145/1374489.1374501 doi: http://doi.acm.org/10.1145/1374489.1374501
Wattenberg, M., & Viegas, F. (2008, nov.-dec.). The word tree, an interactive visual concordance.
Visualization and Computer Graphics, IEEE Transactions on, 14(6), 1221 -1228. doi:
10.1109/TVCG.2008.172
7 Table of Figures
Figure 1: The visualization view on the left is juxtaposed with the results view on the right. .................731
Figure 2: Brushing over a tag in the visualization highlights relevant books in the results view. .............732
Figure 3: Example use case showing the initial state (top left), one selected tag (top middle), two selected
tags (top right) and the brushing when hovered over a book (bottom) ....................................................733
734You can also read