Vodafone Group Plc Q1 FY23 Trading Update - 25 July 2022
←
→
Page content transcription
If your browser does not render page correctly, please read the page content below

Vodafone Group Plc
Q1 FY23 Trading Update
25 July 2022

Our strategy ⫶ Growth in Europe & Africa to drive returns
                                                                                 We connect for a better future
Our Purpose                Inclusion for All                                                        Planet                                     Digital Society
                 Enabling the digital society to be accessible                        Ensuring our commercial success does              Connecting people, places & things
                        by all, with no one left behind                               not come at a cost to the environment           through gigabit fixed & mobile networks

                                                        The new generation connectivity & digital services provider
Our Vision
                                                     for Europe & Africa, enabling an inclusive & sustainable digital society

                Deep &                                           Best connectivity                                     Leading          24hr               Outstanding
                trusted
                customer
                                                                    products &                                      innovation in                            digital
                relationships                                        services                                      digital services                        experiences

Our Strategy

                Enabled                                           Simplified &                                     Social Contract
                through                                           most efficient
                                                                                                                                                        Leading gigabit
                                                                                                                    shaping the
                Group scale
                                                                    operator                                       digital society                        networks
                & expertise

The Spirit of       Earn customer                                        Create the                                   Experiment &                        Get it done,
Vodafone               loyalty                                             future                                       learn fast                         together

                                                                           Q1 FY23 Trading Update
                                                                                25 July 2022                                                                                    2
Highlights ⫶ Continued service revenue growth, in line with expectations
                           Group Service Revenue YoY growth
          Group          Group excl. Turkey                                                                        • Good service revenue growth maintained
                           3.3%
                                                              2.7%
                                              2.4%
                                                                            2.0%
                                                                                       2.5%
                                                                                                                   • Germany service revenue decline of 0.5% largely
         0.8%
                           2.7%
                                                                                                                           reflecting the impact of the implementation of
                                                              2.0%
                                              1.7%
                                                                            1.4%       1.6%                                the new Telecoms Act, offset by acceleration in
                  0.2%
           Q4                Q1                Q2              Q3            Q4             Q1                             the UK
          FY21              FY22              FY22            FY22          FY22           FY23

                            Growing in both Europe and Africa
                                                                                                                   • Growth in Turkey increased by 10pp to 35.8% in
Europe                                                Africa1
                                                                                                                           Q1, impacting Group service revenue growth by
1 .4
   %
                                                      9 .0
                                                         %

                                                             7.9%                                                          an additional 0.3pp
1 .2
   %   1.1%                                           8 .0
                                                         %

                                                      7 .0
                                                         %

                                                                                                                   • On track to deliver FY23 guidance with Adjusted
1 .0
   %

                                                      6 .0
                                                         %

0 .8
   %
                                                      5 .0
                                                         %
                                                                            4.4%
                         0.5%                 0.5%                   3.1%           3.1%      2.9%
                                                                                                                           EBITDAaL expected to be between €15.0 – €15.5
                                                      4 .0
                                                         %
0 .6
   %

0 .4
   %
                  0.3%              0.3%              3 .0
                                                         %

                                                                                                                           billion and Adjusted FCF of c.€5.3 billion
                                                      2 .0
                                                         %

0 .2
   %

                                                      1 .0
                                                         %

0 .0
   %                                                  0 .0
                                                         %

        Q1         Q2      Q3         Q4        Q1            Q1      Q2      Q3     Q4        Q1
       FY22       FY22    FY22       FY22      FY23          FY22    FY22    FY22   FY22      FY23

                                                                                                  Q1 FY23 Trading Update
                                                                                                       25 July 2022
                                                                                                                               1Growth for Vodacom Group
                                                                                                                                                                             3
Q1 Performance ⫶ Europe commercial actions supporting growth
                              Europe service revenue growth                                          Contractual price increase
       UK                Europe                                     6.5%                            • Growth acceleration in the UK driven by contractual price
                                                                                                      increases
                           2.5%
                                               0.6%   0.9%
                                                             2.0%                                   • Focus on price actions across all markets
       -0.6%
                           1.1%
                                               0.3%   0.5%   0.3%   0.5%                             Price plan simplification
       -1.1%
         Q4                  Q1                 Q2     Q3     Q4     Q1
                                                                                                    • Migrations from legacy tariffs to more transparent plans in Italy
        FY21                FY22               FY22   FY22   FY22   FY23
                                                                                                    • Tariff portfolio simplification in Spain to improve customer
                                                                                                       loyalty

                              Europe net customer additions                                          Continued cross- and upselling
4 0
       Mobile contract             Broadband
                                               289
                                                      333                                           • Unlimited mobile plans driving ARPU uplift
3 0                                                                 215                             • Upselling through AI-based customer lifecycle management
       100                 127
2 0

                                               68     52                                               tools
1 0
                                                              8
   0

-1 0

         -5                 15                                                                       Customer journey
                                                             -61    -72
                                                                                                    • Remedial actions in Germany progressing in line with plans
-2 0

         Q4                  Q1                 Q2     Q3     Q4     Q1
        FY21                FY22               FY22   FY22   FY22   FY23
                                                                                                    • 75% of contacts resolved by TOBi, our AI-based customer
                                                                                                       agent

                                                                           Q1 FY23 Trading Update
                                                                                25 July 2022                                                                              4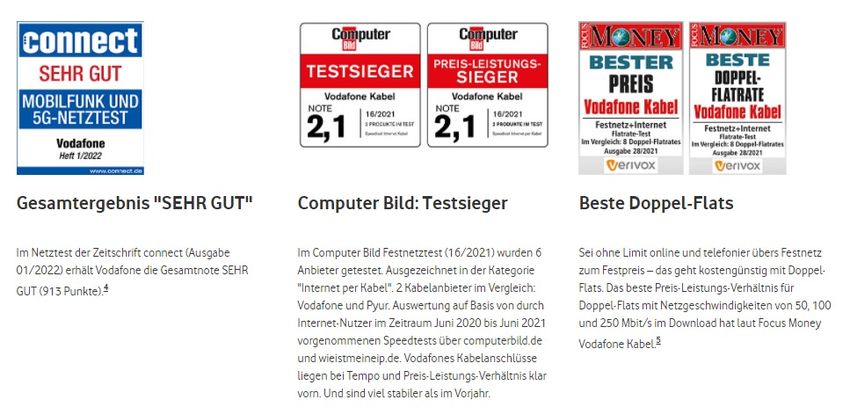
Germany ⫶ Commercial momentum gradually recovering
                                        Service revenue
                                                                                                                     Market and our performance
                                            growth

                                                                       • Service revenue decline following customer losses related to the impact of new Telecommunications Act
                30%
                Group Service Revenue       -0.5%                      • Broadband customer losses improved and mobile stabilised in Q1, benefiting from
         Germany                         (Q4 FY22 +0.8%)
                                                                               – stabilising IT systems and processes
                                                                               – improving customer journeys
                                                                               – gradual unwind of churn related to sector legislation

        Service revenue growth (%)                                Reta il       Organic                      Net additions (‘000)          DSL net adds   Cable net adds   Mobile contra ct net adds
                                                                                                                                    81
3 .0
   %

                                                                                                                                                    70
             1.9%
2 .5
   %
                                                                                                       9 0

                                         1.7%
                                1.5%
2 .0
   %

                                                           1.2%                                        4 0
                                                                                                                                                                                       6
1 .5
   %

                                                                                                                   33               53
                                                                                                                                                    19
             1.4%
1 .0
   %

                                                                                                                                                                    -40               -30
                                                                                                      -1 0

                                1.0%     1.1%                                                                                       -21            -22
                                                                              -0.1%
0 .5
   %

                                                           0.8%                                                                                                                       -34
0 .0
   %
                                                                                                      -6 0
                                                                                                                   -26                                              -85
-0 .5
    %

                                                                                                     -1 1
                                                                                                        0
                                                                                                                   -27
                                                                              -0.5%
-1 .0
    %

-1 .5
    %                                                                                                -1 6
                                                                                                        0
                                                                                                                                                                    -105
              Q1                 Q2       Q3                Q4                 Q1                                  Q1                Q2            Q3                Q4               Q1
             FY22               FY22     FY22              FY22               FY23                                FY22              FY22          FY22              FY22             FY23

                                                                                      Q1 FY23 Trading Update
                                                                                           25 July 2022                                                                                                5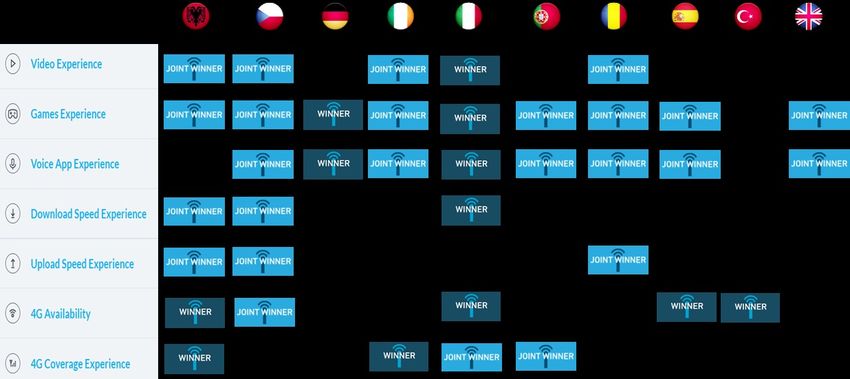
Europe ⫶ Similar trends QoQ, growth acceleration in the UK
Service revenue
Market and our performance Highlights
growth
Organic service revenue growth (%)
• Double digit growth in Consumer driven by our contractual 6.5%
13% price increases and customer base growth
Group Service Revenue +6.5% 2.5% 0.9%
2.0%
(Q4 FY22 +2.0%) • Retail price points moved up for new customers 0.6%
UK
• Improved revenue trends in Business Q1
FY22
Q2
FY22
Q3
FY22
Q4
FY22
Q1
FY23
Business digital services growth1 (%)
• Strong demand in Business for digital services 28% 32% 32% 31%
11%
Group Service Revenue -2.3% • ARPU accretive mobile tariff simplification ongoing
18%
Italy (Q4 FY22 -0.8%)
• Broadband market promotional again Q1 Q2 Q3 Q4 Q1
FY22 FY22 FY22 FY22 FY23
Mobile contract net adds (k)
• Increase in net customer additions supported by improved 27 40 38
10% customer loyalty
Group Service Revenue -3.0% -14
Spain (Q4 FY22 -5.1%) • Launched new simplified tariff plans -53
• Over 8,000 registrations to our ERF digital toolkit platform Q1
FY22
Q2
FY22
Q3
FY22
Q4
FY22
Q1
FY23
Contract net adds2 (k)
13% • Growth in Portugal, Ireland, Greece, Czech, and Hungary 222 212
Group Service Revenue +2.5% • Investment-linked pricing model activated in Ireland and
126 159 145
Other Europe (Q4 FY22 +2.7%)
embedded in contracts in 3 other markets
Q1 Q2 Q3 Q4 Q1
FY22 FY22 FY22 FY22 FY23
Q1 FY23 Trading Update
25 July 2022
1Business digital services revenue growth = IoT and Cloud & Security services
2
Mobile contract and broadband
6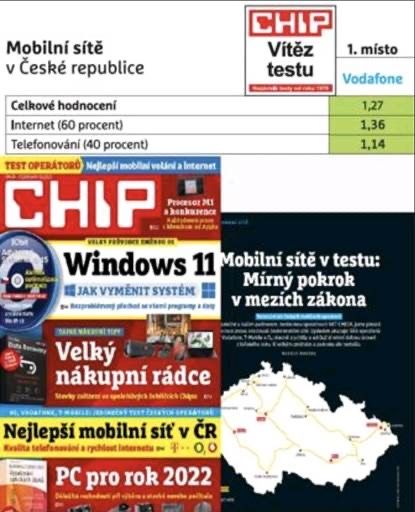
Africa and Turkey ⫶ Growth in Vodacom, good demand in other markets
                                Service revenue
                                                                 Market and our performance                                                                   Highlights
                                    growth
                                                                                                                                            Consumer contract revenue growth (%)
                                                   • Growth supported by Consumer contract price increases                                                                 5.3%      6.0%
        9%
        Group Service Revenue      +3.0%           • Strong demand for insurance financial services                                           2.2%         2.7%    2.9%

Vodacom ⫶ South Africa            (Q4 FY22 3.2%)
                                                   • VodaPay ‘super-app’ reached 1.9 million registered users                                   Q1          Q2       Q3      Q4       Q1
                                                                                                                                               FY22        FY22     FY22    FY22     FY23

                                                                                                                                                            M-Pesa users1 (m)
                                                                                                                                                                   48.3              49.7
                                                                                                                                               47.6
        3%                                         • In Tanzania, mobile money levies reduced from July 2022
        Group Service Revenue      +2.5%                                                                                                                   46.3             45.5

 Vodacom ⫶ Internationals         (Q4 FY22 2.0%)   • M-Pesa revenue share of service revenue increased to 23.8%
                                                                                                                                                Q1          Q2      Q3       Q4       Q1
                                                                                                                                               FY22        FY22    FY22     FY22     FY23

                                                                                                                                               Organic service revenue growth (%)
        5%                                         • Good customer base growth and increased data usage                                                    19.2%
                                                                                                                                                                   18.5%
                                                                                                                                                                                     19.2%
        Group Service Revenue     +19.2%           • Vodacom acquisition regulatory approval expected in the
                                                                                                                                              17.6%
                                                                                                                                                                           16.7%

 Vodafone ⫶ Egypt                (Q4 FY22 16.7%)
                                                     near term
                                                                                                                                                Q1          Q2       Q3      Q4       Q1
                                                                                                                                               FY22        FY22     FY22    FY22     FY23

                                                                                                                                                         Mobile contract churn (%)
                                                                                                                                                           16.1%   16.2%
        4%                                                                                                                                    15.2%                        14.2%
        Group Service Revenue     +35.8%           • Continued pricing actions to offset accelerating inflation
                                                                                                                                                                                     12.6%

 Vodafone ⫶ Turkey               (Q4 FY22 25.8%)
                                                                                                                                                Q1          Q2       Q3      Q4       Q1
                                                                                                                                               FY22        FY22     FY22    FY22     FY23

                                                                  Q1 FY23 Trading Update
                                                                       25 July 2022
                                                                                           1Africa excluding Egypt, including Ghana and 100% Safaricom
                                                                                                                                                                                             7
Appendices
                                                               I     More information               p9
                                                               II    Our regional footprint         p10
                                                               III   Network quality achievements   p11
Provide investor feedback here ⫶                               VI    Definitions                    p12
quantifire.co.uk/vodafone-68743521/
                                                               V     Supporting information         p13
                                                               VI    Important notice               p14

                                      Q1 FY23 Trading Update
                                           25 July 2022                                                   8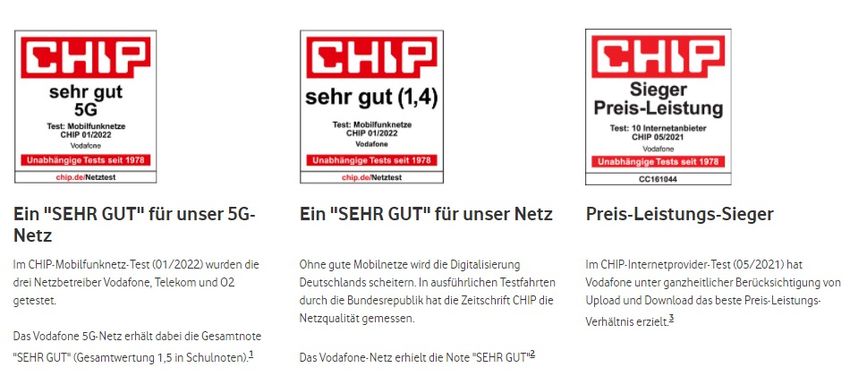
Appendix I ⫶ More information
• 5-part video presentation
Vodafone Business ⫶ Investor briefing • 8 video case studies
investors.vodafone.com/vbbriefing
• 64-page documents
• Analyst Q&A video replay
• 5-part video presentation
Technology ⫶ Investor briefing • 5 video case studies
investors.vodafone.com/vtbriefing
• 67-page documents
• Analyst Q&A video replay
Leading digital services & outstanding experiences
Digital services & experiences
Investor briefing
September 2021
Welcome & introduction p3
• 5-part video presentation
11 Deep & trusted customer relationships Alex Froment-Curtil p8
Digital services ⫶ Investor briefing • 13 video case studies
Chief Commercial Officer
22 Leading digital consumer services p24
investors.vodafone.com/digital-services 3 Shameel Joosub
• 77-page document
The leading FinTech in Africa Vodacom CEO p39
4 The global IoT connectivity leader Vinod Kumar & Erik Brenneis
Vodafone Business Team p56
Appendices p72
Case study videos ⫶ investors.vodafone.com/digital-services
Digital services & experiences investor briefing
September 2021 2
• Analyst Q&A video replay
• 7-part video presentation
Vantage Towers ⫶ Capital Markets Day
investors.vodafone.com/ • 6 video case studies
VantageTowersCMD • 10-part document
• Analyst Q&A video replay
Q1 FY23 Trading Update
25 July 2022 9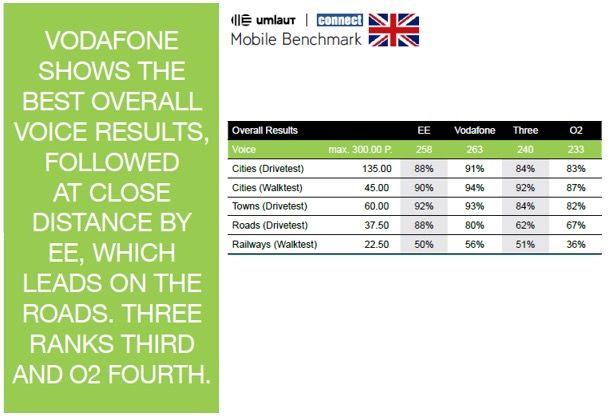
2 ⫶ We are the
  Appendix    II ⫶ Our
                   leading
                       regional
                           connectivity
                                footprintprovider in Europe & Africa.
                Europe ⫶ converged connectivity leader                                                    Africa ⫶ leading data & payments provider

                                                                                                                                        43.8m

                            5.4m
                            3.3m
            17.2m
 2.1m                                     31.3m
               1.1m                                                                                               7.3m
 0.3m                                    10.8m      4.0m
                                                    0.6m
                                                                                                                                                 42.4m*

                                                                                                                                16.0m
                                                  3.0m         9.6m
                                                  0.7m         0.7m                                                                              15.6m
                                         17.9m
                                          3.0m       1.6m
                                                     0.1m
        13.5m
4.7m                                                                                                                                        9.2m
        3.0m
0.9m                                                                  24.5m

                                                            4.3m      1.3m

                                                            1.0m                                                                          1.9m
                                                                                                                             49.4m
                      #m   # mobile connections
                                                                                                 #m   # mobile connections
                      #m   # fixed connections

                                                                             Q1 FY23 Trading Update
                                                                                  25 July 2022
                                                                                                                                                    * Safaricom
                                                                                                                                                                  10
2 ⫶ We are the
Appendix III ⫶leading
Networkconnectivity
quality achievements
provider in Europe & Africa.
Awards Publications
4G Mobile
Experience
Mobile networks
5G Mobile
Experience
Video Upload Speed
Experience Experience
Fixed networks
Q1 FY23 Trading Update
25 July 2022 11Appendix IV ⫶ Definitions
Term Definition Term Definition
Adds Number of new customers within a defined period FWA Fixed Wireless Access
AI Artificial intelligence / machine learning Organic An alternative performance measure which presents performance on
growth a comparable basis, in terms of M&A activity, movements in foreign
exchange rates
ARPU Average revenue per user, defined as customer revenue
and incoming revenue divided by average customers
OSRG Organic service revenue growth
Churn Total gross customer disconnections in the period divided by the
average total customers in the period
Service Service revenue comprises all revenue related to the provision of
Converged A customer who receives both fixed and mobile services (also revenue ongoing services including, but not limited to, monthly access
known as unified communications) on a single bill or who receives charges, airtime usage, roaming, incoming and outgoing network
a discount across both bills usage by non-Vodafone customers and interconnect charges for
incoming calls
DSL Digital subscriber line
Super-app Mobile or web application that can provide multiple services including
payment and financial transaction processing
ERF European Recovery Fund
Q1 FY23 Trading Update
25 July 2022 12Appendix V ⫶ Supporting information
1. Quarterly revenue The information opposite is available in spreadsheet format
2. Group financial performance
via investors.vodafone.com
3. Segmental Results
4. Segmental analysis
5. New segmental reporting
6. Cash flow
7. Mobile customers
8. Fixed broadband customers
9. Marketable homes passed
10. TV customers
11. Converged customers
12. Mobile churn
13. Mobile data usage
14. Mobile ARPU
15. FX rates
Q1 FY23 Trading Update
25 July 2022 13Appendix VI ⫶ Important notice
You have been provided access to this presentation on the basis that you are an investment This presentation, along with any oral statements made in connection therewith, contains
professional for the purposes of Article 19 or a member of the press for the purposes of Article “forward- looking statements” including within the meaning of the US Private Securities
47 of the Financial Services and Markets Act 2000 (Financial Promotion) Order 2005. No other Litigation Reform Act of 1995 with respect to the Vodafone Group’s financial condition, results
person should act or rely on the information presented and you agree to be bound by the of operations and businesses, including the Vodafone Group’s FY23 EBITDAaL and Adjusted
following conditions. You may not disseminate these slides or any recording of this FCF guidance and certain of the Vodafone Group’s plans and objectives.
conference, in whole or in part, without the prior consent of Vodafone. Forward-looking statements are sometimes, but not always, identified by their use of a date in
This presentation contains forward-looking statements, including within the meaning of the the future or such words as “plans”, “targets”, “gain”, or “accelerate” (including in their
US Private Securities Litigation Reform Act of 1995, which are subject to risks and negative form). By their nature, forward-looking statements are inherently predictive,
uncertainties because they relate to future events. These forward-looking statements include, speculative and involve risk and uncertainty because they relate to events and depend on
without limitation, statements in relation to Vodafone Group’s financial outlook and future circumstances that may or may not occur in the future. There are a number of factors that
performance. See the final slide of this presentation for further information. could cause actual results and developments to differ materially from those expressed or
This presentation also contains non-GAAP financial information which the Vodafone Group’s implied by these forward-looking statements.
management believes is valuable in understanding the performance of the Vodafone Group. A review of the reasons why actual results and developments may differ materially from the
However, non-GAAP financial information is not uniformly defined by all companies and expectations disclosed or implied within forward-looking statements can be found under
therefore it may not be comparable with similarly titled measures disclosed by other “Forward looking statements and other matters” and “Risk Management” in the Vodafone
companies, including those in the Vodafone Group’s industry. Although these measures are Group Plc Annual Report for the year ended 31 March 2022 and under “Forward looking
important in the assessment and management of the Vodafone Group’s business, they should statements and other matters” in the Vodafone Group Plc Q1 Results for the three months
not be viewed in isolation or as replacements for, but rather as complementary to, the ended 30 June 2022. These reports can be found at investors.vodafone.com.
comparable GAAP measures. All subsequent written or oral forward-looking statements attributable to Vodafone, to any
Information in this presentation relating to the price at which relevant investments have been member of the Vodafone Group or to any persons acting on their behalf are expressly
bought or sold in the past or the yield on such investments cannot be relied upon as a guide qualified in their entirety by the factors referred to above. No assurances can be given that the
to the future performance of such investments. forward-looking statements in or made in connection with this presentation will be realised.
References to Vodafone are to Vodafone Group Plc and references to Vodafone Group are to Any forward-looking statements are made as of the date of this presentation. Except as
Vodafone Group Plc and its subsidiaries unless otherwise stated. Vodafone, the Vodafone otherwise stated and as may be required to comply with applicable law and regulations,
Speech Mark Devices, Vodacom and Together We Can are trade marks owned by Vodafone. Vodafone does not intend to update these forward-looking statements and does not
The Vantage Towers Logo and the VT Monogram Logo are trade marks owned by Vantage undertake any obligation to do so.
Towers AG. Other product and company names mentioned herein may be the trade marks of
their respective owners.
Q1 FY23 Trading Update
25 July 2022 14Group investors.vodafone.com Upcoming events
Investor Relations
ir@vodafone.co.uk
1 Kingdom Street, London, W2 6BY
26 Annual General Meeting
July
Matthew Johnson
Director matthew.johnson@vodafone.com
Group IR
28 Social Contract
Sep Investor Briefing
Daniel Morris
Deputy Director daniel.morris@vodafone.com
Group IR
Roy Teal 15 Half Year FY23 Results
Deputy Director roy.teal@vodafone.com
Group IR NovYou can also read


