Forecasting the U.S. and Wisconsin Economies in 2021
←
→
Page content transcription
If your browser does not render page correctly, please read the page content below
Forecasting the U.S. and Wisconsin
                   Economies in 2021

               Junjie Guo and Noah Williams
Center for Research on the Wisconsin Economy, UW-Madison
                      January 19, 2021

Abstract
This paper provides forecasts for the United States and Wisconsin economies in 2021.
The economic disruptions caused by the COVID-19 pandemic have made forecasting
difficult. To deal with the volatility caused by the shutdowns and reopening requires
modifying standard procedures. For each economy, we first estimate a mixed-
frequency vector auto-regression model using data before the pandemic started in
March 2020, and then use estimated model to forecast each variable forward by taking
the data since March 2020 as given. We forecast that both economies will continue to
recover in 2021. However, the recovery will be slower than it was in the second half of
2020, and most economic indicators may not reach their pre-pandemic levels by the
end of 2021. For the U.S. economy, we forecast that the year-over-year growth rate of
real GDP will reach about 2.9%, personal consumption expenditures will grow by
about 4.5%, inflation will remain below 2%, the unemployment rate will drop to about
5.7%, the economy will add about 3.3 million nonfarm jobs, and the average hourly
earnings will increase by about 2.4%. For the Wisconsin economy, we forecast that the
year-over-year growth rate of real GDP will reach about 3.0%, the unemployment rate
will drop to about 4.2%, and the economy will add about 122 thousand nonfarm jobs.
We project that the manufacturing sector will experience a faster recovery than the
overall economy, and both economies face significant uncertainties. There is a
significant chance that both economies will grow by 5% or more, but also a significant
chance that both economies will grow by 1% or less.

                               https://crowe.wisc.edu
Forecasting the U.S. and Wisconsin Economies in 2021
1 Overview
This paper provides forecasts for the United States and Wisconsin economies in 2021.
The economic disruptions caused by the COVID-19 pandemic have made forecasting
difficult. The mass shutdowns in the spring led to the largest drops in economic activity
on record, while the later reopening led to the largest increases in activity, although
levels of most variables have remained far below pre-pandemic levels. As we discuss
below, to deal with this unprecedented volatility requires modifying standard forecasting
procedures.
We forecast that both economies will continue to recover in 2021. However, the recovery
will be slower than it was in the second half of 2020, and most economic indicators may
not reach their pre-pandemic levels by the end of the year. We project that the
manufacturing sector will experience a faster recovery than the overall economy,
consistent with the fact that the pandemic has had a much larger impact on the service
sector, which requires more face-to-face contact. Our forecasts also suggest that both
economies face significant uncertainties in 2021.
National Forecast
Our median forecasts suggest that, by the end of 2021, the year-over-year growth rate of
real GDP will reach about 2.9%, personal consumption expenditures will grow by about
4.5%, inflation will remain below 2%, the unemployment rate will drop to about 5.7%,
the economy will add about 3.3 million nonfarm jobs, and average hourly earnings will
increase by about 2.4%. Interest rates will remain relatively flat, but the stock market will
continue its strong performance, with the S&P 500 index growing by about 12%. The
manufacturing sector will recover similarly, although it may recoup a larger fraction of its
employment lost to the pandemic than the overall economy.
The model also suggests that the economy faces some significant uncertainty. Although
we do not directly model the spread of the virus, the economic uncertainty is consistent
with uncertainty in the path of the virus, speed of vaccinations, scale of the fiscal and
economic response, and resultant speed of recovery. There is a significant chance that
real GDP will grow by 5% or more, the unemployment rate will drop below 5%, and the
economy will add more than 5 million nonfarm jobs. At the same time, there is also a
significant chance that real GDP will grow by 1% or less, the unemployment rate will
remain above 6%, and the economy will add only about 1 million nonfarm jobs. Finally,
the model projects that there is a 12% chance that real GDP will decline in two
consecutive quarters, a common definition of a recession.
Relative to other national forecasts, ours is on the more pessimistic side. For example,
many of the Wall Street banks are projecting GDP growth in the 4-5% range, partially
driven by increased fiscal stimulus with the federal government under unified
Democratic control. By contrast, our forecast is based on previous economic
relationships (rather than projected policy changes) and suggests a slower recovery,
more comparable to growth following the last recession where fiscal support had muted
effects on economic growth.
https://crowe.wisc.eduForecasting the U.S. and Wisconsin Economies in 2021
Wisconsin Forecast
For the Wisconsin economy, the median forecasts suggest that, by the end of 2021, the
year-over-year growth rate of real GDP will reach about 3%, the unemployment rate will
drop to about 4.2%, and the economy will add about 122 thousand nonfarm jobs. The
manufacturing sector will experience a faster recovery, with output reaching its pre-
pandemic level by the end of the year.
As with the national economy, the model forecasts that the state economy faces some
significant uncertainty. Our model suggests there is a significant chance that real GDP
will grow by more than 5%, the unemployment rate will drop back down to the pre-
pandemic historic lows around 3%, and the economy will reach its level before the
pandemic by adding over 200 thousand nonfarm jobs. At the same time, there is also a
significant chance that the growth rate of real GDP will be negative, the unemployment
rate will remain at 5% or higher, and the economy will add only about 18 thousand
nonfarm jobs. Finally, the model projects there is an over 30% chance that real GDP in
Wisconsin will decline in two consecutive quarters, much higher than the national value
of 12%. This reflects the enhanced volatility in the state-level data.
Methodology
Our forecasts are based on a mixed-frequency vector auto-regression model with
exogenous variables (MF-VARX). As with other VAR models used for forecasting, the
MF-VARX model assumes that a variable in a given period depends on its lagged values
as well as the current and lagged values of other variables. This dependence is estimated
using historical data. Assuming the recent trends and relationships between economic
variables at the national and state levels will continue, the estimated model is then used
to forecast each variable forward. Changes in federal and state policy going forward thus
only enter our forecasts to the extent that expectations of these changes are reflected in
current variables. For example, expectations of future fiscal and monetary policies are
priced into current financial indicators and investment decisions.
We use 18 variables for the national economy covering measures of overall economic
activity, like GDP and investment, as well as measures of specific sectors like the labor
market, the financial market, and the manufacturing sector. Our model for the Wisconsin
economy includes 12 state-level variables with similar coverage as the national variables,
which are also included and treated as exogenous to the state economy.
For each economy, we first estimate the model using data before the pandemic started in
March 2020, and then use the estimated model to forecast each variable forward by
taking the data since March 2020 as given. By dropping the data since March 2020 from
the estimation sample, we avoid the impact of those unprecedented values on parameter
estimates. As illustrated by Lenza and Primiceri (2020), for the purpose of estimation,
this ad-hoc strategy of dropping those observations is acceptable and preferrable to
including them without special treatment. However, this approach may understate
uncertainty when used for forecasting. Essentially, this approach assumes that, starting
https://crowe.wisc.eduForecasting the U.S. and Wisconsin Economies in 2021
from their latest values, the economic variables would evolve forward in the same way as
they have historically.
2 The Model and Data
As discussed above, we use a mixed-frequency vector auto-regression model with
exogenous variables (MF-VARX). A detailed description of the model can be found in
Guo and Williams (2018), which uses the same model to forecast the U.S. and Wisconsin
economies in 2018. Here we only describe the model briefly.
Traditional VAR models require all variables to be measured at the same frequency. For
example, quarterly variables cannot be used directly in a model of monthly variables. To
relax this restriction and utilize the information from variables of different frequencies
for forecasting, Schorfheide and Song (2015) developed a mixed-frequency vector auto-
regression (MF-VAR) model that treats a low frequency (e.g. quarterly) variable as
evolving at the high frequency (e.g. monthly) but are only measured infrequently.
Working with national variables only, Schorfheide and Song (2015) assume that all
variables are endogenous and could affect each other. We use the same approach in our
model for the national economy, but extend the original MF-VAR model to allow for
exogenous variables at the national level in our model for the Wisconsin economy.
As with other VAR models used for forecasting, the MF-VARX model assumes that a
variable in a given period depends on its lagged values as well as the current and lagged
values of other variables. This dependence is estimated using historical data. Assuming
the recent trends and relationships between economic variables at the national and state
levels will continue, the estimated model is then used to forecast each variable forward.
Changes in federal and state policy going forward only enter our forecasts to the extent
that expectations of these changes are reflected in current variables. For example,
expectations of future fiscal and monetary policies are priced into current financial
indicators and investment decisions.
Table below 1 lists the variables used in this paper. There are 18 variables for the national
economy and 12 variables measuring the Wisconsin economy. For each economy, we use
both measures of overall economic activity like GDP and investment and indicators for
specific sectors like the labor market, the financial market, and the manufacturing sector.
The variables are measured either monthly or quarterly. With the exception of state tax
collections, which is obtained from the U.S. Census Bureau, all other variables are
retrieved from the FRED database maintained by the Research division of the Federal
Reserve Bank of St. Louis.
We use data available by January 15, 2021. By this date, most of the quarterly variables
were available until the third quarter (Q3) of 2020, most of the monthly variables at the
national level were available until December (M12) 2020, and most of the monthly
variables at the state level were available until November (M11) 2020.
https://crowe.wisc.eduForecasting the U.S. and Wisconsin Economies in 2021
Table 1: Description of Variables
Variable (short name) End Series name in FRED
U.S.
Real gross domestic product (gdp) Q3 GDPC1
Fixed private investment (fpi) Q3 FPI
Real government expenditures (gce) Q3 GCEC1
Manufacturing real output index (outms) Q3 OUTMS
Civilian unemployment rate (ur) M12 UNRATE
Total nonfarm payroll employment (emp) M12 PAYEMS
Manufacturing employment (manemp) M12 MANEMP
Aggregate weekly hours index (hrs) M12 AWHI
Average hourly earnings in private sector (wage) M12 AHETPI
Average hourly earnings in manufacturing (manwage) M12 CES3000000008
Personal consumption expenditures (pce) M11 PCE
PCE price index (pcepi) M11 PCEPI
PCE price index excluding food and energy (pcepilfe) M11 PCEPILFE
Industrial production index (indpro) M12 INDPRO
Effective federal funds rate (fedfunds) M12 FEDFUNDS
10-year treasury bond yield (gs10) M12 GS10
Moody’s seasoned Baa corporate bond yield (baa) M12 BAA
S&P 500 index (sp500) M12 SP500
Wisconsin
Real GDP (wigdp) Q3 WIRQGSP
Manufacturing GDP (wimangdp) Q3 WIMANRQGSP
Personal income (wipinc) Q3 WIOTOT
All-transactions house price index (wihpi) Q3 WISTHPI
Return on average assets for banks (wiroa) Q3 WIROA
Tax collections (witax) Q3 Census Bureau
Unemployment rate (wiur) M11 WIUR
Civilian labor force (wilf) M11 WILF
Nonfarm employment (wiemp) M11 WINA
Manufacturing employment (wimanemp) M11 WIMFG
Initial unemployment insurance claims (wiiclaims) M12 WIICLAIMS
Average hourly earnings: manufacturing (wimanwage) M11 SMU55000003000000008SA
Note. The second column (End) reports the last period (month: M or quarter: Q) when the data is
available. Except for tax collections obtained from the U.S. Census Bureau, all other variables are retrieved
from the FRED database maintained by the Research division of the Federal Reserve Bank of St. Louis.
The unprecedented impact of the pandemic affects both the estimation and the
forecasting of any economic model. As discussed above, to address these impacts, we first
estimate the model for each economy using data before the pandemic started in March
2020, and then use the estimated model to forecast each variable forward by taking the
data since March 2020 as given. By dropping the data since March 2020 from the
estimation sample, we avoid the impact of those unprecedented values on parameter
estimates. As illustrated by Lenza and Primiceri (2020), for the purpose of estimation,
this ad-hoc strategy of dropping those observations is acceptable and preferrable to
including them without special treatment. However, this approach may understate
https://crowe.wisc.eduForecasting the U.S. and Wisconsin Economies in 2021
uncertainty when used for forecasting. Essentially, this approach assumes that, starting
from their latest values, the economic variables would evolve forward in the same way as
they have historically.
To account for the signal by the Federal Reserve that interest rates will be kept near zero
for years, 1 we assume the effective federal funds rate will be flat at its latest value of
0.09% throughout 2021.
3 Forecast for the U.S. Economy
This section reports our forecasts for the U.S. economy. Overall, the model forecasts that
the national economy will continue to recover in 2021. However, the recovery will be
slower than it was in the second half of 2020, and most economic indicators may not
reach their pre-pandemic levels by the end of the year.
Specifically, the median forecasts suggest that, by the end of 2021, the year-over-year
growth rate of real GDP will reach about 2.92%, personal consumption expenditures will
grow by about 4.53%, inflation will remain below 2%, the unemployment rate will drop
to about 5.7%, the economy will add about 3.3 million nonfarm jobs, and the average
hourly earnings will increase by about 2.4%. Interest rates will remain relatively flat, but
the stock market will continue its strong performance, with the S&P 500 index growing
by about 12%. The manufacturing sector will recover similarly, although it may recoup a
larger fraction of its employment lost to the pandemic than the overall economy.
The model also suggests that the economy faces some significant uncertainty. There is a
significant chance that real GDP will grow by 5% or more, the unemployment rate will
drop below 5%, and the economy will add more than 5 million nonfarm jobs. At the same
time, there is also a significant chance that real GDP will grow by 1% or less, the
unemployment rate will remain above 6%, and the economy will add only about 1 million
nonfarm jobs. Finally, the model projects that there is a 12% chance that real GDP will
decline in two consecutive quarters, a common definition of a recession.
The rest of this section discusses these forecasts in detail.
3.1 Output and Expenditures
Figure 1 plots our forecasts of real GDP (gdp) and personal consumption expenditures
(pce), both measured in billions of dollars. The red vertical line indicates December
2020, the last month when data are available for some variables. The black curve reports
the actual values when available and median forecasts otherwise. The yellow shaded area
reports the 67% forecast intervals.
The median forecasts suggest that the economy will continue to recover from the
recession induced by the pandemic. However, the recovery will be slower in 2021 than it
was in the second half of 2020. The level of output in 2020Q3 was similar to what it was
in 2018Q1. According to the median forecasts, the level of output in 2021Q4 will be
1
https://www.wsj.com/articles/fed-debates-how-to-set-policy-for-the-post-pandemic-economy-11591781402
https://crowe.wisc.eduForecasting the U.S. and Wisconsin Economies in 2021
similar to what it was in 2019Q2. In other words, the median forecasts suggest that in
2021 output will grow at a rate similar to what it was before the pandemic, but it may not
be able to reach its pre-pandemic level by the end of 2021.
Figure 1: Real GDP (gdp) and personal consumption expenditures (pce) in the U.S., both in billions of dollars. The
red vertical line indicates December 2020. The black curve reports the actual values when available and median
forecasts otherwise. The yellow shaded area reports the 67% forecast intervals.
Similarly, the median forecasts suggest that in 2021 personal consumption expenditures
will grow at a rate similar to what it was before the pandemic. Different from output
which only recovered partially by the last data point in 2020Q3, personal consumption
expenditures regained most of its losses in 2020. The median forecasts suggest that
personal consumption expenditures will exceed its pre-pandemic level by the end of
2021Q1.
Table 2 reports the median forecasts of year-over-year growth rates of real GDP (GDP)
and personal consumption expenditures (PCE). We forecast that real GDP in 2020Q4
will be about 3.55% lower than its level in 2019Q4, and real GDP in 2021Q1 will be 2.44%
lower than its level in 2020Q1. Relative to the trough in 2020Q2, real GDP in 2021Q2
will be 9.28% higher. Finally, real GDP in 2021Q3 and 2021Q4 will grow at an annual
rate of 2.28% and 2.92%, respectively. The growth rates of personal consumption
expenditures are larger in levels but follow a similar pattern over time.
Table 2. Year-Over-Year Growth Rates of Output and Expenditures
Quarter GDP PCE
2020Q4 -3.55 -0.87
2021Q1 -2.44 2.05
2021Q2 9.28 14.46
2021Q3 2.28 5.23
2021Q4 2.92 4.53
As indicated by the yellow shaded areas in Figure 1, the model suggests the economy
faces some uncertainty. In particular, the left panel shows that there is a significant
chance that real GDP will exceed its pre-pandemic level by the end of 2021. At the same
https://crowe.wisc.eduForecasting the U.S. and Wisconsin Economies in 2021
time, there is also a significant chance that real GDP will only grow slightly in 2021. The
67% forecast interval for the year-over-year growth rate of real GDP in 2021Q4 is
[1%,4.95%]. One common definition of a recession is that real GDP declines in two
consecutive quarters. According to this definition, the model forecasts that the
probability of a recession in 2021 is about 12%.
3.2 Inflation
Figure 2 reports our inflation forecasts. We use two measures of inflation: the year-over-
year growth rate of the price index of overall personal consumption expenditures (pcepi)
and the year-over-year growth rate of the price index of personal consumption
expenditures excluding food and energy (pcepilfe). Due to the drop in price levels in
2020Q2, there will be a spike in measured inflation in 2021Q2. Other than that, the
median forecasts suggest that inflation will remain at a low level in 2021: the overall
inflation will be about 1.8%, while the inflation excluding food and energy will be about
1.5%.
Figure 2: Year-over-year growth rates of price indices for personal consumption expenditures in the U.S: overall
(pcepi) and excluding food and energy (pcepilfe). The red vertical line indicates December 2020. The black curve
reports the actual values when available and median forecasts otherwise. The yellow shaded area reports the 67%
forecast intervals.
3.3 The Labor Market
Figure 3 reports our forecasts for the labor market. The first panel (ur) shows that the
unemployment rate will continue to decline in 2021. The median forecasts suggest it will
reach about 5.7% by the end of the year, which is 1 percentage point below the latest
value of 6.7% in 2020M12 but still much higher than its pre-pandemic level of around
3.5%.
The second panel (emp) suggests that employment will continue to grow in 2021. The
median forecasts suggest the economy will add about 3.3 million nonfarm jobs, which is
about 1 million more than what we have seen in the few years before the pandemic.
However, given the unprecedented employment loss induced by the pandemic, this
growth is far from enough to bring employment back to its pre-pandemic level.
https://crowe.wisc.eduForecasting the U.S. and Wisconsin Economies in 2021
Finally, the last panel (wage) shows that the average hourly earnings in the private sector
will continue to increase. The median forecasts suggest that it will rise from $25.09 in
2020M12 to about $25.69 in 2021M12. This represents a 2.4% increase, lower than
recent experience of over 3% since 2018 but comparable with the growth before that,
when earnings growth averaged around 2.5%.
Figure 3: Labor market indicators in the U.S: the unemployment rate (ur), nonfarm employment in thousands (emp),
and average hourly earnings of production and nonsupervisory employees in dollars (wage). The red vertical line
indicates December 2020. The black curve reports the actual values when available and median forecasts otherwise.
The yellow shaded area reports the 67% forecast intervals.
Overall, consistent with our forecasts for output and expenditures, the figure suggests
that the labor market will continue to recover in 2021 but at a slower pace than it did in
the second half of 2020.
The 67% forecast intervals shown by the yellow-shaded areas again suggest that the labor
market face some uncertainty. There is a significant chance that the unemployment rate
may drop below 5% and the economy may add more than 5 million nonfarm jobs. At the
same time, there is also a significant chance that the unemployment rate may remain
above 6% and the economy may only add about 1 million nonfarm jobs.
https://crowe.wisc.eduForecasting the U.S. and Wisconsin Economies in 2021
3.4 The Financial Market
Figure 4: Financial market indicators in the U.S: effective federal funds rate (fedfunds), 10-year treasury constant
maturity rate (gs10), Moody’s seasoned Baa corporate bond yield (baa), and S&P 500 index (sp500). The red vertical
line indicates December 2020. The black curve reports the actual values when available and median forecasts
otherwise. The yellow shaded area reports the 67% forecast intervals.
Figure 4 plots our forecasts for the financial market. As mentioned before, we assume the
effective federal funds rate (fedfunds) will stay at its latest level of around 0. The median
forecasts suggest the 10-year treasury yield (gs10) shown in the second panel and the
Moody’s seasoned Baa corporate bond yield (baa) shown in the third panel will also be
roughly flat at their current levels. The stock market, however, will continue its strong
performance. The median forecasts suggest that that the S&P 500 index (sp500) shown
in the last panel will grow by about 12% in 2021.
3.5 The Manufacturing Sector
Figure 5 plots our forecasts for the manufacturing sector: the first panel shows an index
of manufacturing output (outms), the second panel shows manufacturing employment
(manemp) in thousands, and the third panels shows the average hourly earnings of
production and nonsupervisory employees in manufacturing (manwage).
https://crowe.wisc.eduForecasting the U.S. and Wisconsin Economies in 2021
Figure 5: Indicators for the manufacturing sector in the U.S: an index of real output (outms), employment in
thousands (manemp), and average hourly earnings of production and nonsupervisory employees in dollars
(manwage). The red vertical line indicates December 2020. The black curve reports the actual values when available
and median forecasts otherwise. The yellow shaded area reports the 67% forecast intervals
Roughly speaking, the forecasts for the manufacturing sector are similar to those for the
overall economy. In particular, the median forecasts suggest that the manufacturing
sector will continue to recover in 2021 but at a slower pace than it did in the second half
of 2020, and neither output nor employment may reach their pre-pandemic levels.
Quantitatively, however, the model suggests that the manufacturing sector may be able
to regain a larger fraction of its employment loss than the overall economy. In particular,
the median forecasts suggest that manufacturing employment in 2021M12 will be about
98.3% of its level two years ago in 2019M12, larger than the corresponding number of
96% for all nonfarm employment. This is consistent with the fact that the pandemic has a
larger impact on the service sector which requires more face-to-face contacts.
4 Forecast for the Wisconsin Economy
This section reports our forecasts for the Wisconsin economy in 2021. Overall, as with
the national economy, the model forecasts that the state economy will continue to
recover in 2021. However, the recovery will be slower than it was in the second half of
https://crowe.wisc.eduForecasting the U.S. and Wisconsin Economies in 2021
2020, and most economic indicators may not reach their pre-pandemic levels by the end
of the year.
Specifically, the median forecasts suggest that, by the end of 2021, the year-over-year
growth rate of real GDP will reach about 3%, the unemployment rate will drop to about
4.2%, and the economy will add about 122 thousand nonfarm jobs. The manufacturing
sector will experience a faster recovery, with output reaching its pre-pandemic level by
the end of the year.
As with the national economy, the model forecasts that the state economy faces some
significant uncertainty. There is a significant chance that real GDP will grow by over 5%,
the unemployment rate will drop back down to historic lows around 3%, and the
economy will reach its pre-pandemic level by adding over 200 thousand nonfarm jobs. At
the same time, there is also a significant chance that the growth rate of real GDP will be
negative, the unemployment rate will be 5% or higher, and the economy will add only
about 18 thousand nonfarm jobs. Finally, the model projects that there is an over 30%
chance that real GDP in Wisconsin will decline in two consecutive quarters, much higher
than the national value of 12%.
The rest of this section discusses the forecasts in detail.
4.1 Output and Income
Table 3 and Figure 6 report our forecasts of the year-over-year growth rates of real GDP
(wigdp) and personal income (wipinc) in Wisconsin.
Table 3: Year-Over-Year Growth Rates of GDP and Personal Income for Wisconsin
Quarter GDP Personal Income
2020Q4 -5.70 2.93
2021Q1 -4.09 6.61
2021Q2 9.58 1.59
2021Q3 0.86 5.99
2021Q4 2.99 9.03
The median forecasts suggest that real GDP in 2020Q4 will be about 5.7% lower than its
level in 2019Q4, and real GDP in 2021Q1 will be 4.09% lower than its level in 2020Q1.
Relative to the trough in 2020Q2, real GDP in 2021Q2 will be 9.58% higher. Finally, real
GDP in 2021Q3 and 2021Q4 will grow at an annual rate of 0.86% and 2.99%,
respectively.
This pattern for real GDP in Wisconsin is roughly similar to what we have seen above for
real GDP in Wisconsin. That is, as with the national economy, the model projects that
output in Wisconsin will continue to recover in 2021 but at a slower pace than it did in
2020Q3, and it may not reach its pre-pandemic level by the end of the year.
The pattern for personal income is very different. Instead of a negative impact from the
pandemic, personal income in Wisconsin actually increased dramatically by about 9.6%
https://crowe.wisc.eduForecasting the U.S. and Wisconsin Economies in 2021
in 2020Q2 relative to 2019Q2. This presumably is largely due to the various income
support programs enacted in the Coronavirus Aid, Relief and Economic Security
(CARES) Act. Going forward, the model projects that the growth rate of personal income
in Wisconsin will fluctuate around 5% as it had been in the few years before the
pandemic.
Figure 6: Year-over-year growth rates of real GDP (wigdp) and personal income (wipinc) for Wisconsin. The red
vertical line indicates December 2020. The black curve reports the actual values when available and median forecasts
otherwise. The yellow shaded area reports the 67% forecast intervals.
The yellow-shaded areas in Figure 6 indicate the uncertainties faced by the Wisconsin
economy. There is a significant chance that the year-over-year growth rate of real GDP in
2021Q4 will reach as high as 9%. At the same time, there is also a significant chance that
this rate will drop below zero. The probability that real GDP in Wisconsin will decline in
two consecutive quarters in 2021 is over 30%, much higher than the national value of
12%.
4.2 The Labor Market
Figure 7 below plots our forecasts for the Wisconsin labor market. The first panel (wiur)
shows the unemployment rate. The median forecasts suggest that it will continue to drop
to about 4.2% by the end of 2021, which is 0.8 percentage points lower than its latest
value of 5% in 2020M11 but still higher than its pre-pandemic level of around 3.5%.
The second panel shows nonfarm employment (wiemp) in thousands. The median
forecasts suggest that it will continue to increase, and the economy will add about 122
thousand nonfarm jobs by the end of 2021, which is about six times as large as the
number of nonfarm jobs added in a typical year before the pandemic. However, this
increase is still not enough to bring employment back to its pre-pandemic level.
One contributor to the lack of employment growth is the shrinking labor force. As shown
in the last panel, the civilian labor force in Wisconsin (wilf) had been shrinking gradually
before the pandemic. The model projects that this trend will continue in 2021, and the
economy may lose over 50 thousand of its labor force.
https://crowe.wisc.eduForecasting the U.S. and Wisconsin Economies in 2021
Figure 7: Labor market indicators in Wisconsin: the unemployment rate (wiur), civilian labor force (wilf) and
nonfarm employment (wiemp) in thousands. The red vertical line indicates December 2020. The black curve reports
the actual values when available and median forecasts otherwise. The yellow shaded area reports the 67% forecast
intervals.
The 67% forecast intervals represented by the shaded areas suggest that the risks faced
by the Wisconsin labor market may be much more severe than implied by the median
forecasts. In particular, the unemployment may rise well above 5% and the economy may
only add 18 thousand nonfarm jobs. However, there is also a chance that the labor
market may fare better: with the unemployment rate reaching around 3% and nonfarm
employment reaching its pre-pandemic level by adding over 200 thousand jobs.
4.3 The Banking and Manufacturing Sectors
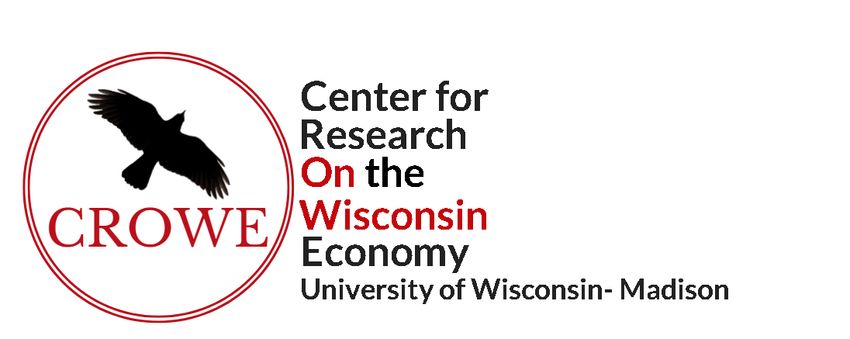
Figure 8 reports our forecasts for the Wisconsin banking and manufacturing sectors. The
left panel show that the return on average assets for banks in Wisconsin (wiroa) has been
relatively flat at around 1.2% in the past few years. The median forecasts suggest that this
return will drop slightly to about 1% in early 2021 before rising to about 1.4% by the end
of the year.
The right panel shows real GDP in the manufacturing sector (wimangdp). The median
forecasts suggest that the manufacturing sector will recover rapidly in 2021 with output
reaching its pre-pandemic level. This projected recovery for manufacturing is faster than
https://crowe.wisc.eduForecasting the U.S. and Wisconsin Economies in 2021
it is for the overall economy in Wisconsin. Again, this is consistent with the fact that the
pandemic has a much larger impact on the service sector which requires more face-to-
face contacts.
Figure 8: The return on average assets for banks (wiroa) and manufacturing output (wimangdp) in millions of chained
2012 dollars. The red vertical line indicates December 2020. The black curve reports the actual values when available
and median forecasts otherwise. The yellow shaded area reports the 67% forecast intervals.
5 Conclusion
Overall, our forecasts suggest that both economies will continue to recover in 2021.
However, the recovery will be slower than it was in the second half of 2020, and most
economic indicators may not reach their pre-pandemic levels by the end of the year. For
both economies, the model also projects a slightly faster recovery of the manufacturing
sector, consistent with the fact that the pandemic has a much larger impact on the service
sector which requires more face-to-face contacts. Finally, the model projects that both
economies face significant uncertainties in 2021.
References
Guo, J. and Williams, N. (2018). Forecasting the US and Wisconsin Economies in 2018.
Research Report, Center for Research on the Wisconsin Economy, University of
Wisconsin-Madison.
Lenza, M. and Primiceri, G. (2020). How to Estimate a VAR after March 2020. Working
paper, Northwestern University.
Schorfheide, F. and Song, D. (2015). Real-Time Forecasting with a Mixed-Frequency
VAR. Journal of Business and Economic Statistics, vol. 33(3), pages 366-380.
Williams, N. (2019). Faulty Data Driving the Manufacturing “Recession” in Pennsylvania
and Wisconsin. Research Report, Center for Research on the Wisconsin Economy,
University of Wisconsin-Madison.
https://crowe.wisc.eduYou can also read