Volume based algorithm of lung dose optimization in novel dynamic arc radiotherapy for esophageal cancer - Nature
←
→
Page content transcription
If your browser does not render page correctly, please read the page content below
www.nature.com/scientificreports
OPEN Volume‑based algorithm of lung
dose optimization in novel dynamic
arc radiotherapy for esophageal
cancer
Kuan‑Heng Lin1,2,3,7, Chen‑Xiong Hsu1,2,7, Shan‑Ying Wang1,4, Greta S. P. Mok5,
Chiu‑Han Chang2, Hui‑Ju Tien1,2, Pei‑Wei Shueng2,6* & Tung‑Hsin Wu1*
This study aims to develop a volume-based algorithm (VBA) that can rapidly optimize rotating
gantry arc angles and predict the lung V5 preceding the treatment planning. This phantom study was
performed in the dynamic arc therapy planning systems for an esophageal cancer model. The angle of
rotation of the gantry around the isocenter as defined as arc angle (θA), ranging from 360° to 80° with
an interval of 20°, resulting in 15 different θA of treatment plans. The corresponding predicted lung
V5 was calculated by the VBA, the mean lung dose, lung V5, lung V20, mean heart dose, heart V30, the
spinal cord maximum dose and conformity index were assessed from dose–volume histogram in the
treatment plan. Correlations between the predicted lung V5 and the dosimetric indices were evaluated
using Pearson’s correlation coefficient. The results showed that the predicted lung V5 and the lung V5 in
the treatment plan were positively correlated (r = 0.996, p < 0.001). As the θA decreased, lung V5, lung
V20, and the mean lung dose decreased while the mean heart dose, V30 and the spinal cord maximum
dose increased. The V20 and the mean lung dose also showed high correlations with the predicted lung
V5 (r = 0.974, 0.999, p < 0.001). This study successfully developed an efficient VBA to rapidly calculate
the θA to predict the lung V5 and reduce the lung dose, with potentials to improve the current clinical
practice of dynamic arc radiotherapy.
Acute radiation pneumonitis is one of the major morbidities after radiotherapy for esophageal tumors1–4.
Dynamic arc radiotherapy is currently the most common radiotherapy technique, which involves rotation of
the gantry of a linear accelerator for 360° around the isocenter of the tumor to administer intensity-modulated
radiation and achieve high tumor c onformity5,6. However, the higher the conformity is, the bigger the angle of
the radiation beam required, consequently causing radiations spread to organs at risk such as the lungs, heart and
spinal cord7,8. Therefore, the selection of gantry arc angle and dose constraints are crucial during the radiation
treatment planning (RTP). The treatment plan should prescribe sufficient dose to achieve the therapeutic effect
and fulfil the dose constraints of organs at risk9.
The selection of gantry arc angle and dose constraints might differ based on the clinical experience and trial-
and-error approaches from radiation oncologists and medical physicists for dynamic arc radiotherapy in the
current computerized treatment planning systems. Therefore, a crucial consideration in dynamic arc radiotherapy
is to determine the optimal arc angle while optimizing the RTP. The idea of the fan-shaped complete block (FSCB)
was first proposed by Chang et al.10, which was designed to limit the beam angle and reduce lung dose in helical
tomotherapy (HT). However, studies on the angle of the FSCB have only been explored at HT rather than the
novel dynamic arc radiotherapy. Moreover, no applicable methods have been developed to rapidly optimize the
arc angle of the gantry, meaning that radiation oncologists and medical physicists must manually determine arc
angles for each RTP based on their experiences. Repeated computation, testing and lung dose analysis required
1
Department of Biomedical Imaging and Radiological Sciences, National Yang Ming Chiao Tung University, Taipei,
Taiwan. 2Division of Radiation Oncology, Far Eastern Memorial Hospital, New Taipei City, Taiwan. 3Industrial
Ph.D. Program of Biomedical Science and Engineering, National Yang Ming Chiao Tung University, Taipei,
Taiwan. 4Department of Nuclear Medicine, Far Eastern Memorial Hospital, New Taipei City, Taiwan. 5Biomedical
Imaging Laboratory, Department of Electrical and Computer Engineering, Faculty of Science and Technology,
University of Macau, Macau, SAR, China. 6Faculty of Medicine, School of Medicine, National Yang Ming Chiao
Tung University, Taipei, Taiwan. 7These authors contributed equally: Kuan-Heng Lin and Chen-Xiong Hsu. *email:
shuengsir@gmail.com; tung@ym.edu.tw
Scientific Reports | (2021) 11:4360 | https://doi.org/10.1038/s41598-021-83682-3 1
Vol.:(0123456789)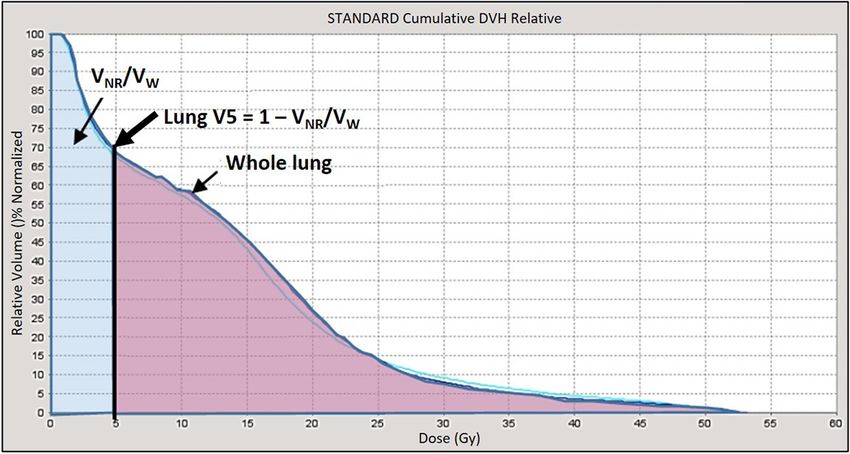
www.nature.com/scientificreports/
Figure 1. The axial view of the virtual esophageal tumor in the anthropomorphic phantom. The green line
region represents the heart, the pink line region represents the spinal cord, and the dark blue line regions
represent the lungs. The light blue line region represents the CTV and the red area represents the PTV.
for obtaining optimal angles are time-consuming and prone to human errors. Thus, this study aims to develop
a novel volume-based algorithm (VBA) that can rapidly optimize the arc angles of rotating gantry and predict
the relative lung volume receiving more than 5 Gy ( V5) preceding the inverse planning in the dynamic arc
radiotherapy planning systems.
Materials and methods
Phantom image acquisition and delineation of planning target volume and organs at risk. An
anthropomorphic phantom study was simulated in the dynamic arc therapy planning systems for an esopha-
geal cancer model. An anthropomorphic phantom (ATOM 701; CIRS, Norfolk, VA, USA) was scanned using a
computed tomography (CT) (Discovery CT590 RT, GE Medical Systems, Amersham, UK). The slice thickness
of CT image was 2.5 mm, and the scan range was from the oral cavity to the L5 vertebra. The CT images were
then imported to the Pinnacle treatment planning system (version 9.8; Philips Medical Systems North America,
Andover, MA, USA) to delineate the virtual esophageal tumor and surrounding normal organs in each slice. The
location of the virtual esophageal tumor was set in the thoracic middle-third esophagus; the horizontal diameter
and vertical axis length of the virtual gross tumor volume (GTV) were 4.4 cm and 11.4 cm respectively. The
clinical target volume (CTV) was designed to cover a region with subclinical disease from GTV by expanding
4 cm superiorly and inferiorly, and 0.5 cm left, right, anteriorly and posteriorly. To define the planning target
volume (PTV), organ movements caused by breathing, swallowing and position uncertainty in each therapy
were considered. In accordance with clinical experience, the PTV was defined by expending the CTV three-
dimensionally by 0.8 cm to the superior, inferior, left, right, anterior and posterior. The horizontal diameter,
vertical axis length and total volume of the PTV were 7 cm, 21 cm and 497.73 c m3, respectively. The normal
organs such as heart, lung and spinal cord were defined (Fig. 1).
Definition of the arc angle and the restricted angle of VBA. This study used the volumetric modu-
lated arc therapy (VMAT) and the HT system to simulate treatment for esophageal cancer. The centroid of the
PTV was defined as the isocenter. The angle of rotation of the gantry around the isocenter was defined as arc
angle (θA) and the remaining angle was the angle of restricted radiation, defined as the restricted angle (θRES)
(Fig. 2 and Eqs. 1–2).
θA + θRES = 360◦ (1)
The relationship between restricted angle in left or right lung, θRESL or θRESR and θRES was shown below.
θRESL + θRESR = θRES (2)
The establishment volume‑based algorithm (VBA) for treatment planning. As illustrated in
Fig. 3, the transverse diameter of the thorax (T) and the diameter of the PTV (E) were measured on the axial
plane of the centroid of the PTV (Fig. 3A), while the vertical axis length of the PTV (Lt) was measured on the
coronal image of the centroid of the PTV (Fig. 3B).
The radius of one side of the restricted volume (R) was calculated by Eq. (3):
T−E−4
R = (3)
2
Scientific Reports | (2021) 11:4360 | https://doi.org/10.1038/s41598-021-83682-3 2
Vol:.(1234567890)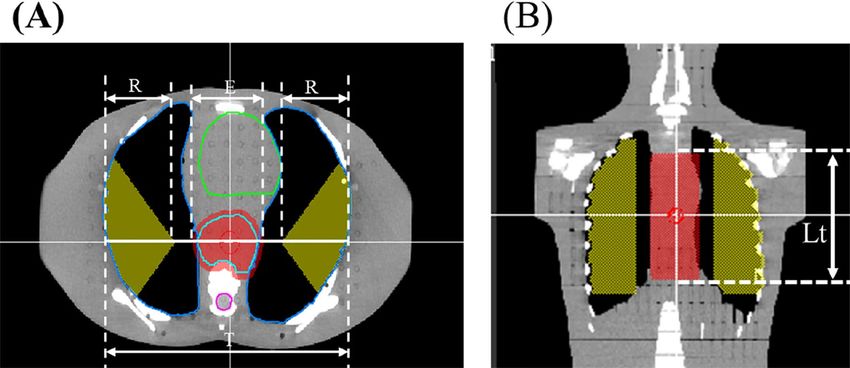
www.nature.com/scientificreports/
Figure 2. The gantry’s arc angle θA (grey solid line) and the θRES (green dotted line) defined in dynamic arc
therapy.
Figure 3. (A) Axial view and (B) coronal view of the PTV (red area) and restricted volume (yellow area). The
transverse diameter of the thorax (T), the radius of one side of the restricted volume (R), the transverse diameter
of the PTV (E) and the length of the PTV (Lt) are defined in the images.
The θRES were determined for each slice of image according to the defined θA. Eventually, a fan volume was
simulated. The volume which the fan volume overlapped with the lung was defined as the restricted volume
(VRES) (Fig. 4). The total volume out of the field ( VOW) was the sum of the volume out of the field in the right
lung (VOR) and the volume out of the field in the left lung ( VOL). The combination of V
RES and V
OW was defined
as the non-radiated volume ( VNR) in the lungs (Eq. 4) and the rest of the lung volume was defined as the radiated
lung volume. The whole lung volume was defined as V W.
VNR = VRES + VOW (4)
The R, Lt and θRES are then input into Eq. (5) to obtain the fan volume of VRES:
θRES
VRES = πR 2 (Lt + 4) (5)
360◦
Scientific Reports | (2021) 11:4360 | https://doi.org/10.1038/s41598-021-83682-3 3
Vol.:(0123456789)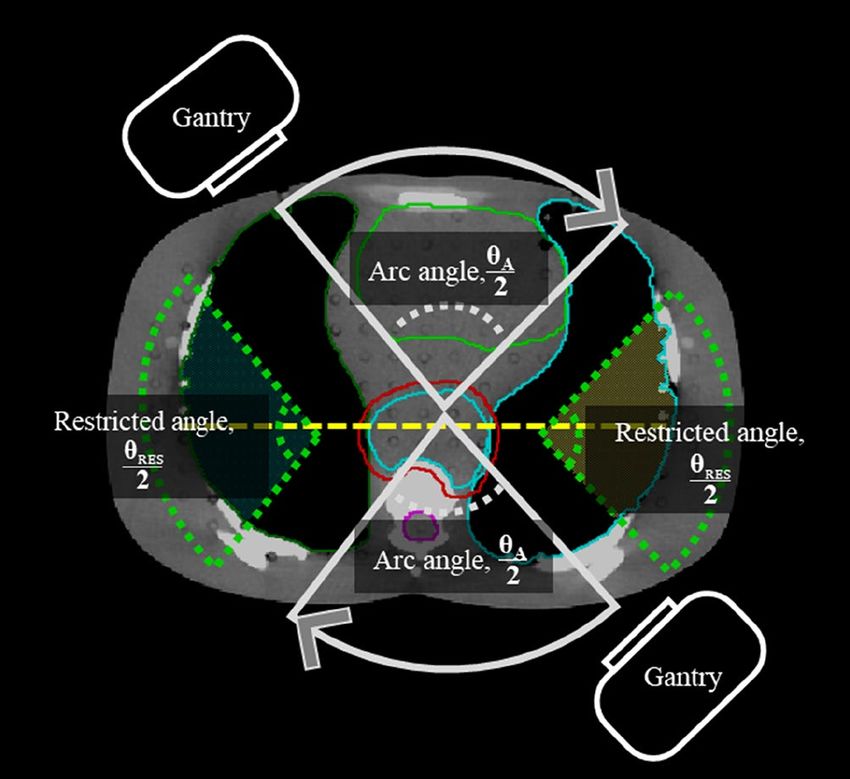
www.nature.com/scientificreports/
Figure 4. (A) Axial view and (B) coronal view of different volumes of interest using volume-based algorithm
(VBA). Restricted volume (VRES) was divided into right lung restricted volume (VRESR) (purple area) and left
lung restricted volume (VRESL) (yellow area). The total volume out of the field (VOW) was the sum of the volume
out of the field in the right lung (VOR) (green area) and the volume out of the field in the left lung (VOL) (blue
area). The non-radiated volume (VNR) was the sum of VRES and VOW. The rest of the lung volume was defined as
the radiated lung volume.
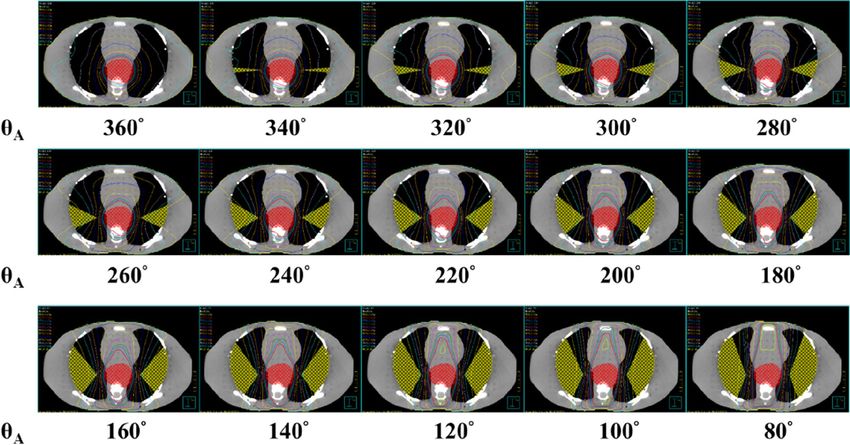
Figure 5. The dose-volume histogram for lung.
As presented in the dose–volume histogram (DVH) (Fig. 5), the area of radiation dose < 5 Gy represented the
proportion of VNR to the whole lung in the treatment plan, VNR/VW. On the contrary, the lung V5 is the propor-
tion of the radiated lung volume with radiation dose ≥ 5 Gy to the whole lung in the treatment plan, 1 − VNR/VW.
On the basis of the lung dose constraint study by Pinnix et al.11, the anticipated starting point of lung V5 in
this study was set to 55%; that is, more than 45% of the V
W was defined as the nonradiated volume ( VNR, Eq. 6).
VNR ≥ Vw × 0.45 (6)
Equations (4) and (5) are input into Eq. (6) to produce Eq. (7):
θRES
πR 2 (Lt + 4) + VOW ≥ VW × 0.45 (7)
360◦
The θA ranged from 360° to 80° with an interval of 20°, resulting in 15 RTP (Fig. 6). Corresponding θRES of 0°
to 280° and VRES was established in the two lungs. The equations of the VBA were used to calculate VRES, VNR and
the predicted lung V
5. During the VBA calculation, transverse diameter of the thorax (T), the transverse diameter
of the PTV (E) and the length of the PTV (Lt) were set to be 30 cm, 7 cm and 21 cm, respectively. Moreover, the
VW and VOW were set to be 4483.38 and 294.72 c m3, respectively for this particular phantom. The θA would be
set in VMAT and the angle of complete block would be set with θRES in HT. Herein, 100% of the prescribed dose
Scientific Reports | (2021) 11:4360 | https://doi.org/10.1038/s41598-021-83682-3 4
Vol:.(1234567890)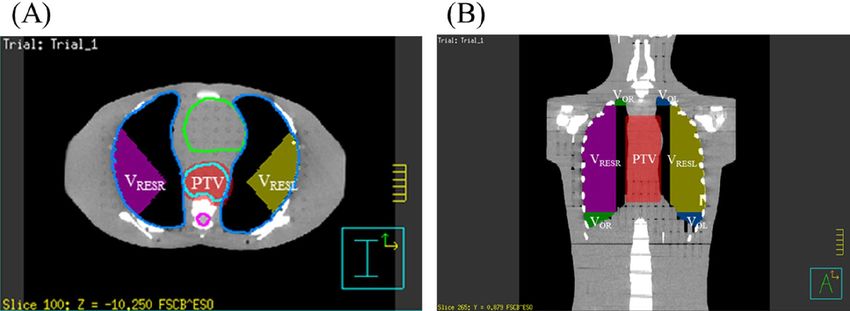
www.nature.com/scientificreports/
Figure 6. Fifteen arc angles (θA) range from 360° to 80° with 20° interval in RTP. The corresponding V
RES
(yellow area) are established in the both lungs.
was received by 100% of the CTV while 95% of the prescribed dose was received by 95% of CTV. Then, RTP of
15 different θA were performed in HT and VMAT separately with 20 iterations and 40 iterations. A total of 30
HT and 30 VMAT RTP were generated. Finally, the mean lung dose, lung V 5, lung V20, mean heart dose, heart
V30, the spinal cord maximum dose and conformity index (CI) were assessed in DVH. The CI was calculated by
roup12.
the definition of Radiation Therapy Oncology G
Statistical analyses. The following parameters were recorded using the information provided by the
cumulative DVH in the RTP of HT and VMAT: mean lung dose, lung V 5, lung V
20, mean heart dose, heart V30,
the spinal cord maximum dose and CI. SPSS software package version 24.0 (IBM Corporation., Armonk, NY,
USA) was used to conduct a Pearson correlation analysis between the predicted lung V5 by VBA and the radia-
tion dose of various normal tissues in the treatment plan. A p < 0.01 was considered as statistically significant.
Results
Relationship between the predicted lung V5 by VBA and the lung V5 in the treatment
plans. Table 1 shows for 15 different θA, corresponding θRES, VRES, VNR, the predicted lung V
5 by VBA (V5_
VBA) and the lung V5 in the treatment plan (V5_RTP). When θA was 360°, the θRES, VRES, VNR/VW, V5_VBA and
the lung V5_RTP were 0°, 0 cm3, 6.75%, 93.43% and 92.37%, respectively. When θA was 80°, the corresponding
θRES, VRES and VNR/VW were 280°, 2230 c m3, 56.32% while the corresponding lung V
5_VBA decreased to 43.68%
and the lung V 5_RTP decreased to 44.48%. When the θA was no more than 120°, either the lung V 5_VBA or the
lung V5_RTP would be less than 55%. Moreover, the differences between the lung V5_VBA and the lung V5_RTP
over all θA were less than 5%.
Assessment of doses delivered to organs at risk and the conformity of plans at various θA in
the treatment plans. There were 30 HT and 30 VMAT treatment plans calculated from 15 different θA as
shown in Table 2. When θA was 360º, the mean lung dose, lung V 5, and V
20 were 18.40 Gy, 92.37%, and 32.21%,
respectively, the mean heart dose and heart V 30 were 18.59 Gy and 6.28%, respectively, and the spinal cord
maximum dose was 50.87 Gy. When θA was reduced to 80°, the mean lung dose, lung V5, and V20 were 10.38 Gy,
44.48%, and 18.88%, respectively, the mean heart dose and heart V30 were 37.76 Gy and 72.77%, respectively,
and the spinal cord maximum dose was 54.80 Gy. As θA decreased, the mean lung dose, lung V5, and lung
V20 decreased, the mean heart dose, heart V 30 and CI increased, while the spinal cord maximum dose slightly
increased.
Figure 7 shows the correlation between the lung V 5_VBA at different θA and various normal tissue doses in
the treatment plan. The lung V5 and V20 as well as the mean lung dose were significantly and positively associated
(r = 0.996, 0.974, 0.999, p < 0.001) with the lung V5_VBA (Fig. 7A–C). The mean heart dose was significantly and
negatively correlated (r = − 0.996, p < 0.001) with the lung V
5_VBA (Fig. 7D).
Scientific Reports | (2021) 11:4360 | https://doi.org/10.1038/s41598-021-83682-3 5
Vol.:(0123456789)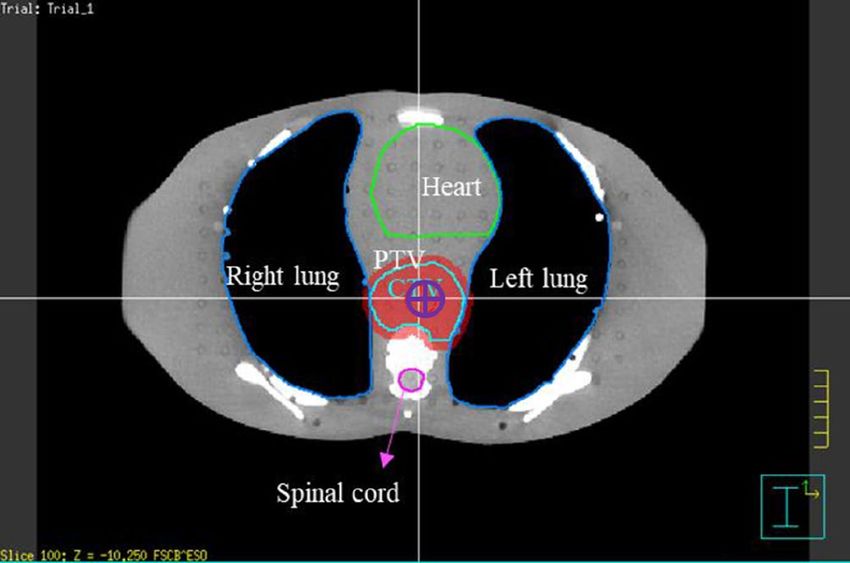
www.nature.com/scientificreports/
5_VBA and V
Difference of Lung V 5_RTP
θA (°) θRES (°) VRES (cm3) VNR/VW (%) Lung V5_VBA (%) Lung V5_RTP (%) (%)
360 0 0 6.57 93.43 92.37 − 1.14
340 20 128 9.43 90.57 90.65 0.09
320 40 249 12.12 87.88 89.43 1.76
300 60 377 14.99 85.01 87.92 3.41
280 80 508 17.90 82.10 85.46 4.08
260 100 642 20.89 79.11 82.31 4.05
240 120 789 24.17 75.83 78.09 2.99
220 140 946 27.67 72.33 74.46 2.95
200 160 1107 31.28 68.72 70.58 2.70
180 180 1274 34.98 65.02 65.90 1.36
160 200 1458 39.10 60.90 61.68 1.27
140 220 1634 43.02 56.98 56.36 − 1.09
120 240 1825 47.27 52.73 51.67 − 2.01
100 260 2013 51.47 48.53 47.79 − 1.53
80 280 2230 56.32 43.68 44.48 1.83
Table 1. The 15 different θA, the lung V5_VBA and the lung V5_RTP.
Spinal cord
Mean lung dose Mean heart dose maximum dose
θA (°) θRES (°) VRES (cm3) (Gy) Lung V20(%) Lung V5 (%) (Gy) Heart V30 (%) (Gy) CI Of HT CI of VMAT
360 0 0 18.40 32.21 92.37 18.59 6.28 50.87 1.15 1.21
340 20 128 17.76 30.61 90.65 20.72 10.93 50.86 1.17 1.46
320 40 249 17.48 30.32 89.43 22.63 16.76 51.53 1.21 1.52
300 60 377 17.14 30.30 87.92 22.88 18.12 51.65 1.23 1.48
280 80 508 16.73 29.86 85.46 24.34 23.36 51.93 1.22 1.56
260 100 642 16.30 29.88 82.31 24.28 23.05 52.71 1.22 1.55
240 120 789 15.69 29.62 78.09 26.53 32.25 52.78 1.18 1.71
220 140 946 15.08 28.37 74.46 27.07 34.84 53.26 1.18 1.75
200 160 1107 14.47 27.45 70.58 28.43 42.80 53.42 1.19 1.99
180 180 1274 13.88 26.77 65.90 30.07 58.54 54.14 1.24 2.04
160 200 1458 13.16 25.14 61.68 31.86 60.33 55.52 1.21 2.26
140 220 1634 12.53 24.21 56.36 33.11 61.83 54.70 1.29 2.59
120 240 1825 11.61 22.15 51.67 34.71 65.50 54.70 1.33 2.90
100 260 2013 11.07 21.04 47.79 35.57 70.26 54.48 1.31 3.11
80 280 2230 10.38 18.88 44.48 37.76 72.77 54.80 1.34 3.58
Table 2. Comparing 15 different θA, normal tissue doses and conformity indices in the radiation treatment
plans.
Discussion
To our knowledge, the novel VBA was the first algorithm that developed to rapidly calculate the optimal gantry
arc angle and precisely predict the proportion of the lung V5, especially preceding the RTP process for dynamic
arc radiotherapy. Also, the lung V 5_VBA highly correlated with the V 5_RTP, demonstrating the effectiveness of
the VBA to predict the lung V 5 at 15 different θA from 80° to 360°.
Yin et al.5 demonstrated that when the mean lung V5 was higher than 80%, lung radiotoxicity might increase.
Moreover, Wang et al.13 demonstrated that more lung volume can be protected by preventing it from receiv-
ing radiation doses of more than 5 Gy. The mean lung dose and V5 were highly related to the risk of radiation
pneumonitis, i.e., 3% and 38% within 1 year for V5 < 42% and V5 > 42% respectively. In summary, the incidence
of radiation pneumonitis was positively correlated with the mean lung dose, V 20, V10, and V
5. It is important to
reduce the low dose distribution volume, to reduce the risk of complications. Song et al.14 analysed the correlation
between lung dose and the level of lung inflammation in patients with lung cancer receiving HT. They suggested
that the V 5 in the other lung should be maintained at < 60% to reduce the risk of radiation pneumonitis. Pin-
nix et al.11 noted that a lung V5 exceeding 55% was associated with the maximum likelihood ratio for radiation
pneumonitis. Thus, lung V 5 was a crucial predictor of radiation pneumonitis. The algorithm developed in this
study can be used to efficiently calculate the gantry arc angle to determine the optimal lung V5.
Scientific Reports | (2021) 11:4360 | https://doi.org/10.1038/s41598-021-83682-3 6
Vol:.(1234567890)www.nature.com/scientificreports/
Figure 7. Pearson correlation coefficient between the lung V
5_VBA and the (A) lung V5; (B) lung V20; (C)
mean lung dose; (D) mean heart dose in the treatment plans.
The advancement of radiotherapy treatment plans not only provided personalised management for each
patient but also increased patient survival rates. However, treatment plan development was time-consuming
and labour-intensive, since radiation oncologists and medical physicists must devise treatment plans with great
caution to reduce damage to vital nerves, tissues and organs on the patients. Lin et al.15 indicated that it took
an average of 3.8 h to manually complete a treatment plan with a full arc. However, many companies have
developed various automatic treatment planning systems, such as the Pinnacle Auto-Planning and RapidPlan
Knowledge-Based Planning software with the use of machine learning methods. Hansen et al.16 suggested that
the average time required for the automated treatment planning system was 135 min plus about 20 min for the
manual operation, i.e., a total of 155 min. More recently, Krayenbuehl et al.17 compared five automatic treatment
planning systems, four of which completed RTP within 20 min. The calculation-intensive part of the automatic
treatment planning system was the optimizing process. The PTV and all the normal tissues must first be selected,
and the arc angle must be set before using the automatic treatment plan system to generated RTP of VMAT.
Nevertheless, with our proposed algorithm, as soon as the length of the PTV was defined, the optimal arc angle
corresponding to the expected lung V 5 < 55% could be rapidly calculated within 5 min in the optimizing process
of VMAT and HT.
Lauche et al.18 stated that both VMAT and HT provided treatment plans with high tumor comformality and
could maintain dose deliverd to normal organ within constraints. Nevertheless, the algorithm developed in this
study could be applied to both VMAT and HT to predict the lung V5 and calculate the corresponding gantry arc
angles. In the VMAT treatment planning system, the optimal gantry arc angle would be defined before optimisa-
tion. If the VBA was applied to a HT treatment planning system, a complete block would be set in the lungs, and
the θRES would be set to 360° − θA to control the radiation angle. When applied to the calculation of both VMAT
and HT treatment planning system, the VBA effectively controled the lung V5.
Our study had some limitations. In clinical applications of VBA, variations such as the larger tumor length
and extensive lymph nodes should also be considered. When the radiated field was too large to reach the expected
lung V5, operators could follow as low as reasonably achievable (ALARA) principle and limit the radiation dose
manually in the treatment plan. Furthermore, our phantom study simulated different θA in RTP (Table 2). In
our study, the differences between the lung V 5_VBA and lung V 5_RTP were from 0.09 to 4.08%, which needed
Scientific Reports | (2021) 11:4360 | https://doi.org/10.1038/s41598-021-83682-3 7
Vol.:(0123456789)www.nature.com/scientificreports/
to be considered. However, the desired lung V 5 could be achieved by dose constraints during the optimization.
The doses of spinal cord were relatively higher than clinical practices which the constraint should be manu-
ally limited to < 45 Gy. The dose to heart increased as restricted angle increased. The doses of heart were also
relatively higher than clinical practices in θA from 80° to 220°. Therefore, the dose to heart would be further
manually limited by the operator. The constraints of mean heart dose and heart V30 should be set < 26 Gy and
45%. In our study, as θA decreases from 220° to 80°, the CI increased from 1.15 to 1.34 in HT. Our previous study
also showed conformity became worse with more limitation of beam angle in H T10, which was similar with the
present study. Therefore, further optimization would be needed to meet the constraints with limited θA. Besides,
we only simulated the dose distribution in esophageal cancer. The position of the esophagus is in the middle
relative to other organs. The tumor of other organs needed to be verified further. More variables affecting lung
volumes including organ motions and setup errors may exist in patients. The thorax anatomy of patients is not
entirely symmetrical. The left and right lungs have different volumes. In Eq. (2) of our VBA, θRESL + θRESR = θRES,
could be fit for clinical application. The restricted angles on both sides of lungs could be unequal, however, the
sum of the restricted angles on both sides (θRES) would still be 360 − θA (Eq. 1). Our study was a preclinical study,
which mainly used phantom images to establish the algorithm and verify the feasibility of the algorithm. Clini-
cal retrospective cases study using this VBA algorithm is ongoing. Further clinical studies are needed to clarify
these propositions in patients.
Conclusion
This study successfully developed a VBA that can rapidly calculate the gantry arc angle to predict the lung V 5.
The operators can rapidly obtain the expected lung V
5 with 20 iterations within 5 min. The developed algorithm
can improve the efficiency of conventional radiotherapy planning.
Received: 17 November 2020; Accepted: 5 February 2021
References
1. Hsu, F. M. et al. Association of clinical and dosimetric factors with postoperative pulmonary complications in esophageal cancer
patients receiving intensity-modulated radiation therapy and concurrent chemotherapy followed by thoracic esophagectomy. Ann
Surg Oncol 16, 1669–1677 (2009).
2. Lee, H. K. et al. Postoperative pulmonary complications after preoperative chemoradiation for esophageal carcinoma: correlation
with pulmonary dose-volume histogram parameters. Int J Radiat Oncol Biol Phys 57, 1317–1322 (2003).
3. Gensheimer, M. F. et al. Influence of planning time and treatment complexity on radiation therapy errors. Pract Radiat Oncol 6,
187–193 (2016).
4. Schallenkamp, J. M., Miller, R. C., Brinkmann, D. H., Foote, T. & Garces, Y. I. Incidence of radiation pneumonitis after thoracic
irradiation: dose-volume correlates. Int J Radiat Oncol Biol Phys 67, 410–416 (2007).
5. Yin, L. et al. Volumetric-modulated arc therapy vs c-IMRT in esophageal cancer: a treatment planning comparison. World J Gas-
troenterol 18, 5266–5275 (2012).
6. Citrin, D. E. Recent developments in radiotherapy. N Engl J Med 377, 1065–1075 (2017).
7. Teoh, M., Clark, C. H., Wood, K., Whitaker, S. & Nisbet, A. Volumetric modulated arc therapy: a review of current literature and
clinical use in practice. Br J Radiol 84, 967–996 (2011).
8. Liu, X. et al. Dosimetric comparison of helical tomotherapy, VMAT, fixed-field IMRT and 3D-conformal radiotherapy for stage
I-II nasal natural killer T-cell lymphoma. Radiat Oncol 12, 76 (2017).
9. Marks, L. B. et al. Radiation dose-volume effects in the lung. Int J Radiat Oncol Biol Phys 76, S70–S76 (2010).
10. Chang, C. H. et al. Fan-shaped complete block on helical tomotherapy for esophageal cancer: a phantom study. Biomed Res Int
2015, 959504 (2015).
11. Pinnix, C. C. et al. Predictors of radiation pneumonitis in patients receiving intensity modulated radiation therapy for Hodgkin
and non-Hodgkin lymphoma. Int J Radiat Oncol Biol Phys 92, 175–182 (2015).
12. Feuvret, L., Noël, G., Mazeron, J.-J. & Bey, P. Conformity index: a review. Int. J. Radiat. Oncol. Biol. Phys. 64, 333–342 (2006).
13. Wang, S. et al. Analysis of clinical and dosimetric factors associated with treatment-related pneumonitis (TRP) in patients with
non-small-cell lung cancer (NSCLC) treated with concurrent chemotherapy and three-dimensional conformal radiotherapy (3D-
CRT). Int J Radiat Oncol Biol Phys 66, 1399–1407 (2006).
14. Song, C. H. et al. Treatment-related pneumonitis and acute esophagitis in non-small-cell lung cancer patients treated with chemo-
therapy and helical tomotherapy. Int J Radiat Oncol Biol Phys 78, 651–658 (2010).
15. Lin, C. Y. et al. Dosimetric and efficiency comparison of high-dose radiotherapy for esophageal cancer: volumetric modulated arc
therapy versus fixed-field intensity-modulated radiotherapy. Dis Esophagus 27, 585–590 (2014).
16. Hansen, C. R. et al. Automatic treatment planning facilitates fast generation of high-quality treatment plans for esophageal cancer.
Acta Oncol 56, 1495–1500 (2017).
17. Krayenbuehl, J. et al. Planning comparison of five automated treatment planning solutions for locally advanced head and neck
cancer. Radiat Oncol 13, 170 (2018).
18. Lauche, O. et al. Helical tomotherapy and volumetric modulated arc therapy: new therapeutic arms in the breast cancer radio-
therapy. World J Radiol 8, 735–742 (2016).
Acknowledgements
This work was partly supported by Ministry of Science and Technology, Taiwan (#MOST 108-2314-B-010 -018
and #MOST 109-2314-B-010 -023 -MY3), and National Yang Ming Chiao Tung University Far Eastern Memorial
Hospital Joint Research Program (#NYCU-FEMH 106DN02).
Author contributions
T.H. Wu and C.X. Hsu conceived and designed the research; C.H. Chang, H.J. Tien and S.Y. Wang performed
the experiments; P.W. Shueng and T.H. Wu analyzed the data; K.H. Lin, C.X. Hsu and wrote the procedure and
prepared figures; K.H. Lin, C.X. Hsu and G.S.P. Mok wrote the main manuscript text. All authors approved the
final manuscript.
Scientific Reports | (2021) 11:4360 | https://doi.org/10.1038/s41598-021-83682-3 8
Vol:.(1234567890)www.nature.com/scientificreports/
Competing interests
The authors declare no competing interests.
Additional information
Correspondence and requests for materials should be addressed to P.-W.S. or T.-H.W.
Reprints and permissions information is available at www.nature.com/reprints.
Publisher’s note Springer Nature remains neutral with regard to jurisdictional claims in published maps and
institutional affiliations.
Open Access This article is licensed under a Creative Commons Attribution 4.0 International
License, which permits use, sharing, adaptation, distribution and reproduction in any medium or
format, as long as you give appropriate credit to the original author(s) and the source, provide a link to the
Creative Commons licence, and indicate if changes were made. The images or other third party material in this
article are included in the article’s Creative Commons licence, unless indicated otherwise in a credit line to the
material. If material is not included in the article’s Creative Commons licence and your intended use is not
permitted by statutory regulation or exceeds the permitted use, you will need to obtain permission directly from
the copyright holder. To view a copy of this licence, visit http://creativecommons.org/licenses/by/4.0/.
© The Author(s) 2021
Scientific Reports | (2021) 11:4360 | https://doi.org/10.1038/s41598-021-83682-3 9
Vol.:(0123456789)You can also read