Vortex - LES Validation AUSTRALIA - High resolution topography dataset 11 days radar mission International project carried out by NGA & NASA ...
←
→
Page content transcription
If your browser does not render page correctly, please read the page content below
High resolution topography dataset
11 days radar mission
International project carried out
by NGA & NASA

                           Vortex - LES
                        Validation AUSTRALIA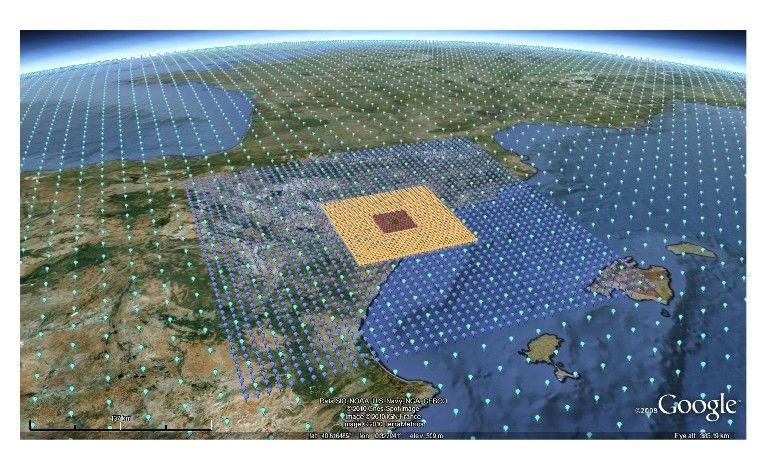
Vortex-LES ERA5 Validation
Australia
                              March 2018
info@vortexfdc.com

VORTEX FdC S.L.
Parc Tecnològic Barcelona
Carrer Marie Curie 8-14
08042 Barcelona (Spain)
Tel. +34 933 285 868

www.vortexfdc.com           Vortex FdC, 2018 ©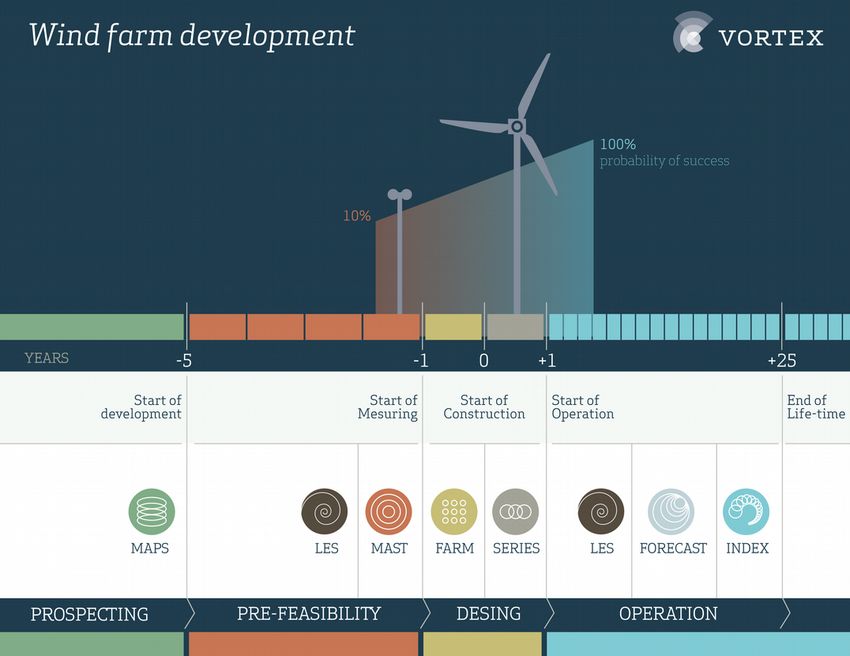
Index

    Mean Wind Speed map: AUSTRALIA (ERA5) ………………     4
    VORTEX system technical description ………………………    5
    Vortex-LES technical specifications …………………………   7
         Applications ……………………………………………              8
    Vortex-LES validation AUSTRALIA
         Methodology ……………………………………………               9
         Results        ……………………………………………            9
         Uncertainty    ……………………………………………            10
    Vortex-LES validation: Conclusions …………………………    11

    APPENDIX
        Turbulence Intensity …………………………………… 12

www.vortexfdc.com                            Vortex FdC, 2018 ©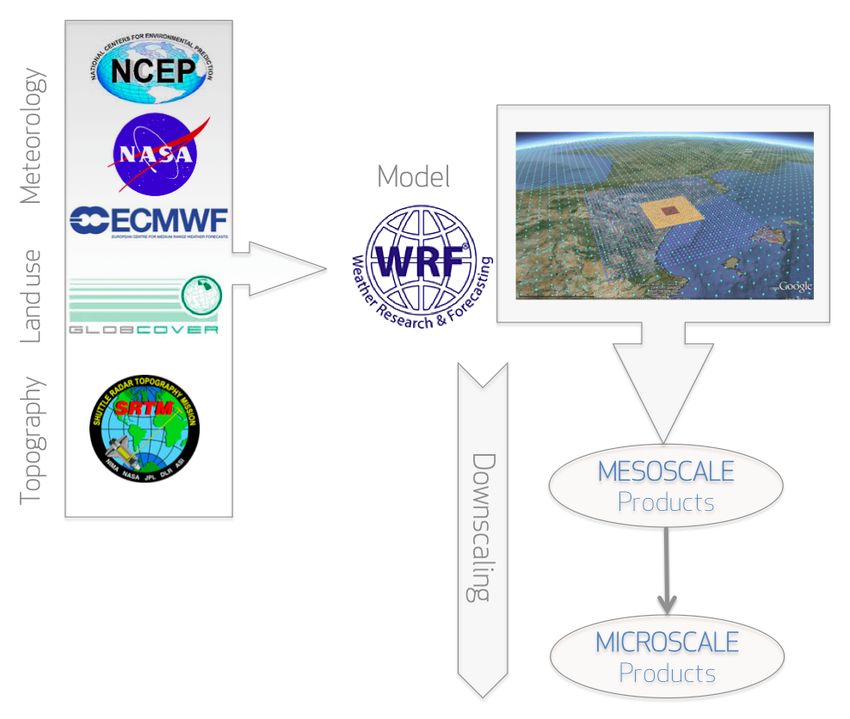
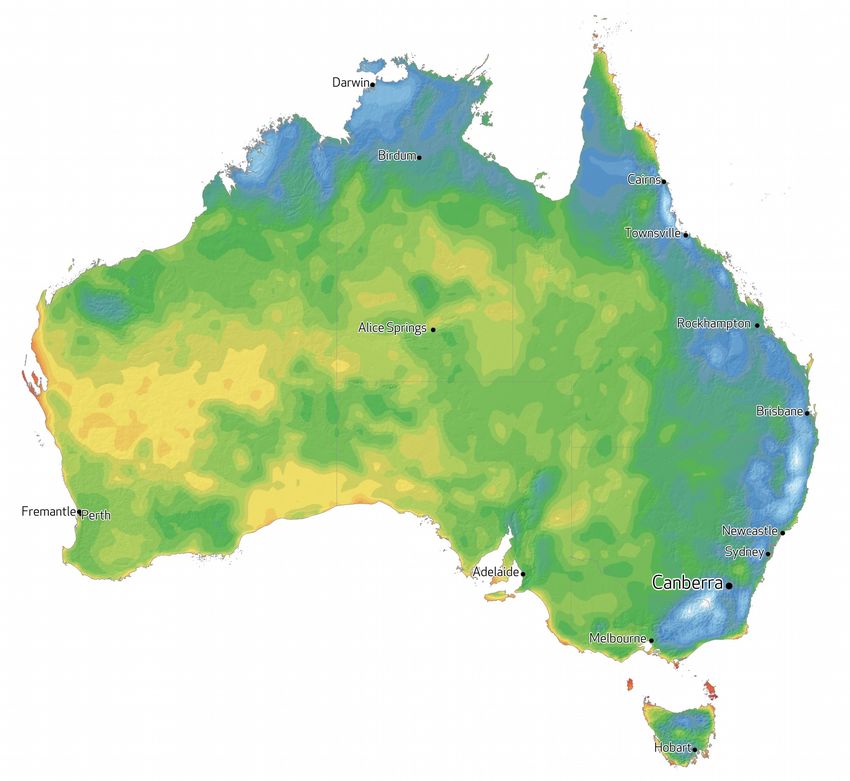
Mean Wind Speed map: AUSTRALIA

    Data source ERA5 at 0.25º x 0.25º resolution.
    Long-term averaged period 2010 – 2017.
    Mean wind speed at 100m height.

www.vortexfdc.com                                   Vortex FdC, 2018 ©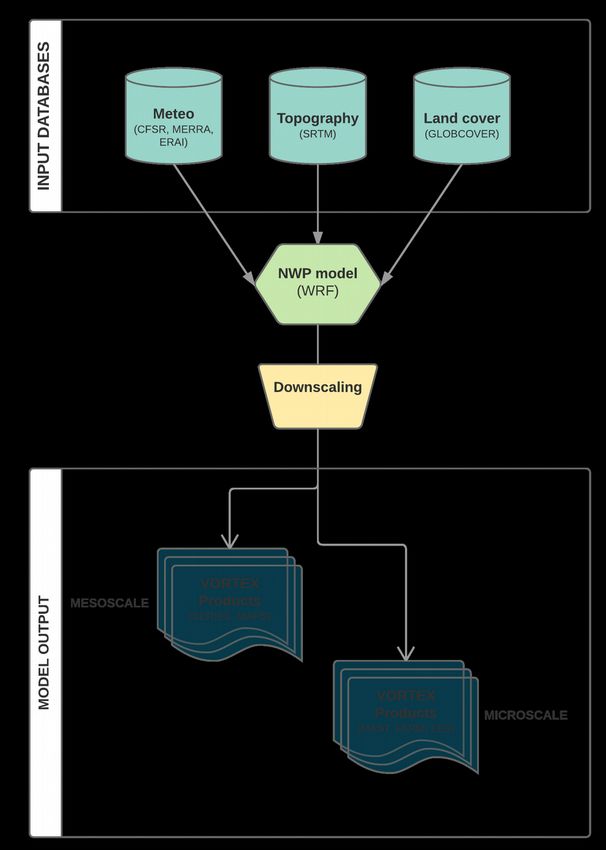
VORTEX system technical description

                                                                  Vortex FdC has based their modeling expertise
                                                                  in the optimized and automated use of WRF for
                                                                  wind industry applications. The experience
                                                                  gained guarantees a stable and robust model
                                                                  configuration which has been tested and
                                                                  verified by Vortex.

                                                                  The high-resolution numerical modeling of
                                                                  weather conditions provides today sensitive
                                                                  information of unprecedented quality crucial
                                                                  for the development of any wind project, from
                                                                  the early stages of prospection to the wind farm
  Figure 1: Vortex products at each wind-farm development phase   design and long-term adjustments.

Mesoscale modeling technology is employed by
Vortex to obtain global wind climate at different
resolution and with customized specification to
provide    high     quality   wind     resources
information to support project development at
each stage.

The mesoscale model Weather & Research
Forecast     Model,     WRF,     developed      at
NCAR/NCEP, is employed as Vortex mesoscale
modeling core. WRF model has a long record on
usage and it is employed operational in many
weather services, cutting-the-edge research
activities and different industry applications.

                                                                              Figure 2: Vortex system flowchart

 www.vortexfdc.com                                                                                Vortex FdC, 2018 ©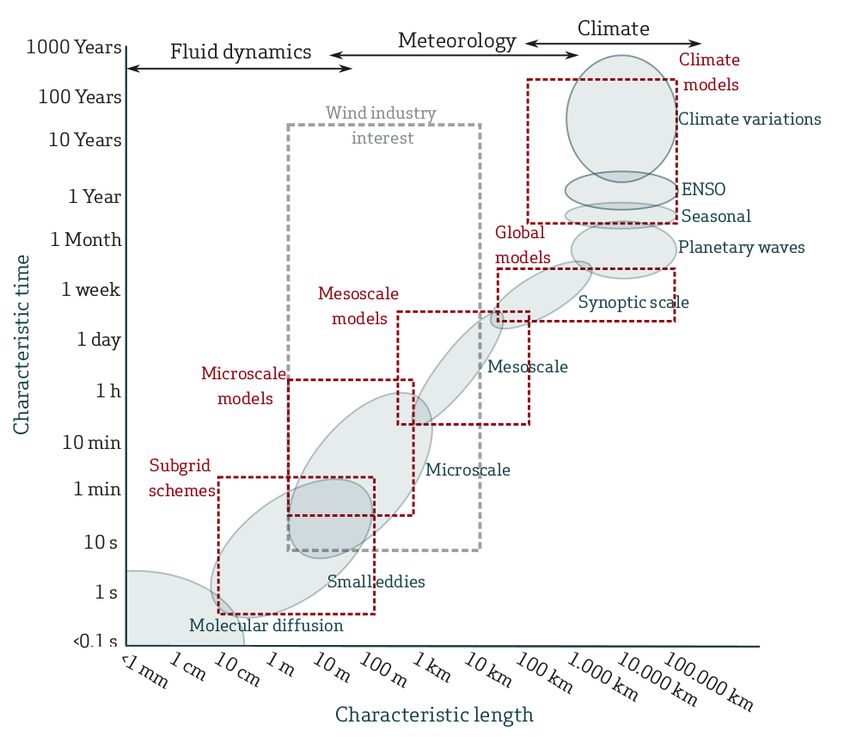
VORTEX system technical description

In particular, usage of mesoscale modeled            (NASA), CFS/CFSR (NCEP), ERA-Interim and
downscaled products driven by global                 now ERA5 (ECMWF).
Reanalysis databases gained a considerable
acceptance among the wind industry
community as reliable reference long-term
data and resource screening assessment.
Mesoscale downscaled products provide
realistic localization of the wind regimes and
the topography controlled variables which
allows more accurate site impact assessment
and climate representation.

                                                                     Figure 4 Downscaling ilustration

                                                     An advanced assimilation technology is
                                                     employed to homogenize all the input
                                                     observations in space and time. Finally, a global
                                                     climate model, driven by the homogenized
                                                     input data, is used to produce higher resolution
                                                     products containing a large range of
                                                     meteorological/oceanic variables.

                                                                                           ERA5
        Figure 3: Schematic Vortex modeling system                                   1979 – present
                                                         Period
                                                                                   (actual from 2010)
                                                         Spatial         31 km globally, 137 levels to 0.01
Reanalysis data are a combo of multi-sourced
                                                       resolution                      hPa
conventional observations (synoptic stations,
                                                                          From a 10-member Ensemble of
balloons/sounding devices, buoys, tracks) and          Uncertainty
                                                                          Data Assimilation (EDA) at 63 km
                                                        estimates
remote sensing covering a period from 1979 to                                       resolution
the present day. A new generation of reanalysis          Output         Hourly analysis and forecast fields,
products enhanced through major efforts in             frequency                3-hourly for EDA
climate data assimilation and modeling has            Table 1: Some features for ECMWF reanalysis ERA5 on 2018. From
                                                                       ECMWF Newsletter 147, pag. 7.
been released in recent years.

These reanalysis databases are: MERRA-2

 www.vortexfdc.com                                                                      Vortex FdC, 2018 ©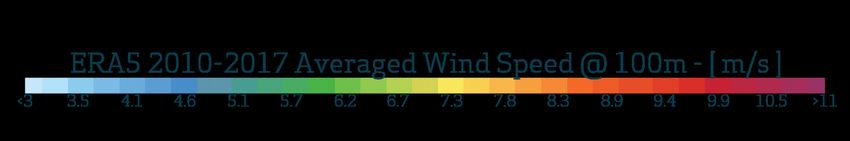
Vortex-LES Technical specifications

Vortex-LES products has been designed based           gust and wind-speed standard deviation.
on the following technical specifications:
                                                      Input data:
Model effective Resolution:                           Topography data was prescribed by the NASA
Vortex-LES downscale climate wind conditions          Shuttle Radar Topography Mission (SRTM)
up to 100m horizontal with levels from 50m to         which provides the most complete high-
150m. Downscaling is made in a nesting down           resolution digital topographic database of
procedure where atmospheric flows are refined         Earth.
with enhanced physics options adequate to             Land cover data was derived from ESA
each scale and to allow complete surface effects      GlobCover Land Cover1 product, using an
and turbulence on the flow regime                     automatic and regionally-tuned classification
characterization;                                     of a time series of MERIS FR mosaics. Its 22
                                                      land cover global classes are defined with the
Physics:                                              UN Land Cover Classification System (LCCS).
The mesoscale model include a full physics
package to describe mechanical and thermal            Large scale meteorological drivers are
drivers of wind regime turbulence and speed-          prescribed by ECMWF latest generation of
up effects affecting the flow. Physics and            Reanalysis product: ERA5 which spans from
dynamics specification are based on operation         2010 to 2017.
VORTEX WRF set-up, which benefits of gained
experience and cumulated validation exercises         The ERA5 reanalysis was designed and
and feedback from different VORTEX products           executed as a global, high resolution, coupled
users. Large Eddy Simulation (LES) is                 atmosphere-ocean-land surface-sea ice system
employed in the most inner domain to allow            to provide the best estimate of the state of
enhanced turbulence and high resolution               atmosphere, land and ocean variables. ERA5
terrain induced flow adjustments modelling.           global spatial resolution is 0.25x0.25 deg. with
                                                      137 levels extending from the surface to 0.01
Turbulence:                                           hPa and hourly output. (Table 1)
Mesoscale model is configured to output
standard deviation at 10’ sampling to
effectively    derive     turbulence     intensity.
Mesoscale model at final 100m nest is
configured to use LES model that takes into
account explicit computation of turbulence with
time steps of ~4Hz., allowing realistic estimation
of site assessment wind flow regime, 3-second

 www.vortexfdc.com                                                              Vortex FdC, 2018 ©
Vortex-LES Technical specifications: Applications
LES was embedded into our mesoscale
modeling flag engine, WRF, to replace current
parametrization of the boundary layer by a
turbulence explicit resolving approach, which
included in-house advances in the high
resolution modelization of wind flow and wind
conditions at windfarm-scale. The outcome of
this development is our new SERIES product
stream named LES which provides turbulence
enable 10-minutes sampling time series of wind
conditions with a spatial resolution of ~100m
and time lapse of 4Hz (4 times every second the
wind speeds are computed like a first-class
Figure 5: Modeling strategies used for each meteorological scale.
measuring device). Including 3-second gust and
Mesoscale and Microscale models are the common tools in wind wind-speed standard deviation for Turbulence
resources assessment. (by Alex Montornès)
Intensity (TI) calculation.
VORTEX main technical development over last
Here we list some application and usage
couple of years was focused in the
scenarios for Vortex-LES time series:
implementation of an operational service that
provides time-evolving representation of
• Safer wind site classification
turbulence and wind conditions across the
• Full time evolving representation of
windfarm extension through a seamless
wind conditions
multiscale modeling stream, and which
◦ Day and night discrimination
improves current products accuracy.
◦ Cross related variables like TI vs
Shear.
This development was centred in porting Large ◦ Extreme ramps occurrence
Eddy Simulation (LES) technology towards • Fill the gaps in your data
real terrain and real atmospheric conditions, • Ready for One turbine projects
bringing the gap from ideal test case and • Tall tower project. Vertical Profile
industry applications. VORTEX final target was Information
to produce anywhere-anytime mesoscale • Enabling direct Power time series
simulation using LES at the high resolution nest modeling. Mapping outer and inner
with delivery times compliant with project range power curve
analyst timings. • Spatial Variation of Wind Conditions
www.vortexfdc.com Vortex FdC, 2018 ©Vortex-LES Validation AUSTRALIA: Methodology
Methodology • R², the square of the Pearson correlation
The present document describes a validation coefficient, as a first raw indicator of
exercise of Vortex-LES , where estimations of climate representativeness. This metric
wind speed have been compared against real- represents the percentage of linear
world measurements. share variance between observed and
modeled time series, or in other words,
The validation exercise has been focused in how much site variability can be
validating Vortex-LES generated with the last explained (inferred) by the modeled
new reanalysis ERA5. products. High correlation values
18 reliable wind datasets from different areas indicate better pattern similarity.
of Australia have been used to cross-check
wind speed estimates by Vortex-LES, where
Results
measurements have been taken at different
heights and site features. Values of mean correlation R-square are shown
in the following table:
Following statistic metrics have been
calculated to validate wind speed data R² hourly daily monthly
delivered by Vortex-LES : Site 1 0,65 0,81 0,85
Site 2 0,70 0,84 0,72
• Mean standard error or BIAS for mean Site 3 0,79 0,92 0,64
Site 4 0,77 0,91 0,88
wind speed, where n is the available Site 5 0,71 0,87 0,96
estimations (E) and observations(O), in %: Site 6 0,75 0,90 0,85
Site 7 0,80 0,93 0,93
1
n
( Ei −Oi) Site 8 0,63 0,85 0,95
Mean Bias= ∑
n i=1 Oi
· 100 Site 9 0,63 0,86 0,95
Site 10 0,51 0,64 0,69
Site 11 0,65 0,81 0,80
Site 12 0,62 0,83 0,82
Site 13 0,83 0,92 0,92
• Root-Mean-Square Error (RMSE) for Site 14 0,58 0,82 0,95
mean wind speed where n is the Site 15 0,75 0,92 0,97
Site 16 0,66 0,81 0,89
available estimations (E) – observations
Site 17 0,61 0,82 0,81
(O), in m/s (hourly averaged). Site 18 0,72 0,92 0,84
AVERAGE 0,69 0,85 0,86
√
n
1
RMSE= ∑ ( Ei −Oi)2
n i =1 Table 2: R-square correlation for each site and average
hourly, daily and monthly. Sites from Victoria (6), New
South Wales (3), Tasmania (2), South Australia (5),
Western Australia (1) and Queensland (1).
• Weibull parameters error (%).
www.vortexfdc.com Vortex FdC, 2018 ©Vortex-LES Validation AUSTRALIA: Uncertainty
Uncertainty
BIAS(%) RMSE (m/s) K-error (%) MAE (%) In order to estimate the uncertainty of the
Average 0,33 2,09 -6,37 6,24 Vortex-LES, the standard deviation of mean
SD 7,18 0,42 7,10 3,22 bias has been analysed based on different
Table 3: Mean values for BIAS, RMSE (hourly calculated), speed ranges.
k-Weibull bias and MAE.
If a normal distribution of biases is assumed,
uncertainty may be evaluated by applying
BIAS(%) RMSE (m/s) K-error (%) confidence intervals in order to estimate its
Site 1 9,80 2,14 -14,10 probabilistic nature. 68% probability of
Site 2 -5,40 2,03 -15,30 occurrence is determined by one standard
Site 3 -1,10 1,82 5,70
deviation.
Site 4 3,30 1,74 2,50
Site 5 10,70 1,97 -10,50
Site 6 -6,50 1,76 -9,20
Site 7 -2,60 1,86 2,20
Site 8 9,04 2,11 -10,30
Site 9 5,78 1,89 -9,23
Site 10 3,21 2,35 -20,68
Site 11 -9,16 3,49 -6,38
Site 12 8,68 2,41 -5,54
Site 13 -6,69 1,76 -0,62 Figure 6: Normal distribution curve.
Site 14 8,68 2,22 -11,30
Site 15 -0,84 1,85 2,61 The uncertainty of modeled time series is site-
Site 16 -6,51 2,11 -7,00 dependent, which means that application of
Site 17 -10,81 2,45 -6,30
global threshold values is of limited use.
Site 18 -3,55 1,74 -1,23
Nonetheless, continuous validation exercises,
Table 4: Values for BIAS, RMSE (hourly calculated) and such as the one presented herein, provides
k-Weibull bias. Sites from Victoria (6), New South
round robin estimates of mean bias. Standard
Wales (3), Tasmania (2), South Australia (5), Western
deviation values, as shown in Table 3, can be
Australia (1) and Queensland (1).
used as ‘preliminary’ reference for uncertainty
analysis.
Thus, after analysing the difference between
the mean observed and the estimated wind-
speed for a given period, we can conclude that
the uncertainty of the Vortex-LES is:
( 0,33 ± 7,18 ) %
www.vortexfdc.com Vortex FdC, 2018 ©Vortex-LES Validation AUSTRALIA: Conclusions
The performance of Vortex-LES has been After analysing 18 sites across Australia, it can
considered in this exercise. These 10 minutes be concluded that in terms of estimation of
time series have been run using ERA5 mean wind speed, it has been observed that
reanalysis source at 18 locations throughout Vortex-LES are more suitable for obtaining the
Australia, where wind speed measurements mean wind-speed and other micro-scale
were available at different heights and for an variables.
specific period of time (at least one full year).
In order to calculate the uncertainty of the time
Modeled and measured wind speeds were
series, we have assumed an approximately
compared for the same period and height. The
normal bias distribution across the set of sites.
statistics metrics used are those most common
Therefore, we conclude that the standard
in the industry to determine the accuracy of
deviation of the mean bias provides an
estimates: correlation coefficient (R²), mean
approximation of the uncertainty associated
bias, RMSE and MAE.
with Vortex-LES. For typically windy potential
Wind-speed correlation coefficients on an sites the uncertainty associated with Vortex
hourly, daily and monthly basis have been LES lies around 7%.
calculated, and results show an average daily
correlation coefficient of 0.85 . Other metrics
analyzed result in values of 6.24% for MAE
and around +0.33% for the mean bias.
Figure 7: Example of Vortex-LES output for two weeks at 80m above the ground. Measured
values are represented in light green solid line, Vortex mesoscale product at 3 km is shown
in red solid line and Vortex-LES in dark green solid line. (by Alex Montornès)
www.vortexfdc.com Vortex FdC, 2018 ©You can also read