WANING OF IGG, TOTAL AND NEUTRALIZING ANTIBODIES 6 MONTHS POST-VACCINATION WITH BNT162B2 IN HEALTHCARE WORKERS
←
→
Page content transcription
If your browser does not render page correctly, please read the page content below
Waning of IgG, total and neutralizing antibodies 6
months post-vaccination with BNT162b2 in
healthcare workers
Jean-Louis Bayart
Department of Laboratory Medicine, Clinique St-Pierre, Ottignies, Belgium
Jonathan Douxfils ( jonathan.douxfils@unamur.be )
University of Namur https://orcid.org/0000-0002-7644-5298
Constant Gillot
Department of Pharmacy, Namur Research Institute for LIfe Sciences, University of Namur, Belgium
Clara David
QUALIblood
François Mullier
Department of Laboratory Medicine, Université catholique de Louvain, CHU UCL Namur, Yvoir, Namur,
Belgium
Marc Elsen
Department of Laboratory Medicine, Clinique St-Luc Bouge, Namur, Belgium
Christine Eucher
Department of Laboratory Medicine, Clinique St-Luc Bouge, Namur, Belgium
Sandrine Van Eeckhoudt
Department of Internal Medicine, Clinique St-Luc Bouge, Namur, Belgium.
Tatiana Roy
Department of Laboratory Medicine, Clinique St-Pierre, Ottignies, Belgium
Vincent Gerin
Department of Laboratory Medicine, Clinique St-Pierre, Ottignies, Belgium
Grégoire Wieers
Department of Internal Medicine, Clinique St-Pierre, Ottignies, Belgium
Christine Laurent
Department of Internal Medicine, Université catholique de Louvain, CHU UCL Namur, Yvoir, Namur,
Belgium
Mélanie Closset
Department of Laboratory Medicine, Université catholique de Louvain, CHU UCL Namur, Yvoir, Namur,
Belgium
Jean-Michel Dogné
2Department of Pharmacy, Namur Research Institute for LIfe Sciences, University of Namur, Belgiu
Page 1/19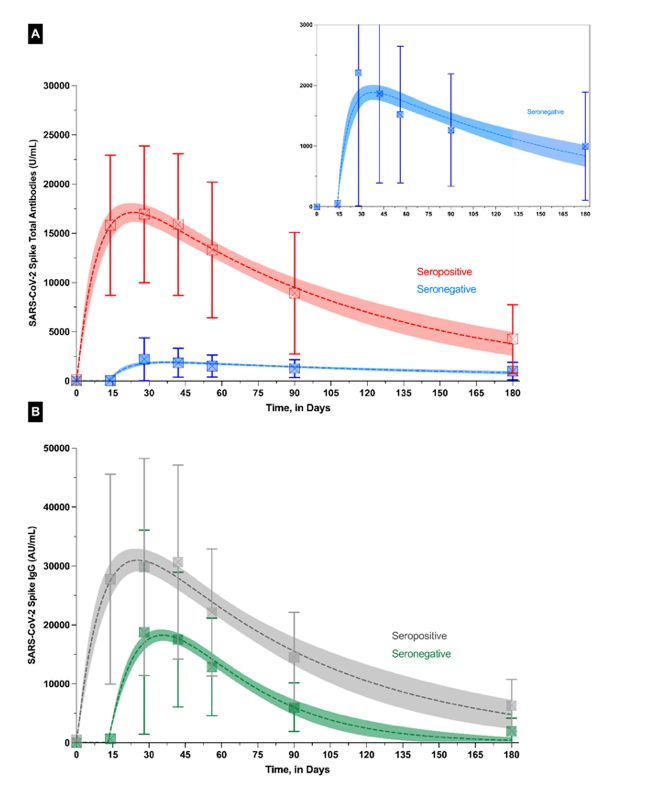
Julien Favresse
Department of Laboratory Medicine, Clinique St-Luc Bouge, Namur, Belgium
Article
Keywords: COVID-19, SARS-CoV-2, mRNA vaccine, BNT162b2, antibody response
DOI: https://doi.org/10.21203/rs.3.rs-862966/v1
License: This work is licensed under a Creative Commons Attribution 4.0 International License.
Read Full License
Page 2/19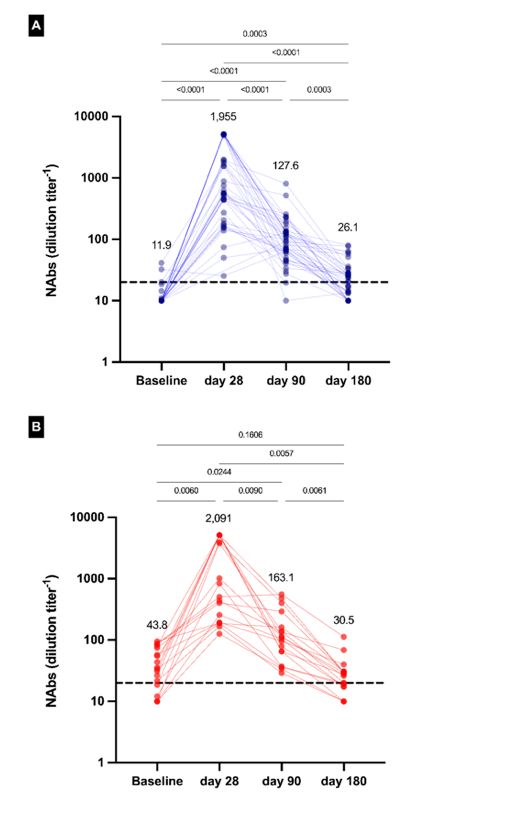
Abstract
Data about the duration of humoral response following COVID-19 vaccines are mandatory to establish
appropriate population vaccination strategy. This study reports on the antibody decline observed in a
population of COVID-19 naïve and COVID-19 positive individuals having received the two dose regimen of
the BNT162b2 vaccine. Six months after vaccination, a significant antibody decline was observed in both
COVID-19 naïve and positive individuals. The estimated half-life of total and IgG antibodies differs and
ranges from several months for total antibodies to only several weeks for IgG antibodies, explaining the
significant proportions of participants with non-detectable levels of neutralizing antibodies at 6 months.
Whether this decrease correlates with an equivalent drop in the clinical effectiveness against the virus will
require appropriate clinical studies. Nevertheless, these data are already important to support the
decision-making on the potential use of a booster dose.

Introduction
The efficacy and safety of the two-dose regimen of BNT162b2 mRNA COVID-19 vaccine (Pfizer-BioNTech,
Mainz, Germany) has been proved and led to an emergency use authorization (EUA) delivered on the 11th
of December 2020.1 On the 23th of August 2021, the BNT162b2 vaccine became the first COVID-19
vaccine approved by the U.S. Food and Drug Administration (FDA).2 Real-world data on the BNT162b2
also confirmed the high effectiveness of this vaccine in reducing laboratory-confirmed infection and viral
load in infected individuals, as well as reducing COVID-19 hospitalization and death. 3–7

Around the world, massive vaccination campaigns started in early 2021 and data about the
immunological response emerged in the literature to document the evolution of humoral response in
subjects vaccinated against SARS-CoV-2.8–15 In the majority of seronegative subjects, antibody response
was positive two weeks after the first dose and the peak response was observed around 28 days.13,16 The
antibody titers were also higher in previously infected individuals compared to seronegative subjects and
recent studies found a decline in antibody titers at 3 months.13,17−19 This antibody decline needs to be
well-monitored because it may provide important information to support the decision-making on the
potential use of a booster dose. However, longer-term kinetic data of the humoral response after the two-
dose regimen of BNT162b2 are still scarce in the literature.

The CRO-VAX-HCP study is an ongoing multicenter, prospective and interventional study designed to
assess the antibody response in a population of healthcare professionnals (HCPs) having received two
doses of the BNT162b2 mRNA COVID-19 vaccine. We report hereby an interim analysis on the data
obtained on the humoral response after a 6-month follow-up.

Material And Methods
Study design and participants
                                                  Page 3/19
The CRO-VAX HCP study is an ongoing multicenter, prospective and interventional study designed to
assess the antibody response in a population of HCPs having received two doses of the BNT162b2
mRNA COVID-19 vaccine (Comirnaty®), as described in Supplementary Table 1. The study was approved
by a central ethical committee (approval number: 2020-006149-21) and a total of 231 participants were
enrolled in the study. All participants provided informed consent prior to data and specimen collections.
Participants received the first vaccine dose from January 18, 2021, to February 17, 2021. The second
dose was administered 21 days after the first one. All volunteers underwent a blood drawn within 2 days
before the first vaccine dose. Samples were then collected after 14, 28, 42, 56, 90 and 180 days following
the first dose. Blood samplings performed earlier or later than the expected blood collection times were
allowed with a maximal allowed percentage of 10% (i.e. 180 days ± 18 days). Subjects having levels of
anti-NCP and anti-S antibodies at baseline above the positivity cut-offs of the assays were considered
seropositive while the others are considered COVID-19 naïve and are classified as seronegative.
Analytical procedures
Antibodies against the receptor binding domain (RBD) of the S1 subunit of the spike protein were
measured at each time point by two different analytical methods: the Elecsys® assay that measured
SARS-CoV-2 total antibodies (combination of IgG, IgM and IgA) (Roche Diagnostics, Machelen, Belgium)
with a positivity cut-off of 0.8 U/mL and the Architect® assay that measured SARS-CoV-2 IgG (Abbott,
Wavre, Belgium) with a positivity cut-off of 50 arbitrary unit (AU)/mL. Total antibodies against the SARS-
CoV-2 nucleocapsid (anti-NCP; Roche Diagnostics, Machelen, Belgium) were also measured. Results
above 0.165 COI (cut-off index; as reported previously)20 were considered positive. For the total antibody
assay, alternative cut-offs (i.e. 15 U/mL and 133 U/mL)21,22 were also investigated.
Neutralizing antibodies (NAbs) were assessed on a subset of 60 subjects at different timepoints (0, 28, 90
and 180 days) using a pseudo-virus neutralization tests (pVNT) as described elsewhere.23,24 For this
latter assay, samples were considered negative if the half maximal inhibitory concentration (IC50) value
were below the dilution of 1/20.
Statistical analysis
Means and 95% confidence intervals (95% CI) were used for data description. The between group
differences of antibody titers were tested using a Tukey multiple comparison test. A multiple testing
correction was applied in the multiple group comparison. For kinetic modelisation, a one-compartment
modeling was used to describe the kinetics of the antibody response in seropositive and seronegative
subjects, assuming a steady decay rate over time. The half-life was obtained from the one-compartment
modeling which permitted the calculation of the elimination rate of the antibodies. The mean time needed
to cross the various thresholds of interest defined above was also determined based on this model.
Correlation studies (IgG, total antibodies and NAbs) were evaluated with a Spearman’s rank correlation
test. A Cohen’s kappa agreement test was also performed between assays. Statistical analyses were
performed using GraphPad Prism 9.0.1 (GraphPad Software, San Diego, California USA,
Page 4/19www.graphpad.com) and JMP Pro 16.0.0 (SAS Institute Inc., South Carolina, United States). P-value <
0.05 was considered significant.
Results
Demographical data
Among the participants, 170 (73.6%) were females (mean age = 43 years; range, 23-66 years) and 61
(26.4%) were males (mean age = 43 years; range, 23-64 years). One-hundred and fifty eight subjects
(68.3%) were COVID-19 naïve and were categorized as seronegative at baseline while 73 (31.6%) were
seropositive. All demographical data of the population are presented in Supplementary Table 1.
Anti-NCP antibodies
Among the cohort, anti-NCP antibodies remained stable in seropositive participants up to 6 months
compared to pre-vaccinal titers (P > 0.05) (Supplementary Figure 1). At the individual level, 3 participants
(1.3%) had a significant increase in their anti-NCP antibody levels. The first subject was seronegative
before vaccination and had a positive RT-PCR 93 days since the first vaccine dose. The B.1.1.7 variant
was identified by sequencing. The subject had a close contact with an infected patient and was
asymptomatic. The second subject was seropositive at baseline with a documented positive RT-PCR in
April 2020 and reported a positive RT-PCR 71 days after the first dose. The subject developped minor
symptoms. No sequencing was available. The third subject was seronegative before vaccination and
reports a positive RT-PCR carried out in the context of persisting flu-like symptoms, only 2 days after the
first dose.
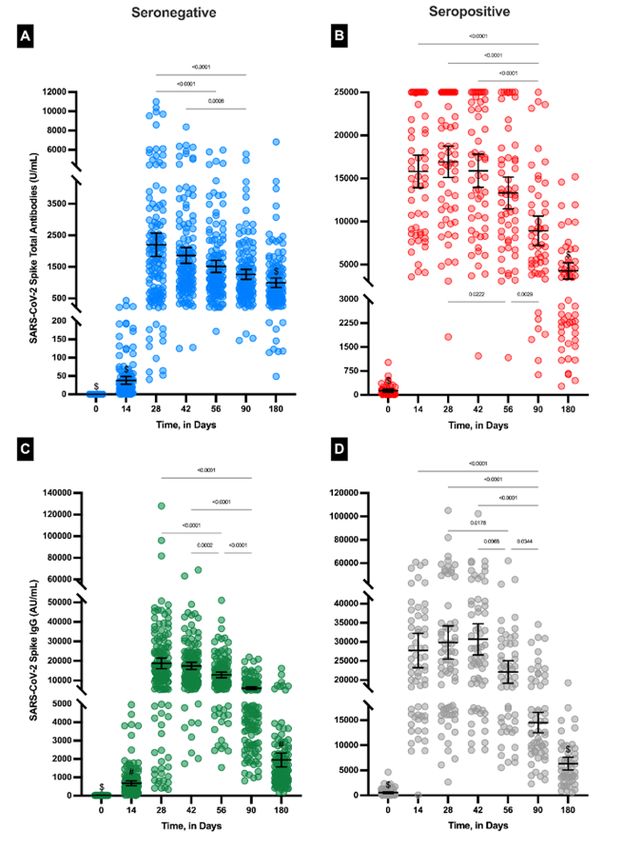
IgG and total antibodies
In seronegative individuals, the maximal antibody response was reached at day 28 with a mean total
antibodies titer of 2,204 U/mL (95%CI: 1,833 – 2,575 U/mL) and a mean IgG titer of 18,785 AU/mL
(95%CI: 16,020 – 21,549 AU/mL). A continuous decrease was observed up to day 180 with an observed
mean total antibodies titer of 998 U/mL (95%CI: 848 –1,148) and an observed mean IgG titer of 1,949
AU/mL (95%CI: 1,565 – 2,332) which represent a decrease of 54.7% and 89.6%, respectively (Table 1,
Figure 1). In seropositive individuals, the maximal antibody reponse was reached at day 28 and day 42
for total and IgG antibodies, respectively. The mean total antibodies titer was 16,935 U/mL (95%CI:
15,112 – 18,759) and the mean IgG titer was 30,678 AU/mL (95%CI: 26,600 – 34,755). A continuous
decline was also observed between day 28 or day 42 and day 180 with a total antibodies titer of 4,270
U/mL (95%CI: 3,324 – 5,215) which represent a decrease of 74.8% and 79.4%, respectively (Table 1,
Figure 1). All participants still had detectable anti-S antibodies 6 months after the first vaccine dose (i.e.
total antibodies titer ≥ 0.8 U/mL and IgG titer ≥ 50 AU/mL).
Considering each time point separately, anti-S titers of seropositive individuals were always statistically
higher compared to seronegative individuals (P < 0.0001), except for IgG at the 6-month timepoint (Table
Page 5/191). The difference of titers between seronegative and seropositive individuals was higher when
measuring total antibodies compared to IgG, but the difference tends to decrease over time (Table
1, Figure 1).
Using the kinetics model, the time to maximum concentration (Tmax) in seronegative subjects for total
antibodies and IgG was comparable with 36.3 days (95% CI: 30.2 – 42.5) versus 34.5 days (95% CI: 31.7
– 37.2). The estimated half-life (T1/2) for total antibodies was 114 days (95% CI: 87 – 167) and was
significantly longer than the 21 days (95% CI: 13 – 65) obtained for IgG. In seropositive subjects, the Tmax
for total antibodies and IgG were also comparable (23.3 days (95% CI: 18.7 – 28.0) versus 25.0 days
(95% CI: 20.4 – 29.9), and was shorter compared to seronegatives. The estimated half-life for total
antibodies was 68 days (95% CI: 54 – 90) and slightly longer compared to IgG (i.e. 53 days, 95% CI: 40 –
79) (Figure 2).
According to the model, a mean time of 229 days (95% CI: 134 – 277) in seronegatives and 529 days
(95% CI: 283 – 623) in seropositives would be needed to cross the threshold of 50 AU/mL for the IgG
assay. For the total antibody assay, a mean time of 830 days (95% CI: 508 – 1,000) in seronegatives and
718 days (95% CI: 425 – 826) in seropositives would be needed to cross the threshold of 15 U/mL which
was defined by the manufacturer as a cut-off for detection of inhibitory effects.21 Using the threshold of
133 U/mL,22 the mean time needed would be 470 days (95% CI: 341 – 585) and 507 days (95% CI: 359 –
591) in seronegative and seropositive subjects, respectively.
Among the 1,443 samples analyzed on both assays, IgG and total anti-S antibodies showed an almost
perfect agreement (i.e. Cohen’s kappa = 0.97) with a Spearman’s correlation coefficient of 0.892 (95% CI:
0.881 – 0.902 ; P < 0.0001) (Supplemental Figure 2).
Neutralizing antibodies
In the 42 seronegative subjects included in this subgroup analysis, NAbs increased from a mean dilution
factor of 11.9 (95% CI: 9.96 – 13.8) at day 0 to 1,955 (95%CI: 1,287 – 2,622) at day 28, which represents
an increase of 99.4% (P < 0.0001) with all subjects having detectable NAbs at day 28. At day 90 and day
180, the mean dilution factors decreased to 127.6 (95% CI: 84.3 – 170.9) and 26.1 (95%CI: 20.1 – 32.1),
which represents, respectively, a significant decrease of 93.5% and 98.7% compared to day 28. At these
timepoints, the positivity rates dropped at 95.2% and 45.0% (Figure 3), respectively. In the 18 seropositive
subjects, 72.2% of the subjects had detectable NAbs at baseline. At day 28, the mean dilution factor
increased from 43.8 to 2,091 which represents an increase of 97.9% (P < 0.001). At day 90 and day 180,
the mean dilution factors were 163.1 (95%CI: 83.5 – 242.6) and 30.5 (95% CI: 18.2 – 42.7) which
represents a significant decrease of 92.2% and 98.5%, respectively. All subjects had detectable levels of
NAbs at day 28 and day 90 but the positivity rate decreases to 44.4% at day 180. Considering each
timepoint separately, NAbs of seropositive individuals were not statistically different compared to
seronegative individuals (P > 0.9998). The kinetic model found that the estimated half-life of NAbs in this
subgroup was 16 days (95% CI: 9 to 59 days) and that the time to reach the negativity cut-off was 135
Page 6/19days (95% CI: 55 – 179 days). A significant correlation with total antibodies was found (r = 0.63, P <
0.0001) (Supplemental Figure 3) but the strength of agreement was moderate with the manufacturer’s
cut-off (Cohen’s kappa = 0.60). The use of alternative cut-off (15 and 133 U/mL) did not increase the
agreement (0.58 and 0.54, respectively). For the IgG assay, we observed a better correlation (r = 0.78, P <
0.0001), with still a moderate strength of agreement (Cohen’s kappa = 0.66) (Supplemental Figure 3). No
alternative cut-off could enhance the observed agreement.
Discussion
In this study, compared to the peak antibody response, a significant antibody decline 6 months post-
vaccination with BNT162b2 COVID-19 vaccine was reported. The decline was highly significant for total
antibodies, IgG and NAbs in both seronegative and seropositive participants.
In COVID-19 naïve subjects, the decline of total antibodies at 6 months was lower (i.e. -54.7%) than the
decline of IgG (i.e. -89.6%) or NAbs (-98.7%) while in seropositive participants, the decline of total
antibodies and IgG at 6 months was quite similar (-74.8% versus − 79.4%) and lower than the decline of
NAbs (-98.7%). The distinct kinetics observed for the total antibody assays compared to IgG may be
explained by the additional response of non-IgG antibody isotypes, which may persist several month
post-vaccination.25,26 On the other hand, in subjects who had already developed an immune response
due to exposition to SARS-CoV-2 or occurrence of COVID-19 disease, the serological response following a
de novo exposure to the antigen is mainly dominated by the IgG response while the IgM response is
reduced, or even absent. This may explain why the total and IgG antibodies declines are closer in the
seropositive subgroup.27,28 Interestingly, in seropositive subjects, the anti-NCP antibodies level did not
decline over at least day 180.29 Some groups have suggested that anti-NCP antibodies confer additional
immunity in seropositive subjects but this is subject to debate in the literature.30 Besides, in our subgroup
analysis, we did not identify a difference in terms of NAbs titers between seropositive and seronegative
subjects (Table 1).
Data about the long-term antibody kinetics in BNT162b2 vaccinees are still scarce. Israel et al. just found
that the mean SARS-CoV-2 IgG antibody titer (Abbott Architect®) after BNT162b2 vaccination decreased
by 93.7% at 6 months (i.e. 765 AU/mL) compared to the highest mean antibody response (i.e. 12,153
AU/mL).31 These data are confirmed by our study, especially in the seronegative cohort. The higher mean
titers observed in our study may be related to the lower age of our cohort compared to the one of Israel et
al. (42.0 versus 56.5 years), which has been reported as a confounding factor for antibody response.32,33
Moreover, the antibody decline was also higher compared to convalescent patients where a drop of 4 to
7% every month has been reported compared to drop observed in our vaccinated subjects.31,34 Finally, the
proportion of vaccinees below the threshold of 50 AU/mL was higher (i.e. 16.1% at 6 months) compared
to the one in convalescent subjects (i.e. 10.8% at 9 months).31 In our study, no participant had IgG or total
antibodies titers below the manufacturers’ threshold. In contrast to Israel et al., we also enrolled subjects
categorized as seropositive before the first vaccine injection and observed an IgG decrease of 79.4% in
Page 7/19this group (Fig. 1). As reported elsewhere, the vaccination with BNT162b2 elicited much higher total
antibodies and IgG titers compared to ones obtained in convalescent patients.12,26,31 In our model, the
TMAX for total antibodies and IgG was reached at a similar timeframe in the two cohorts. The model also
predicts a drop of IgG below the positivity threshold (i.e. 50 AU/mL) after 229 days (95% CI: 134–277
days) for seronegative and after 529 days (95% CI: 283–623 days) for seropositive individuals.
Regarding total antibodies, depending on the cut-off used, these times range from 470 (95% CI: 341–585
days ) to 830 days (95% CI: 508–1,000 days) in seronegatives and from 507 (95% CI: 359–591 days) to
718 days (95% CI: 42–826) in seropositives subjects. These predictions need to be confirmed by
subsequent sampling times to refine the reliability of the model. However, these data could already
support the different government and competent authorities in the decisions that will need to be taken for
the next steps of the vaccination strategy.35 These observations are in line with the statement of the CEO
of Pfizer who declared that a third vaccine dose would be likely needed 12 months following the first
shot.2 If assuming that the antibody decline is constant over time, our kinetic model predict a decrease
below the positity threshold between 229 and 830 days, depending on the assay used (total versus IgG
antibodies) and the serological status of the subject before vaccination. The aim will be to keep an
effective humoral response to protect vaccinated subjects against the wild-type SARS-CoV-2, but more
importantly, against the variants of concern. It is therefore important to have reliable models to predict
when the drop will be too high to maintain a sufficient humoral response. In addition, as some variant of
concern have demonstrated an immune escape, it is important to realize that our models may even be
optimistic since higher neutralizing antibody titers may be needed to provide a similar degree of
protection than the one reported during the clinical development of these vaccines.35
More and more data support the concept that NAbs correlate with protection against infection and it has
been suggested that it may serve in the future as a biomarker that ensure a proper protection at the
individual’s level.36 Earle et al. observed a relatively good correlation between the neutralizing (rs = 0.79)
or binding antibodies (rs = 0.93) and vaccine efficacy.37 In addition, in a study on 1,497 healthcare
professionnals having received the two-dose regimen of the BNT162b2 vaccine, Bergwerk et al. identified
lower NAbs and IgG titers in the 39 subjects that developed a SARS-CoV-2 infection despite a full
vaccination scheme. This supports the concept that NAbs, or assays that correlate with NAbs, may be an
appropriate indicator of the protection at the individual level.38
The automated assays used in the present study (i.e. Roche Elecsys® and Abbott Architect®) do not
specially measure NAbs but a significant correlation between the anti-S assay from Roche Diagnostics (r
= 0.63, P < 0.0001) or Abbott (r = 0.78 ; P < 0.0001) and pVNT was found (Supplemental Fig. 2).39,40
Nevertheless, these correlations were weak and do not reflect the percentage of subjects with NAbs under
the positivity threshold at 6 months, i.e. 55% with the pVNT assay vs 0% with both total and IgG
antibodies. Several other studies reported the same conclusions with various serological assays available
on the market.16,40− 42 These discrepancies seem to suggest that the manufacturers’ cut-off are not
adequate to reflect the neutralizing capacity and should be significantly increased to reach a better
agreement with NAbs, although improvements seems difficult to reach (Supplementary Fig. 3). Indeed,
Page 8/19some patients presenting high levels of total or IgG antibodies at 6 months no longer have NAbs at the
same timepoint. This highlights the fact that we are probably still far from reaching a substitution of
pVNT assays by the surrogate IgG or total antibodies assays currently on the market. Thus, the clinical
implications of the waning in NAbs we observed is not yet clear on a clinical point of view and the
establishement of thresholds associated to protection are still needed, but the link between low NAbs titer
and breakthrough infection may not be excluded and justify the application of appropriate vaccination
strategies, especially in frail patients.38,43− 45
Despite the call of the WHO to temporary halt the administration of COVID vaccine boosters,46 some
countries already decided to administer such booster dose. In Israel and France, a third dose of the
BNT162b2 vaccine is given to people over 50 or 65 and to other vulnerable persons.47 In Germany, UK
and USA, boosters are planned to be administered to certains group of persons. In an editorial published
in Nature the 17th of August 2021, authors agreed with the WHO to call a temporary halt to COVID
vaccine boosters. Indeed, at the time of the editorial, 58% of people in high-income countries had received
at least one vaccine dose compared to 1.3% in low-income countries. In some particular cases (i.e.
immunosuppressant drugs), boosters might be warranted but there is still little evidence that these
additional shots are needed to protect the fully vaccinated people.46
Finally, besides the humoral response, there is still few data concerning the cell mediated immunity
responses, and in which extent this protection contributes to the long-term efficacy of the vaccines.
Indeed, there is increasing evidence that an early and coordinated T cell response is associated with less
severe COVID-19 and provide longer-term protection, even against the variants of concern.48–50
Conclusion
We found a highly significant decrease in NAbs, IgG and total antibodies in both seropositive and
seronegative subjects, 6 months after the administration of the first dose of BNT162b2. The decline of
NAbs was more pronounced and around 45% of the subjects tested are negative at 6 months. Further
studies are needed to elucidate the relationship between the decline of the humoral response and the
clinical efficacy of the vaccine. Moreover, with various kinetics observed, our results also raise the
question of which antibody types will be the most clinically relevant to assess the humoral decline since
none of those reported in this study seems to show a sufficient correlation and agreement with the
neutralizing capacity. This study has a planned follow-up of two years, with the next blood sampling
campaign planned in January 2022. This will permit to further refine the kinetics model and to provide
better estimate of the antibody response in both seropositive and seronegative individuals.
Declarations
Conflict of interest Disclosures: The authors have nothing to disclose.
Acknowledgment: We thank Roche Diagnostics for providing the kits for the evaluation.
Page 9/19References
1. Polack, F. P. et al. Safety and Efficacy of the BNT162b2 mRNA Covid-19 Vaccine. The New England
journal of medicine 383, 2603–2615, doi:10.1056/NEJMoa2034577 (2020).
2. Food and Drug Administration. FDA News Release — FDA Approves First COVID-19 Vaccine,
(2021).
3. Dagan, N. et al. BNT162b2 mRNA Covid-19 Vaccine in a Nationwide Mass Vaccination Setting. The
New England journal of medicine 384, 1412–1423, doi:10.1056/NEJMoa2101765 (2021).
4. Amit, S., Regev-Yochay, G., Afek, A., Kreiss, Y. & Leshem, E. Early rate reductions of SARS-CoV-2
infection and COVID-19 in BNT162b2 vaccine recipients. Lancet 397, 875–877, doi:10.1016/S0140-
6736(21)00448-7 (2021).
5. Levine-Tiefenbrun, M. et al. Initial report of decreased SARS-CoV-2 viral load after inoculation with
the BNT162b2 vaccine. Nature medicine 27, 790–792, doi:10.1038/s41591-021-01316-7 (2021).
6. Thomas, S. J. et al. Six Month Safety and Efficacy of the BNT162b2 mRNA COVID-19 Vaccine.
medRxiv (2021).
7. Shamier, M. C. et al. Virological characteristics of SARS-CoV-2 vaccine breakthrough infections in
health care workers. medRxiv (2021).
8. Ebinger, J. E. et al. Antibody responses to the BNT162b2 mRNA vaccine in individuals previously
infected with SARS-CoV-2. Nature medicine 27, 981–984, doi:10.1038/s41591-021-01325-6 (2021).
9. Padoan, A. et al. Antibody response to first and second dose of BNT162b2 in a cohort of
characterized healthcare workers. Clinica chimica acta; international journal of clinical chemistry
519, 60–63, doi:10.1016/j.cca.2021.04.006 (2021).
10. Tre-Hardy, M. et al. Reactogenicity, safety and antibody response, after one and two doses of mRNA-
1273 in seronegative and seropositive healthcare workers. J Infect 83, 237–279,
doi:10.1016/j.jinf.2021.03.025 (2021).
11. Salvagno, G. L. et al. Anti-SARS-CoV-2 Receptor-Binding Domain Total Antibodies Response in
Seropositive and Seronegative Healthcare Workers Undergoing COVID-19 mRNA BNT162b2
Vaccination. Diagnostics (Basel, Switzerland) 11, 832, doi:10.3390/diagnostics11050832 (2021).
12. Favresse, J. et al. Neutralizing Antibodies in COVID-19 Patients and Vaccine Recipients after Two
Doses of BNT162b2. Viruses 13, 1364, doi:10.3390/v13071364 (2021).
13. Favresse, J. et al. Early antibody response in health-care professionals after two doses of SARS-CoV-
2 mRNA vaccine (BNT162b2). Clin Microbiol Infect, doi:10.1016/j.cmi.2021.05.004 (2021).
14. Braeye, T. et al. Vaccine effectiveness against infection and onwards transmission of COVID-19:
Analysis of Belgian contact tracing data, January-June 2021. Vaccine,
doi:10.1016/j.vaccine.2021.08.060 (2021).
15. Hirotsu, Y. et al. Robust Antibody Responses to the BNT162b2 mRNA Vaccine Occur Within a Week
After the First Dose in Previously Infected Individuals and After the Second Dose in Uninfected
Page 10/19Individuals. Frontiers in Immunology 12, doi:10.3389/fimmu.2021.722766 (2021).
16. Lustig, Y. et al. BNT162b2 COVID-19 vaccine and correlates of humoral immune responses and
dynamics: a prospective, single-centre, longitudinal cohort study in health-care workers. Lancet
Respir Med, doi:10.1016/S2213-2600(21)00220-4 (2021).
17. Salvagno, G. L. et al. Three-month analysis of total humoral response to Pfizer BNT162b2 mRNA
COVID-19 vaccination in healthcare workers. J Infect 83, e4-e5, doi:10.1016/j.jinf.2021.06.024
(2021).
18. Cocomazzi, G. et al. Early Serological Response to BNT162b2 mRNA Vaccine in Healthcare Workers.
Vaccines (Basel) 9, 913, doi:10.3390/vaccines9080913 (2021).
19. Favresse, J. et al. Antibody titres decline 3-month post-vaccination with BNT162b2. Emerg Microbes
Infect 10, 1495–1498, doi:10.1080/22221751.2021.1953403 (2021).
20. Favresse, J. et al. Clinical Performance of the Elecsys Electrochemiluminescent Immunoassay for the
Detection of SARS-CoV-2 Total Antibodies. Clinical chemistry 66, 1104–1106,
doi:10.1093/clinchem/hvaa131 (2020).
21. Diagnostics, R. Elecsys® Anti-SARS-CoV-2 S — Immune Response to SARS-CoV-2 Infection &
Vaccination – Questions & Answers. (2021).
22. Resman Rus, K., Korva, M., Knap, N., Avsic Zupanc, T. & Poljak, M. Performance of the rapid high-
throughput automated electrochemiluminescence immunoassay targeting total antibodies to the
SARS-CoV-2 spike protein receptor binding domain in comparison to the neutralization assay. J Clin
Virol 139, 104820, doi:10.1016/j.jcv.2021.104820 (2021).
23. Nie, J. et al. Quantification of SARS-CoV-2 neutralizing antibody by a pseudotyped virus-based assay.
Nat Protoc 15, 3699–3715, doi:10.1038/s41596-020-0394-5 (2020).
24. Douxfils, J., Gillot, C., Mullier, F. & Favresse, J. Post-SARS-CoV-2 vaccination specific antibody
decrease - Thresholds for determining seroprevalence and seroneutralization differ. J Infect,
doi:10.1016/j.jinf.2021.08.023 (2021).
25. Knies, A., Ladage, D., Braun, R. J., Kimpel, J. & Schneider, M. Persistence of humoral response upon
SARS-CoV‐2 infection. Reviews in Medical Virology, e2272 (2021).
26. Favresse, J. et al. Persistence of Anti-SARS-CoV-2 Antibodies Depends on the Analytical Kit: A Report
for Up to 10 Months after Infection. Microorganisms 9, 556, doi:10.3390/microorganisms9030556
(2021).
27. To, K. K. et al. Serum Antibody Profile of a Patient With Coronavirus Disease 2019 Reinfection. Clin
Infect Dis 72, e659-e662, doi:10.1093/cid/ciaa1368 (2021).
28. Erdman, D. D., Heath, J. L., Watson, J. C., Markowitz, L. E. & Bellini, W. J. Immunoglobulin M antibody
response to measles virus following primary and secondary vaccination and natural virus infection.
J Med Virol 41, 44–48, doi:10.1002/jmv.1890410110 (1993).
29. Favresse, J. et al. Long-term kinetics of anti-SARS-CoV-2 antibodies in a cohort of 197 hospitalized
and non-hospitalized COVID-19 patients. Clinical chemistry and laboratory medicine: CCLM / FESCC
59, e179-e183, doi:10.1515/cclm-2020-1736 (2021).
Page 11/1930. Perkmann, T. et al. Spike protein antibodies mediate the apparent correlation between SARS-CoV-2
nucleocapsid antibodies and neutralization test results. Microbiology Spectrum 9, e00218-00221
(2021).
31. Israel, A. et al. Large-scale study of antibody titer decay following BNT162b2 mRNA vaccine or SARS-
CoV-2 infection. medRxiv, 2021.2008.2019.21262111, doi:10.1101/2021.08.19.21262111 (2021).
32. Bayart, J. L. et al. Confounding Factors Influencing the Kinetics and Magnitude of Serological
Response Following Administration of BNT162b2. Microorganisms 9, 1340,
doi:10.3390/microorganisms9061340 (2021).
33. Tober-Lau, P. et al. Long-term immunogenicity of BNT162b2 vaccination in the elderly and in younger
health care workers. medRxiv, 2021.2008.2026.21262468, doi:10.1101/2021.08.26.21262468
(2021).
34. Egbert, E. R. et al. Durability of Spike Immunoglobin G Antibodies to SARS-CoV-2 Among Health Care
Workers With Prior Infection. JAMA Network Open 4, e2123256,
doi:10.1001/jamanetworkopen.2021.23256 (2021).
35. Rubin, R. COVID-19 Vaccines vs Variants-Determining How Much Immunity Is Enough. JAMA 325,
1241–1243, doi:10.1001/jama.2021.3370 (2021).
36. Khoury, D. S. et al. Neutralizing antibody levels are highly predictive of immune protection from
symptomatic SARS-CoV-2 infection. Nature medicine 27, 1205–1211, doi:10.1038/s41591-021-
01377-8 (2021).
37. Earle, K. A. et al. Evidence for antibody as a protective correlate for COVID-19 vaccines. Vaccine 39,
4423–4428, doi:10.1016/j.vaccine.2021.05.063 (2021).
38. Bergwerk, M. et al. Covid-19 Breakthrough Infections in Vaccinated Health Care Workers. The New
England journal of medicine, doi:10.1056/NEJMoa2109072 (2021).
39. L'Huillier, A. G. et al. Antibody persistence in the first 6 months following SARS-CoV-2 infection
among hospital workers: a prospective longitudinal study. Clin Microbiol Infect,
doi:10.1016/j.cmi.2021.01.005 (2021).
40. Jung, K. et al. Performance evaluation of three automated quantitative immunoassays and their
correlation with a surrogate virus neutralization test in coronavirus disease 19 patients and pre-
pandemic controls. Journal of Clinical Laboratory Analysis, e23921 (2021).
41. Dolscheid-Pommerich, R. et al. Correlation Between a Quantitative Anti‐SARS‐CoV‐2 IgG ELISA and
Neutralization Activity. Journal of Medical Virology (2021).
42. Ferrari, D. et al. Harmonization of six quantitative SARS-CoV-2 serological assays using sera of
vaccinated subjects. Clinica Chimica Acta (2021).
43. Shrotri, M. et al. Spike-antibody waning after second dose of BNT162b2 or ChAdOx1. Lancet 398,
385–387, doi:10.1016/S0140-6736(21)01642-1 (2021).
44. Hacisuleyman, E. et al. Vaccine Breakthrough Infections with SARS-CoV-2 Variants. New England
Journal of Medicine 384, 2212–2218, doi:10.1056/nejmoa2105000 (2021).
Page 12/1945. Stephenson, J. COVID-19 Vaccinations in Nursing Home Residents and Staff Give Robust Protection,
Though Breakthrough Infections Still Possible. JAMA Health Forum 2, e211195,
doi:10.1001/jamahealthforum.2021.1195 (2021).
46. The WHO is right to call a temporary halt to COVID vaccine boosters. Nature 596 (2021).
47. Haute autorité de Santé. Populations éligibles à une dose de rappel de vaccin, (2021).
48. Tan, A. T. et al. Early induction of functional SARS-CoV-2-specific T cells associates with rapid viral
clearance and mild disease in COVID-19 patients. Cell Rep 34, 108728,
doi:10.1016/j.celrep.2021.108728 (2021).
49. Sattler, A. et al. SARS-CoV-2-specific T cell responses and correlations with COVID-19 patient
predisposition. J Clin Invest 130, 6477–6489, doi:10.1172/JCI140965 (2020).
50. Bonifacius, A. et al. COVID-19 immune signatures reveal stable antiviral T cell function despite
declining humoral responses. Immunity 54, 340–354 e346, doi:10.1016/j.immuni.2021.01.008
(2021).
Tables
Table 1: Evolution of SARS-CoV-2 spike antibodies (U/mL) in seronegative and seropositive persons
using the Roche Elecsys®, the Abbott Architect® assays and the pseudovirus neutralizing test. Means
with 95% confidence intervals are reported. The between group difference of antibody titers were tested
using a Tukey multiple comparison test. A multiple testing correction was applied in the multiple group
comparision. P-value < 0.05 was considered significant.†pVNT have only been performed in 60 subjects.
Page 13/19SARS-CoV-2 total antibodies
Seronegative Seropositive Ratio P-value
+/-
Before first 0.40 (0.39-0.41) U/mL 132.0 (86.1-177.6) U/mL 33090 days 127.6 (84.3-170.9) 163.1 (83.5-243) 1.3 0.390
180 days 26.1 (20.1-32.1) 30.5 (18.2-42.7) 1.2 0.463
Figures
Figure 1
Page 15/19Evolution of SARS-CoV-2 spike antibodies (U/mL) in seronegative (A and C for total antibodies and IgG,
respectively) and seropositive individuals (B and D for total antibodies and IgG, respectively) according to
the time since the first vaccine dose administration. Means with 95% confidence intervals are shown. [A
and B] Using the total antibody assay, an automatic dilution of 1/100 at >250 U/mL was performed by
the analyzer to extend the measurement domain up to 25,000 U/mL. Forty-six samples were rounded to
25,000 U/mL out of 1,337 (3.4%). Results < 0.4 U/mL (limit of quantification) were rounded to 0.4. [C and
D] Using the IgG assay, an automatic dilution of 1/4 at > 40,000 AU/mL was manually performed to
extent the measurement domain to 160,000 AU/mL. Results < 21 AU/mL (limit of quantification) were
rounded to 21. $ = statistically different from all other groups (i.e. P < 0.0001). # = statistically different
from all other groups (i.e. P < 0.0001) except between time points 14 and 180.
Page 16/19Figure 2
Kinetic modelisation of (A) total antibodies and (B) IgG serological response. A zoom of the seronegative
population is presented in the right-upper part of the figure A. Means plus/minus standard deviation are
shown at the different timepoints. The magnitude of the response depends on the analytical kit and the
difference between COVID-19 naïve and seropositive individuals is less marked with IgG than with total
antibodies.
Page 17/19Figure 3
Evolution of SARS-CoV-2 neutralizing antibodies in seronegative (blue, n = 42) and seropositive
individuals (red, n = 18) at baseline and 1 month, 3 months and 6 months after the first vaccine shot.
Supplementary Files
Page 18/19This is a list of supplementary files associated with this preprint. Click to download.
SupplementalFiguresandTables.docx
Page 19/19You can also read