WARD PROFILE: EDMONTON GREEN 2021 - Enfield Council
←
→
Page content transcription
If your browser does not render page correctly, please read the page content below
WARD PROFILE:
EDMONTON GREEN
2021
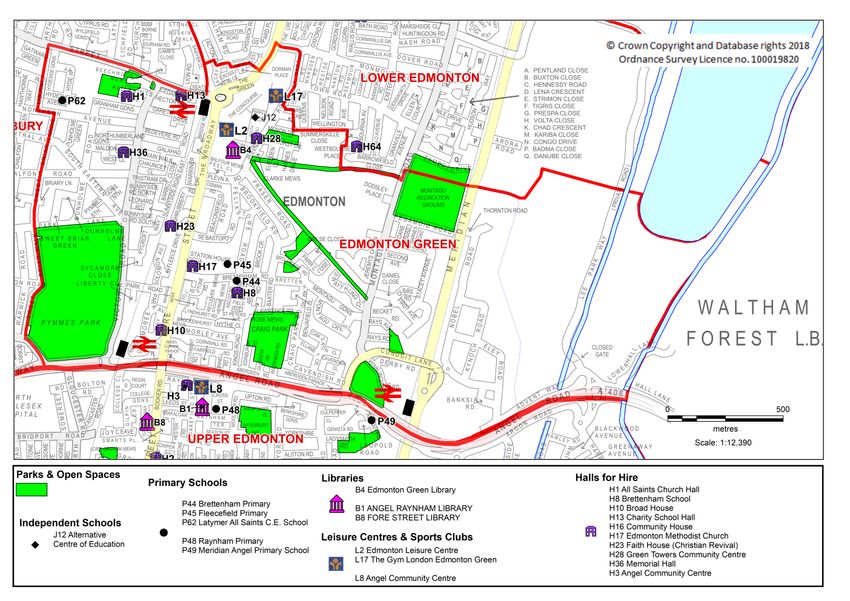
Edmonton Green Ward is situated in the south-east of the Borough, bordered by Lower
Edmonton Ward to the north, Haselbury Ward to the west, Upper Edmonton ward to the
south, and by the London Borough of Waltham Forest to the east. It is covered by postal
districts N9 and N18.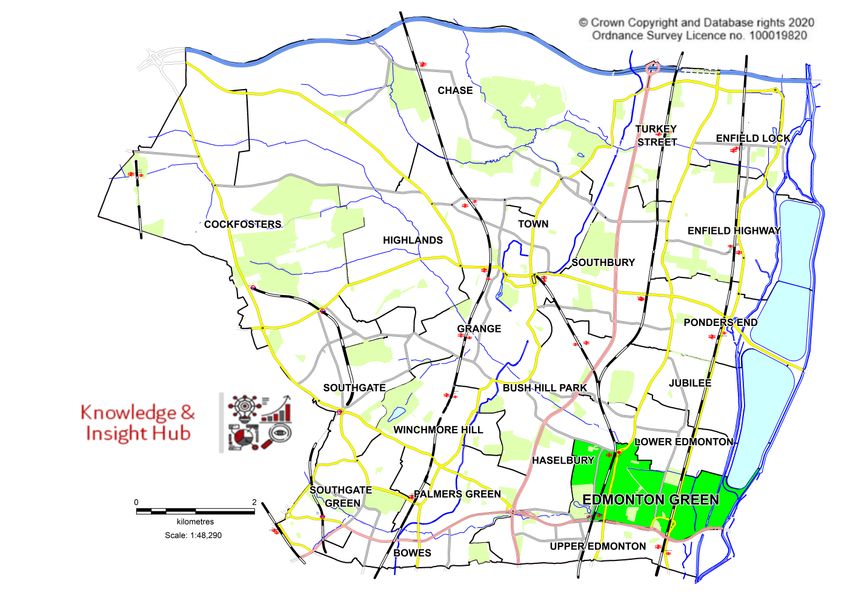
Ward Profile

This Profile is intended to provide a guide to the demography, social and economic data and Council
facilities in the ward.
It has been collated using the most up to date local-level data relating to 2020/21 as far as possible. A
variety of statistical sources, both national and local, have been used in its compilation.
Appendix A has a table of key statistics for at a glance comparison with Borough averages.

  Political Makeup

The ward is represented by the following Councillors:

                                                                                      Votes
  Name                                   Party             Contact                    received in
                                                                                      2018 election

  Tolga Aramaz                           Labour            020 8379 5763                   2,699
  Mahym Bedekova                         Labour            020 8379 6867                   2,629
  Ergin Erbil                            Labour            020 8379 3938                   2,533

At the 2018 council elections, voter turnout in Edmonton Green was 32.9%.
Edmonton Green ward falls in the parliamentary seat of Edmonton.

 Demography

Summary Statistics:
                                                  Edmonton
 Measure                                                         Enfield      Source
                                                  Green
 Population Estimate (2019)                            19,207       333,794   ONS mid-year estimates 2019
 Children aged 0-15                                     5,044        76,137   ONS mid-year estimates 2019
 Working-age people (16-64)                            12,375       213,093   ONS mid-year estimates 2019
 Older people aged 65+                                  1,788        44,564   ONS mid-year estimates 2019
 % All Children aged 0-15                                26.3          22.8   ONS mid-year estimates 2019
 % All Working-age (16-64)                               64.4          63.8   ONS mid-year estimates 2019
 % All Older people aged 65+                              9.3          13.4   ONS mid-year estimates 2019
 % BAME - 2019                                           57.1          36.6   Enfield Council Estimates 2019
 % BAME - 2011                                           60.6          39.0   Census 2011
 % Not Born in UK - 2011                                 46.8          35.1   Census 2011
 % English is First Language of no one in
                                                          21.4         14.1 Census 2011
 household - 2011
                                                                            Ministry for Housing, Communities
 Area - Square Kilometres                                  3.1         82.2
                                                                            and Local Government
                                                                            ONS mid-year estimates 2019 /
 Population density (people per sq km)                   6,196        4,061
                                                                            MHCLG

Produced by the Knowledge and Insight Hub                                                                       2
If you have any queries relating to this document please email KIH@enfield.gov.uk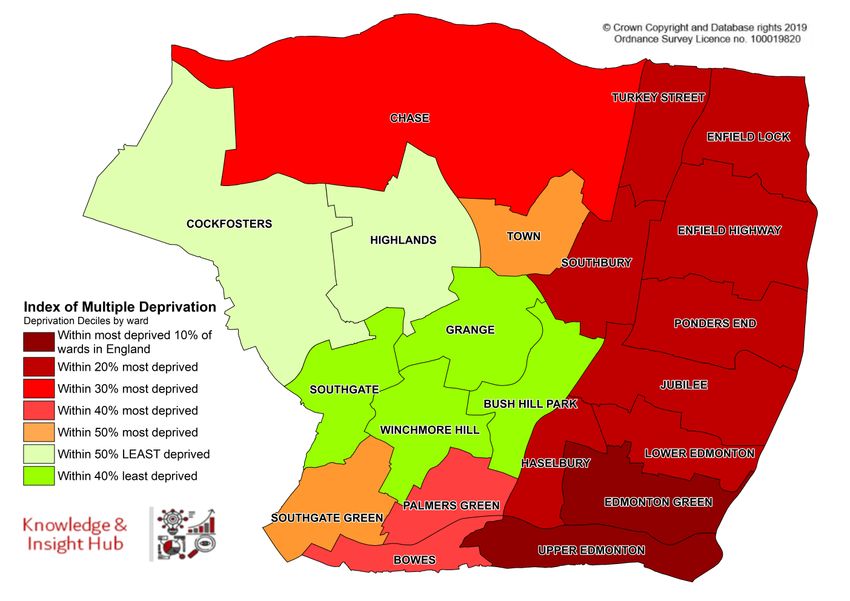
Population

Based upon the ONS mid-year estimate 2019 the total population is estimated to be 19,207. This is the
second largest population of the 21 wards in Enfield.

 The population of Edmonton Green ward has
 increased by 7.0% since the 2011 Census, which
 is higher than the average increased across the
 borough.

 Male – Female distribution
 The proportions of male and female residents in Edmonton Green Ward are 49.4% and 50.6%
 respectively, with males outnumbering females in the younger age bands – up to age 25.

Age Profile

                                                                                    The proportions of
                                                                                    residents in the
                                                                                    younger age
                                                                                    groups (under 35
                                                                                    years) are higher
                                                                                    than the borough
                                                                                    average. There
                                                                                    are relatively low
                                                                                    proportions of
                                                                                    Over 65s.

                                                                                    For more detail
                                                                                    see appendix.

Produced by the Knowledge and Insight Hub                                                                3
If you have any queries relating to this document please email KIH@enfield.gov.uk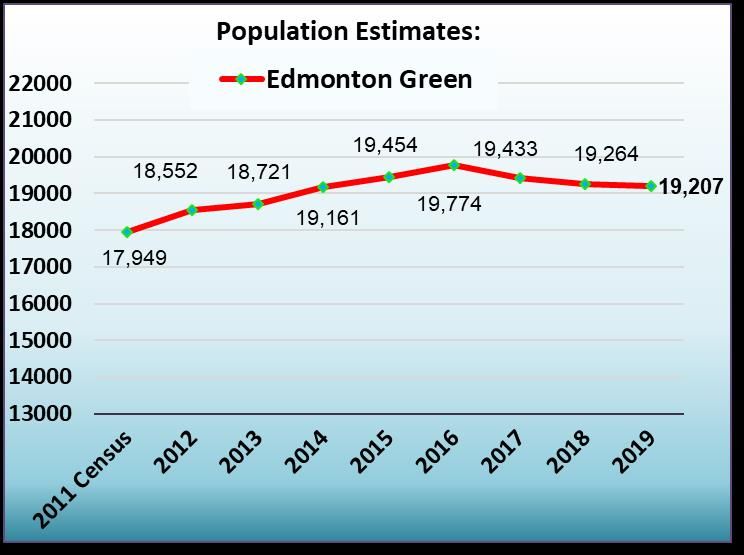
Ethnicity

The ward contains relatively large numbers in the Somali, Other Black African, Other Black, Turkish and
Kurdish ethnic groups.

As at the 2011 Census, the percentages of Black, Asian and Minority Ethnic Group (BAME) was 60.6% and
Non-UK Born residents was 46.8%. The percentage of households without English as a first language was
21.4%.

Enfield Council’s own 2019 estimates give the ward’s BAME Group to be 57.1% of the total population.

Ethnicity estimates are produced in-house, using data from the 2001 and 2011 Censuses and the School
Census conducted by the local education authority (LEA). The School Census results indicate the changing
nature of the population and Enfield pupils recorded themselves under 95 different ethnic codes. Ward
ethnicity populations have been consolidated and estimated for the 22 groups that make up the Council’s
standard ethnic group classification (see table below)1.

                                                                  Edmonton Green                Borough

                         Ethnicity (2019)
                                                             Estimated                    Estimated
                                                                              %                           %
                                                             No.                          No.

               White British                                         2,991         15.7       128463      38.3
               White Irish                                             162          0.9         6427       1.9
               Greek                                                    67          0.3         3862       1.2
               Greek Cypriot                                           287          1.5        15612       4.7
               Turkish                                               2,558         13.4        25413       7.6
               Turkish Cypriot                                         290          1.5         6079       1.8
               Kurdish                                                 409          2.1         4152       1.2
               White Other                                           1,413          7.4        22501       6.7
               White & Black Caribbean                                 277          1.5         4248       1.3
               White and Asian                                         190          1.0         3627       1.1
               White and Black African                                 208          1.1         2303       0.7
               Other mixed                                             353          1.9         6562       2.0
               Indian                                                  473          2.5        11066       3.3
               Pakistani                                               109          0.6         2407       0.7
               Bangladeshi                                             680          3.6         5971       1.8
               Chinese                                                 108          0.6         2441       0.7
               Other Asian                                             907          4.8        11954       3.6
               Somali                                                1,521          8.0         9160       2.7
               Other Black African                                   2,390         12.5        25032       7.5
               Black Caribbean                                       1,720          9.0        17561       5.2
               Other Black                                             976          5.1         8285       2.5
               Other Ethnic Group                                      977          5.1        12300       3.7

1
 Please note totals will not sum with ONS population estimates.

Produced by the Knowledge and Insight Hub                                                                        4
If you have any queries relating to this document please email KIH@enfield.gov.uk
Language

The main languages of residents* given by 2011 Census estimates are:
   English                                        11,244       67%
   Turkish                                         1,848       11%
   Somali                                            538        3%
   Polish                                            334        2%
   Bengali                                           278        2%
* aged 3 and over

The ward had the highest number of Turkish, Somali, French, Albanian and Kurdish speakers in Enfield,
and the 2nd highest number of Bengali and Portuguese.

Religion

Regarding Religion, the best guide is the 2011 Census. This showed the religious composition of the ward
as:

                                                            Borough
  Religion                         No.        Ward %       average %
  Christian                       8665         48.3              53.6
  Buddhist                          77          0.4               0.6
  Hindu                            623          3.5               3.5
  Jewish                            26          0.1               1.4
  Muslim                          5226         29.1              16.7
  Sikh                              56          0.3               0.3
  Other/none/not stated           3276         18.3              23.8

Produced by the Knowledge and Insight Hub                                                                  5
If you have any queries relating to this document please email KIH@enfield.gov.uk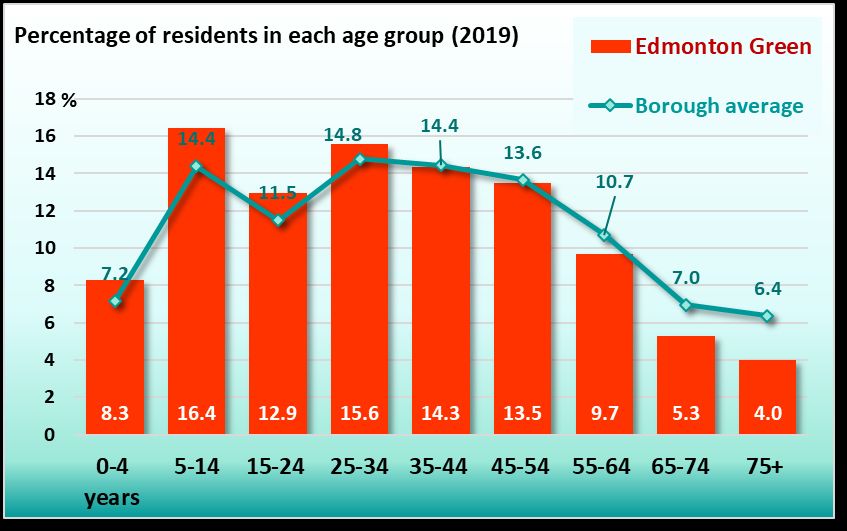
Socio-economic factors

Socio-economic classification

                                                                                   The 2011 Census
                                                                                   results showed that
                                                                                   Edmonton Green had
                                                                                   an above average
                                                                                   proportion of people
                                                                                   in routine occupations
                                                                                   with about 32% more
                                                                                   people than the
                                                                                   Borough average.

Low income households
Edmonton Green had the lowest average (median) household income of the 21 wards in Enfield, as
estimated by CACI in 2021. Average household income in the ward is below the median level for the
borough as a whole and also lower than the London median.

The proportion of households with an income of less than £15,000 was put at 28.1% compared to a
Borough average of 15.4%. This was the highest proportion of the 21 wards and higher than the London
average.

Provisional statistics from the Department for Work and Pensions indicate that, at 2020, 1,424 children in
the ward (28.2% of the total) were living in families with relative low income, and 1,157 (22.9%) were in
families of Absolute low income2. The proportions of children in poverty compared with local, regional and
national averages are shown in the chart below.

2
 Relative low income: equivalised household income is less than 60% of the UK median for that year. Absolute low income:
equivalised household income is less than 60% of the UK median for the period 2010-2011.

Produced by the Knowledge and Insight Hub                                                                                  6
If you have any queries relating to this document please email KIH@enfield.gov.uk
Benefit Claims
• As at June 2021, the claimant count3 in Edmonton Green was 1,625, representing 13.1% of the local
working-age population.
• At February 2021, 45% of households in the ward (3,386) were claiming Universal Credit – this
includes working households.
Economically active people
The estimated proportion of people in work or looking for work (the economically active) was much lower
than the borough average in 2011. For number and rates see appendix.
Deprivation score
The Indices of Deprivation 2019 – produced for the Ministry of Housing, Communities and Local
Government– can be used to calculate the likely deprivation ranking of the ward. Analysis carried out by the
Local Government Association indicates that, within Enfield, Edmonton Green is the most deprived of the
21 wards in the Borough. The same analysis estimates that it is within the 10% most deprived wards in
England.
The map
illustrates
deprivation
levels for wards
in Enfield, when
compared with
the rest of the
7,180 wards in
England for
which data
were available.
Fuel Poverty
Ward-level analysis of government statistics4 reveal that, as at 2019, 21.5% of households in the ward were
in fuel poverty. This proportion was higher than both the borough and England averages.
3
The ‘narrow’ measure of unemployment: the number of people receiving either Job Seekers’ Allowance, or unemployed claimants
of Universal Credit who are required to seek work.
4
Published by Department for Business, Energy & Industrial Strategy
Produced by the Knowledge and Insight Hub 7
If you have any queries relating to this document please email KIH@enfield.gov.ukCrime
Appendix A has two crime related indicators by which the ward is compared to the Borough average:-
• Crime rate
• Anti-social behaviour rate
The latest crime rates and trends can be obtained from the Metropolitan Police crime mapping website.
Health
The most recent estimates of the life expectancies5 for men and women in the ward show that male life
expectancy is lower than the Enfield and England averages while the female equivalent is above average
on both counts.
Considering the age structure of the ward the number of deaths (2015-2019) is higher than would be
expected for the borough. Mortality from circulatory disease, respiratory disease and coronary heart
disease are significantly higher than the national average.
Life expectancies and Standardised Mortality Ratios by cause of death are shown in the charts below.
In the 2011 Census,
the population were
asked a question about
their general health.
The chart (right) shows
the response.
For the numbers of
people in these
categories, please see
appendix.
5Public Health England: Life Expectancy at birth 2015-2019
Produced by the Knowledge and Insight Hub 8
If you have any queries relating to this document please email KIH@enfield.gov.ukObesity The chart below shows the percentage of Reception and Year 6 children and adults in the ward who are overweight or obese, compared with the borough and national averages. The latest health information about the ward can be obtained from the Local Health website by choosing Find My Area and entering the ward name. Within the ward there are three GP surgeries: o Rainbow Practice, Evergreen PCC – 1 Smythe Close, N9 0TW o Chalfont Road Surgery, 2 Chalfont Road, N9 9LW o Dr Me Silver’s Practice, Edmonton Medical Centre, 234 Fore Street, N18 2LY and two dentists’ surgeries o Mr. S. I. Patel – 61 Market Square o Mr. M. C. Patel – 277 Fore Street Produced by the Knowledge and Insight Hub 9 If you have any queries relating to this document please email KIH@enfield.gov.uk
Housing

The 2011 (Census) profile of the households in the ward by housing tenure (sector) is:

    Tenure                                    No. (% share)              Borough average %
    Owner occupied                             2206 (32.0%)                       58.8%
    Private rented                             1718 (24.9%)                       23.6%
    Council                                   1610 (23.3%)                        11.4%
    Registered social landlord                1365 (19.8%)                         6.2%

The 2011 Census data provides a view of the accommodation type by ward compared with the rest of the
borough.

In Edmonton Green ward there is a far higher percentage of purpose-built flats compared with the Enfield
average.

For numbers of properties, see appendix.

In the year to December 2020, the median house price for Edmonton Green ward was £330,000, 22%
lower than the Borough median of £425,000, but having risen by 12% since the previous year.

Produced by the Knowledge and Insight Hub                                                                  10
If you have any queries relating to this document please email KIH@enfield.gov.uk
Education There are 3 primary schools and one independent establishment in the ward: Latymer All Saints CE Primary - http://www.latymerallsaints.enfield.sch.uk Fleecefield Primary School - http://www.fleecefield.enfield.sch.uk/ Brettenham Primary School - http://www.brettenhamprimaryschool.co.uk/ Alternative Centre of Education – 2 Plevna Road, Edmonton Green, London N9 0GB School performance The Department for Education publishes school performance data on their searchable webpages. Qualifications among adults Taken from the 2011 Census data the graph below shows the % of qualifications by population in the ward. Qualifications: The term ‘no qualifications’ describes people without any academic, vocational or professional qualifications. The term ‘lower level’ qualifications is used to describe qualifications equivalent to levels 1 to 3 of the National Key Learning Targets (i.e. GSCE’s O levels, A levels, NVQ levels 1-3). The term ’Higher level’ refers to qualifications of levels 4 and above (i.e. first degrees, higher degrees, NVQ levels 4 and 5, HND, HNC and certain professional qualifications). Produced by the Knowledge and Insight Hub 11 If you have any queries relating to this document please email KIH@enfield.gov.uk
Culture and Leisure

There is one static library in the ward, and a further two libraries just south of the ward. These libraries are:

Edmonton Green Library
Tel No 020 8379 2600

Angel Raynham Library, Raynham Avenue
Tel No 020 8807 4726

Fore Street Library
Tel No 020 8379 1717

The ward has one leisure centre, Edmonton Leisure Centre on The Broadway, Edmonton.
Tel No: 020 8375 3750

The ward has 10 parks and open spaces;
   o Salmons Brook Footpath
   o All Saints Churchyard
   o Victoria Road Garden
   o Plevna Road Open Space
   o Montagu Recreation Ground
   o Old Railway Line
   o Provident Park
   o Kenninghall Open Space
   o Craig Park
   o Pymmes Park

There are no allotments available for rent within the ward, but allotments are available just to the north of
the ward at Barrowfield Allotments, N9 0HB, and to the east of the ward at Tanners Hall Allotments, N18
1OS. For further information visit the Enfield Council website.

There are 8 places of worship within the boundaries of the ward:

   o   All Saints Church Edmonton          Tel No 020 8803 9199
   o   Chapel Point Gospel Hall
   o   Salvation Army                             Tel No 020 8345 6687
   o   Edmonton Baptist Church                    Tel No 020 8803 5831
   o   St. Mary’s Centre
   o   Edmonton Spiritual Church                  Tel No. 020 8807 2331
   o   Faith House (Christian Revival Centre)     Tel No 020 8803 8665
   o   Edmonton Methodist Church

Voluntary and Community Sector

Some locally based community organisations are given below:

   •   Stroke Action – Pymmes Park Telephone 020 8807 8023

Community House Fore Street Edmonton N9 – houses the following organisations:

   •   Enfield Voluntary Action and Enfield Volunteer Centre (EVA) provides services to voluntary and
       community organisations in Enfield. It supports and promotes their:
       o positive and sustainable development
       o participation in making decisions that affect the borough

Produced by the Knowledge and Insight Hub                                                                       12
If you have any queries relating to this document please email KIH@enfield.gov.uk
EVA's support, development, and information services consist of development and funding advice,
accountancy, training, up-to-date, information via EVAeNEWS, links to good practice, information,
reports and useful websites via Online Knowhow, good practice and networking via Volunteer Centre
Enfield, grants programmes as available on behalf of local, regional and national funders, Schools in
Partnership meetings
• Enfield Disability Action – Run by and for people with physical disabilities, sensory impairments,
mental health, learning difficulties and long-term illnesses.
o Email: eda@e-d-a.org.uk
• Every Parent and Child is a registered charity working for the benefit of children and their families
in the London Borough of Enfield.
o Website: https://www.epandc.org.uk/
• Enfield Racial Equality Council - mission is to actively promote and seek to implement a racially
just, fair and equitable society which will enhance the quality of life for all who live, work and learn in
the London Borough of Enfield
Tel: 020 8373 6271
Fax: 020 8373 6281
Email: info@enfieldrec.org.uk
Website: http://enfieldrec.org.uk/
• Federation of Enfield Residents’ & Allied Associations. Many residents belong to their local
residents’ association. FERAA is the body that represents the associations jointly, so increasing the
leverage to achieve results.
Website: http://www.feraa.org.uk/
• One-to-One Enfield is a local charity for adults with learning difficulties who live in Enfield. They aim
to enable people with learning difficulties to be actively involved in the community. They also
encourage getting out and about and making new friends.
o Website: http://www.one-to-one-enfield.co.uk/
o Tel: 0208 373 6241
• Greek and Greek Cypriot Community of Enfield - This organisation helps members of the
community by providing a number of services. These include a weekly drop-in centre, counselling,
help for carers and a home from hospital service
o Website: Greek and Greek Cypriot Community of Enfield (www.ggcce.org.uk)
o Email: enquiries@ggcce.org.uk
o Telephone 020 8373 6299
• Carers Trust Lea Valley Crossroads Care Services - provide home-based respite services to
enable carers to take a break. They provide a service tailored to meet the needs of individual
families, where trained care support workers come to the home and take on the caring role.
o Tel: 020 8373 6210
o https://www.carersuk.org/help-and-advice/get-support/local-support/crossroads-care-lea-
valley
• Enfield Saheli - (female friend) offers support and advice to women in Enfield. The charity is run by
women for women, with special emphasis on support for women of all ethnicities. They aim to
empower women to participate fully in social, cultural and civic life; provide services through trained
and friendly female staff who can speak South Asian languages by supporting women with mental
health, acute illness, disabilities, carers and also women who have experienced domestic violence.
It has a broad approach offering information, advice and guidance, access to legal and housing
Produced by the Knowledge and Insight Hub 13
If you have any queries relating to this document please email KIH@enfield.gov.ukprofessionals, counselling service by bilingual counsellors, crisis support and group support work.
For much more information on this group please visit their website or call the above number.
o E-mail: info@enfield-saheli.org.uk
o Website: http://www.enfieldsaheli.org
• Tamil Relief Centre - The Centre offers practical support in the resettlement of refuges and asylum
seekers, other immigrants and unemployed people in greater London. It provides advice and
information to enable them to access services to which they are entitled, and promotes the
education, training and
employment of refugees, ethnic minorities and disadvantaged groups/people. Education and training
are provided at Enfield Education and Training Centre, and children’s support classes are held on
Saturdays and Sundays.
o http://www.trcuk.org/
o Telephone 020 8373 6249
• Café 311 – is part of the Camden Society which runs services for people with disabilities across
London and Oxfordshire. Café 311 run the Community Café at Community House – provide
employment and training for people with learning difficulties.
• Enfield Vision: A group of visually impaired people determined to improve the environment and to
reduce the everyday problems of blind and partially sighted people.
o Further information: Enfield Vision (www.enfieldvision.org.uk)
• Enfield Turkish Cypriot Association is a voluntary non-profit making organisation offering a wide
range of service to Turkish Cypriots and other Turkish speakers living in Enfield. They provide
advice and guidance on a wide range of statutory services, including housing, social services,
education, health and availability of culturally sensitive services
o Website: http://www.etca.org.uk/
o Email: etca@enfield.wanadoo.co.uk
o Telephone 020 8373 6300
• Enfield Caribbean Association - offers information and advice to members of the Caribbean
community who may be experiencing difficulty accessing public services. The association operates
a luncheon club for the elderly, which provides a healthy hot meal, simple exercise classes, and
other social and cultural activities at the Trinity at Bowes Methodist Church between 1pm-4pm on
Fridays. The association also offers a weekly drop-in session on Thursdays between 10am-1pm to
socialise and includes exercises classes at the Community House. Members are mainly Caribbean,
but the association is open to everyone.
For further information:
o Email eca@ukonline.co.uk
o Telephone 020 8373 6352
o Website: http://www.enfieldcaribbeanassoc.org.uk/
• Enfield Healthwatch – An organisation whose role is to amplify the voices of local people on the
key issues that affect those who use health and care services.
For further information:
Email: info@healthwatchenfield.co.uk
• Enfield Somali Community Association - A non-profit making voluntary organisation established
to help the resettlement of Somali’s living within Enfield. They offer information and advice on
matters such as welfare benefits, education, health, fuel efficiency and other community
development related issues. They have an established youth and sports project and a
supplementary school. They also provide women groups, elderly and disabled groups, as well as
workshops on various community issues, basic skills training, employment and training courses and
EAL classes (when funding is available).
o Email: enfieldsom@gmail.com; Tel: 020 8373 6340
Produced by the Knowledge and Insight Hub 14
If you have any queries relating to this document please email KIH@enfield.gov.uk• Break the Cycle (BTC) is an independent peer support group for current and ex-users of drug and
alcohol treatment services. BTC also provides support to the carers and families of current and ex-
users. They also provide a women's only group on Wednesdays and group-based activities. This is a
safe environment where people with a drug or alcohol dependency can meet and get information about
specialist services available. BTC can refer people to community and specialist services if needed.
• CancerLIFE Self Support Group offering a drop-in service for people affected by cancer.
o Tel: 020 8373 6222
• Enfield Clubhouse - An organisation run by people with mental health issues for people with mental
health issues open every Wednesday and Friday. For more information:
o Email: info@enfieldclubhouse.org.uk
• Enfield Deaf Image Group (ENDIG) – represent the interests of deaf and hard of hearing people in the
borough of Enfield. ENDIG members are all deaf and aim to promote deaf awareness to statutory
services including individuals and organisations
o Email: endig@love.com
Within the Hot Desk Facility at Community House:
• Third Age Challenge Group – Turkish speaking women’s group providing information and advice –
drop in and luncheon club for more information
o Email: thirdage@ntlworld.com
• African French Speaking Organisation - AFSOR is a registered charity group set up, in May 2005, for
the benefit of disadvantaged people from Africa, francophone in particular, and in general for the benefit
of anyone from Black, Asian and Minority Ethnic (BAME) community groups. The charity aims to:
provide children, young people, adult and elderly with additional education, skills training and recreation;
raise awareness in matters regarding community social life in the UK mainly in health and safety,
housing, employment, barriers, neighbourhood, British Law, and welfare benefits.
o Email: info@afsor.org.uk
• Turkish Youths of London - Our project aims at further supporting Turkish speaking Youths and
Families as well as other nationalities through agree Secondary schools to enable families to further
educate themselves in order to be able to support their children and themselves. For more information:
o Email: chimenhussein@gmail.com
• Skills and Training Network is a professional charity which specialised in training to disadvantaged
groups especially BAME community in Computer, ESOL, basic skills, Literacy support, IAG Career
Advice and Guidance, Vocational Training, Employability, accredited and non-accredited courses.
Director – Sue Halwa
o Website http://sntnetwork.org.uk/
o Tel: 01992 848092
• Elevation Profile
Director Pauline Ehonjie
Email: elevation48@gmail.com
• Kongolese Children’s Association A registered charity that aims to promote the well-being of
children of African descent, in particular but not exclusively from Kongo Kingdom (DRX, Congo Brazza,
Angola). The main activities of our organisation are: supplementary school that offers week-end classes
Produced by the Knowledge and Insight Hub 15
If you have any queries relating to this document please email KIH@enfield.gov.ukfor children and young people (year 1 to 11) for English, maths, science, mother-tongue and cultural
education; liaison between schools and parents; music and drama club; advice and advocacy;
vocational training; health care and health and social care training; child care training.
o For further information email: bart@kongochild.com;
• Stand In The Gap (SITG) is passionate for young people to have quality of life to change their opinion
and perception about bad experiences by improving decision-making skills, self-confidence, self-
awareness and development of interpersonal development. We support young people in practical terms
to go through each workshop in a relaxed atmosphere, to access their desirable skills/talents.
o Email: chamed@standinthegap-dafc.org.uk
• Gargaar Somali Welfare Association – Information and advice available for the Somali Community
every Tuesday and Thursday
For further information email: gargaar@hotmail.co.uk
• Hope and Restoration – provides training and assistance with work placements, job searches, job
application, cv writing, employment support and after-care
For further information please contact: hopeandrestoration@gmail.com;
• British Afghan Women’s Society - This is a voluntary organisation aiming to empower and help
Afghan women. Services provided include an information service, outreach work and referrals to other
agencies.
For further information please contact: baws_uk@yahoo.com
• Cypriot Elderly and Disabled Group - A Group where older Cypriots and Cypriots with disabilities
meet in a safe and welcoming environment. We provide a luncheon club , run chair-based exercise
programmes, tea and coffee, play bingo, have health talks, arrange seaside trips and help with
translation and referring members to appropriate agencies.
For more information email: cypriotelderly@googlemail.com
• Enfield Peoples Project – provides services to people with disabilities, those living with HIV/AIDS
For further information please contact: MCBegue_2010@yahoo.co.uk
• Sisters in Islam - For young Muslim women 12+ years. Holding social and charity events, whilst also
providing a range of activities and resources, including badminton, aerobics, advice, discussion and
computer facilities
Further information tel: 020 8372 0423
• Iranian Community Service
For further information please contact: iraniancommunityservice@hotmail.co.uk;
• Edmonton Advice Centre and ILAC Care – Market Square Edmonton Green – they offer practical
support as well as advice and guidance.
Email infor@easdb.org.uk
• Craig Park Youth Centre, Lawrence Road, N18 2HN - Through interaction they aim to foster stronger
links between young people throughout the borough, which will in turn forge teamwork, greater
understanding, tolerance, self-belief and pride amongst the young people.
Further information: https://mylife.enfield.gov.uk/directory/providerdetails/211472
• O” Bay Community Trust, Fore Street, N18 2TZ - a BAME lead organisation providing generic
services to services users, members, and clients who are local residents; irrespective of their race,
colour, gender, sexual orientation or religious believes. They work and provide services on a first-come-
Produced by the Knowledge and Insight Hub 16
If you have any queries relating to this document please email KIH@enfield.gov.ukfirst-serve basis to those in need of their services, be it black or white to ensure community cohesion
and integration.
Further information: http://www.o-bay.org/
• Salvation Army, Fore Street, N9 0NU
Further information: http://www.salvationarmy.org.uk/
• The Enfield Foyer Project, Fore Street, N9 0PD - provides studio accommodation for 36 young people,
together with training, ICT and social facilities. The Foyer adopts an integrated approach to meeting the
needs of young people by linking affordable accommodation to training and employment.
Further information: https://www.christianaction.org.uk/our-yps-projects/enfield-foyer-462/
• Mind in Enfield, Fore Street, N9 0DU - Mind Enfield is a local independent charity, working in
partnership with other statutory and voluntary organisations to provide an range of services to meet the
needs of mental health service users and to challenge
For more information please contact 275 Fore St, London N9 0PD. Tel: 020 8887 1480
Additional Sources of information
For local information visit the Enfield Council website homepage: http://www.enfield.gov.uk/. Creating an
Enfield Connected account will enable you to find out about local events and services.
A collation of various data including latest best estimates is at Appendix A.
For statistics, search on the London Datastore or select profiles or data on NOMIS.
Produced by the Knowledge and Insight Hub 17
If you have any queries relating to this document please email KIH@enfield.gov.ukProduced by the Knowledge and Insight Hub 18 If you have any queries relating to this document please email KIH@enfield.gov.uk
Appendix A – Data tables
                                                                                            Borough
                                                                                                        relative %
                                                                        No           %      average no.
                                                                                                        diff
                                                                                            /%
 TOTAL:-
 POPULATION – 2019                                                    19207                     15895          21
 HOUSEHOLDS – 2011                                                     6899                      5710          21
  Owner Occupied                                                       2206          32.0        58.8         -46
  Council                                                              1610          23.3        11.4         105
  Registered Social Landlord                                           1365          19.8         6.2         219
  Private Renting                                                      1718          24.9        23.6           6
 AGE STRUCTURE – 2019
  0-4                                                                   1592          8.3          7.2         16
  5-14                                                                  3153         16.4         14.4         14
  15-24                                                                 2485         12.9         11.5         13
  25-44                                                                 5744         29.9         29.2          2
  45-64                                                                 4445         23.1         24.4         -5
  65-74                                                                 1020          5.3          7.0        -24
  75+                                                                    768          4.0          6.4        -37
 ETHNIC MIX – 2019 (Enfield Council Estimates)
 White British                                                          2991         15.7          38.3       -59
 White Irish                                                             162          0.9           1.9       -56
 Greek                                                                    67          0.3           1.2       -70
 Greek Cypriot                                                           287          1.5           4.7       -68
 Turkish                                                                2558         13.4           7.6        77
 Turkish Cypriot                                                         290          1.5           1.8       -16
 Kurdish                                                                 409          2.1           1.2        73
 White Other                                                            1413          7.4           6.7        10
 White & Black Caribbean                                                 277          1.5           1.3        15
 White and Asian                                                         190          1.0           1.1        -8
 White and Black African                                                 208          1.1           0.7        59
 Other mixed                                                             353          1.9           2.0        -5
 Indian                                                                  473          2.5           3.3       -25
 Pakistani                                                               109          0.6           0.7       -21
 Bangladeshi                                                             680          3.6           1.8       100
 Chinese                                                                 108          0.6           0.7       -22
 Other Asian                                                             907          4.8           3.6        34
 Somali                                                                 1521          8.0           2.7       192
 Black African                                                          2390         12.5           7.5        68
 Black Caribbean                                                        1720          9.0           5.2        72
 Other Black                                                             976          5.1           2.5       107
 Other Ethnic Group                                                      977          5.1           3.7        40
 RELIGION – 2011
 Christian                                                              8665         48.3         53.6        -10
 Buddhist                                                                 77          0.4          0.6        -27
 Hindu                                                                   623          3.5          3.5         -1
 Jewish                                                                   26          0.1          1.4        -90
 Muslim                                                                 5226         29.1         16.7         74
 Sikh                                                                     56          0.3          0.3        -10
 Other / not stated / none                                              3276         18.3         23.9        -24

 Produced by the Knowledge and Insight Hub                                                                           19
 If you have any queries relating to this document please email KIH@enfield.gov.uk
Appendix A – Data tables
Borough
relative %
No % average no.
diff
/%
ECONOMIC ACTIVITY in the 16-64 age group
All economically active, 2011 7419 65.0 73.4 -11
Unemployed — Claimant Count June 2021 1625 13.1 8.8 49
INCOME - 2021
Households with less than £15,000 (gross) a year 2099 28.1 15.4 82
Households claiming Universal Credit (Feb 2021) 3386 45.3 30.7 48
QUALIFICATIONS – 2011
No qualifications 3942 30.5 23.0 33
Level 1 only 1902 14.7 12.9 14
Level 2 1777 13.7 13.8 0
Level 3 1167 9.0 10.5 -14
Level 4 and above 2526 19.5 28.7 -32
HOUSING TYPE – 2011
Detached 332 4.7 7.0 -32
Semi-detached 1093 15.6 23.5 -34
Terraced 1457 20.8 31.1 -33
Flat - purpose built 3693 52.8 30.1 75
Flat - in a shared house 328 4.7 6.8 -31
Other 96 1.4 1.5 -11
CARS IN HOUSEHOLDS – 2011 - nos. of households with:
0 cars 3693 53.5 32.5 65
1 car 2479 35.9 43.3 -17
2+ cars 727 10.5 24.3 -57
HOUSEHOLD TYPES – 2011
One person 2157 31.3 27.8 12
All occupants aged 65 plus 167 2.4 5.5 -56
Married couple or civil partnership, no children 325 4.7 7.9 -41
Married couple or civil partnership, with dependent children 1057 15.3 17.4 -12
Married couple or civil partnership, all children non dependent 296 4.3 6.8 -37
Cohabiting couple, no children 134 1.9 3.4 -44
Cohabiting couple, with dependent children 213 3.1 3.0 4
Cohabiting couple, all children non dependent 31 0.4 0.4 5
Lone parent 1674 24.3 16.7 46
Other 845 12.2 11.0 11
PERSONS WITH LONG TERM HEALTH PROBLEM / DISABILITY– 2011
Limiting a lot 1425 7.9 7.3 9
Limiting a little 1563 8.7 8.1 8
GENERAL HEALTH – 2011
Very good 8082 45.0 46.8 -4
Good 6141 34.2 35.0 -2
Fair 2505 14.0 12.7 10
Bad 913 5.1 4.1 24
Very bad 308 1.7 1.3 28
LIFE EXPECTANCY (years) - 2015-2019:
Males 78.9 80.6 -2
Females 85.6 84.6 1
Standardised Mortality Ratio - 2015-2019 94.1 89.9 5
COMMUNITY SAFETY - 2020
Crime rate (per 1,000 residents) 137.9 85.2 62
Anti-social behaviour rate 92.9 50.8 83
Produced by the Knowledge and Insight Hub 20
If you have any queries relating to this document please email KIH@enfield.gov.ukSources and related notes Various measures – 2011 Census; © Crown Copyright, Office for National Statistics. NB. 2021 Census data is not due to be available until 2022/2023. Population – ONS mid-year population estimate 2019 Households – 2011 Census; © Crown Copyright Age structure – ONS mid-year population estimate 2019 Religion – 2011 Census; © Crown Copyright Ethnic mix – Council estimates for 2019; note there are difficulties in estimating ethnic group sizes at ward level and the figures given here must be treated with caution and used as a guide to the possible mix in the ward Economic Activity – all economically active 16-64 year olds = working plus unemployed – 2011 Census; © Crown Copyright, the activity rate (%) is the % of the population aged 16-64 Unemployment — the official DWP ‘claimant count’, June 2021 Income – Low income households – CACI Paycheck; 2021; © CACI Deprivation – Ministry for Housing, Communities & Local Government. Ward-level analysis by Local Government Association Children in low-income households – Department for Work and Pensions (2020) Fuel Poverty – Department for Business, Energy and Industrial Strategy (2019) Qualifications – 2011 Census; © Crown Copyright; note that this table excludes apprenticeships and ‘other’ qualifications Housing type – 2011 Census; © Crown Copyright Cars – 2011 Census; © Crown Copyright Household types – 2011 Census; © Crown Copyright Persons with a long-term health problem/disability – 2011 Census; © Crown Copyright General health – 2011 Census; © Crown Copyright Life expectancy – Public Health England, based on 2015-2019 data Crime rate – uses crime counts from the Metropolitan Police for 2020 The relative % diff[erence] is the area % divided by the Borough % (expressed as a % above or below the Borough average) We welcome your feedback on this Ward Profile. Please send any comments or suggestions to: KIH@enfield.gov.uk Produced by the Knowledge and Insight Hub 21 If you have any queries relating to this document please email KIH@enfield.gov.uk
You can also read