WE TRANSFORM VISIONS INTO PLASTIC SOLUTIONS - Investors Presentation Autumn 2021 - Polytec Group
←
→
Page content transcription
If your browser does not render page correctly, please read the page content below
WE TRANSFORM VISIONS      Autumn 2021

 INTO PLASTIC SOLUTIONS
Investors Presentation

POLYTEC AT A GLANCE

                                              Technology-independent
                                              developer and manufacturer of
                                              high-quality plastic solutions
                                              Automotive and
 ~3,600      522 MIO          35 YEARS
 EMPLOYEES   SALES REVENUES   OF EXPERIENCE   non-automotive industry

 2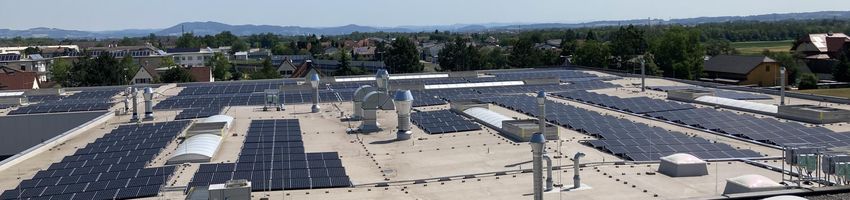
LOCATIONS

PRESENT ON 4 CONTINENTS             CHINA
17 X IN EUROPE
 1 X IN ASIA
 1 X IN AMERICA
 1 X IN AFRICA

                    USA

                     SOUTH AFRICA

   3
STRATEGY

               1                            2                          3
       Strengthening of the          Development of new          A focus on customer
     market position in Europe   technologies and applications         benefits

 4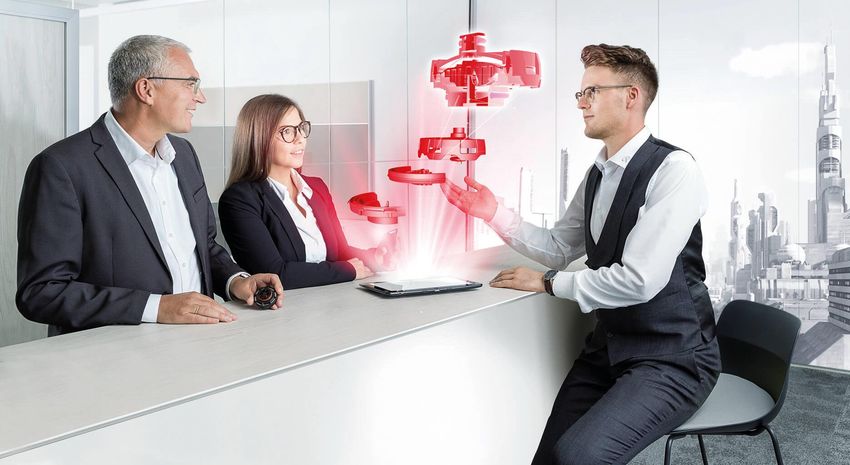
TECHNOLOGICAL DIVERSITY
INJECTION MOULDING                      COMPOSITES                          SMALL SERIES TECHNOLOGIES PRE- & POST-PROCESSING
2k injection moulding                    Production of glass fibre SMC       Class-A paint coating                 Just-in-Sequence-Delivery
Multi-component injection                Production of carbon fibre SMC      PUR RRIM / RRIM Lightweight           Tool making
  moulding                               SMC/LFT/GMT compression moulding    PUR rigid / semi-rigid                Mechanical engineering
Assembly injection moulding              UD-Tape application                 PUR-processing (moulding parts)       (multi-component dosing system)
WIT (water injection technology)         Hybrid compression moulding         PUR spraying                          Testing & Validation
GIT (gas injection technology)             (LWRT-LFT)                        PUR casting                           Trimming & Cutting
PIT (projectile injection technology)    Wet pressing                        PUR foaming                             (milling, laser, water jet)
In-Mould-Decoration                      In-Mould-Coating                    Blow moulding                         Joining & Welding
Injection-Moulding-Compounding           In-Mould-Painting                   Processing of metal & premium steel     (hot gas, ultra-sonic,…)
High-gloss technology

Up to 4000 tons clamping force           Up to 4300 tons clamping force      Up to 630 tons clamping force

      5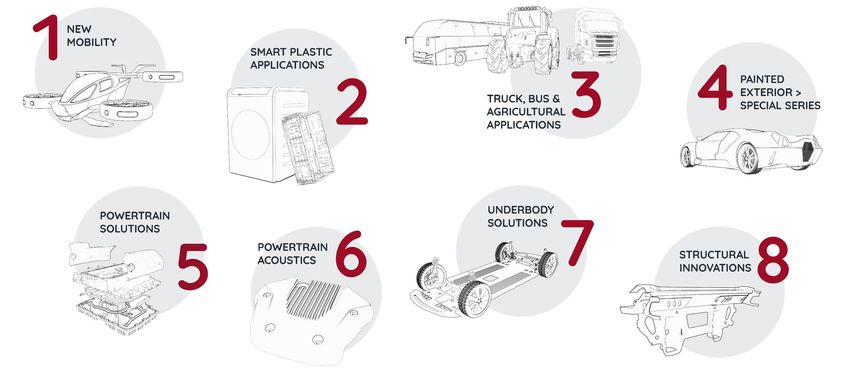
POLYTEC PRODUCT LINES

 6
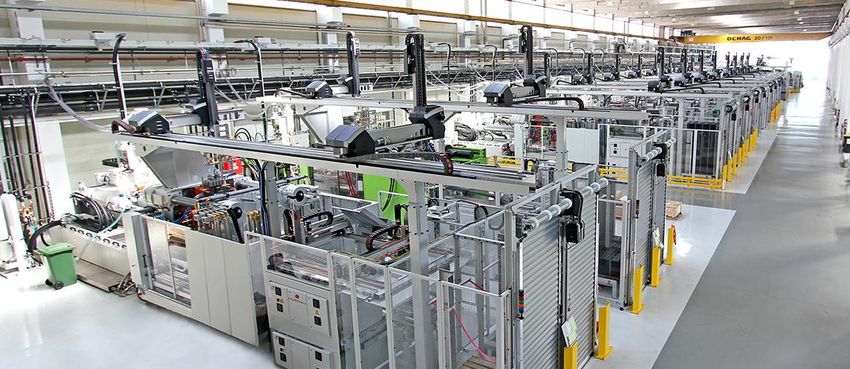
INVESTING IN NEW PLANTS
▪ Tianjin (PRC)    ▪ Telford (UK)   ▪ East London (RZA)

                                                  SOP HY2 2021

  7
FINANCIALS
2020 FY
FINANCIAL FIGURES
SALES REVENUES, EARNINGS, EQUITY

 676,4    636,4   627,1   522,0

 2017      2018   2019    2020

      Turnover

  9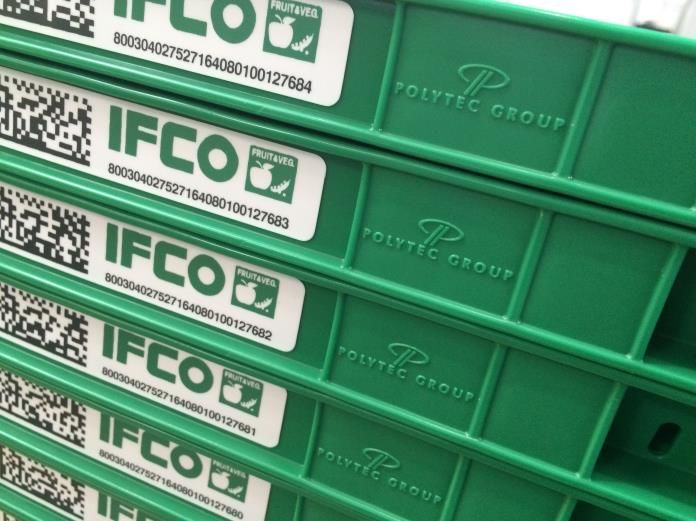
SALES REVENUES BY CUSTOMERS 2017–2020 FY

 10
SALES REVENUES SPLIT 2020 FY

                   etc.
                                  Passenger Cars &
                                  Light Commercial Cars
                                  Commercial Cars
             14.4%                Smart Plastics &
                                  Industrial Applications

          22.6%
                          63.0%       2020 FY        Exterior

                                      13%            Powertrain
                                   14%               Interior
                                            40%
                                   3%                Structure
                                    6%
              et                        24%          Industrial Applications
              c.                                     Tooling

  11
FINANCIALS H1 2021
KEY FIGURES H1 2021 (VS H1 2020)

▪    Sales revenues EUR 291.7 million (H1 2020: EUR 242.3 million)
▪    EBITDA EUR 24.2 million (H1 2020: EUR 10.7 million)
▪    EBITDA margin 8.3% (H1 2020: 4.4%)
▪    EBIT EUR 10.1 million (H1 2020: EUR –7.0 million)
▪    EBIT margin 3.5% (H1 2020: –2.9%)
▪    Earnings after tax EUR 6.8 million (H1 2020: EUR –8.9 million)
▪    Earnings per share EUR 0.30 (H1 2020: EUR –0.42)
▪    Equity ratio 44.2% (H1 2020: 40.0%)
▪    Net debt EUR 121.2 million (H1 2020: EUR 153.4 million)
▪    Employees (FTE incl. leasing personnel) as at 30.06.2021 3,708 (30.06.2020: 3,870)

    13
OUTLOOK 2021 FINANCIAL YEAR The POLYTEC GROUP management continues to anticipate consolidated sales revenues of about EUR 575 million for the 2021 financial year. On the basis of a reassessment of current risks, EBIT is likely to amount to around EUR 30 million. Nonetheless, the realisation of this outlook is prone to a number of significant uncertainties. In particular, the drastic increases in raw material prices, which already had a considerable impact upon the result for the second quarter, will again constitute a considerable risk to profitability in the second half-year. In this connection, the current negotiations with customers regarding compensation for the price rises are of vital importance to the realisation of the outlook forecasts. A continuation of the short-term reductions in automotive call-offs beyond the summer months, shortages of raw materials – in particular electronic chips – as well as the repeated disruptions to production, would also have an additional impact upon results. In addition, the possible negative effects of the corona epidemic on consolidated sales revenues and the operative result further complicate the outlook. 14
SALES REVENUES, EBIT MARGIN – QUARTERLY

                                                                                                in EUR m

                                                                 147,8           143,9
                                                142,5
                                137,1

                                                        13,4%

               93,2
                                                                         4,5%
                                                                                         2,4%
                                        0,6%

                      -10,4%

              Q2 2020          Q3 2020         Q4 2020          Q1 2021         Q2 2021

 15
EBITDA, EBITDA MARGIN – QUARTERLY
in EUR m
19,4%
27,7
9,3%
7,2% 13,8 7,3%
9,9 10,4
-1,0%
-1,0
Q2 2020 Q3 2020 Q4 2020 Q1 2021 Q2 2021
16EARNINGS FIGURES – QUARTERLY
EARNINGS AFTER TAX in EUR m
EPS in EUR
19,8
EARNINGS PER SHARE
4,8
0,79
2,1
0,21 0,09
Q2 2020 Q3 2020 Q4 2020 Q1 2021 Q2 2021 Q2 2020 Q3 2020 Q4 2020 Q1 2021 Q2 2021
-1,5 -0,48 -0,08
-10,3
17NET DEBT, GEARING – QUARTERLY
Net debt in EUR m
153,4 157,1
116,8 121,2
105,8
0,64 0,66
0,43 0,46 0,47
Q2 2020 Q3 2020 Q4 2020 Q1 2021 Q2 2021 Q2 2020 Q3 2020 Q4 2020 Q1 2021 Q2 2021
18EQUITY, EQUITY RATIO – QUARTERLY
256,9 in EUR m
254,9
247,5
238,3
237,1 43,6% 44,2%
42,6%
40,5%
40,0%
Q2 2020 Q3 2020 Q4 2020 Q1 2021 Q2 2021
19ESG – SUSTAINABILITY
STRATEGIC ENVIRONMENTAL OBJECTIVES

       RESOURCE CONSERVATION
       ▪ Reduced consumption of natural resources through focus on lightweight construction
         and functional integration
       ▪ Increased use of recycled materials

                       ENHANCED ENERGY EFFICIENCY
                       ▪ Use of modern and environmentally friendly equipment
                       ▪ Installation of highly efficient heat recovery systems
                       ▪ Consistent use of sustainable LED lighting

                                      REDUCED ENVIRONMENTAL EMISSIONS
                                      ▪ Increasing the share of energy from renewable sources
                                      ▪ Investment in photovoltaic systems

 21
POLYTEC ENERGY AND ENVIRONMENTAL TARGETS
Target definition Dimension Key indicator
Strategic objective: Resource protection
Reduction of raw material consumption through an improvement in the reject ratio 15% by 2023 kg/kg
Increase in the recycling share through project realisation minimum 2 projects p.a. number completed pro.
Strategic objective: Increased energy efficiency
Reduction in energy consumption (base load) 20% by 2025 kWh/EUR k
Reduction in electricity consumption due to compressed air leakages 50% by 2025 kWh/EUR k
Equipping of all plants with energy monitoring realisation by 2025 number of plants
Strategic objective: Environmental emission minimisation
Establishment of monitoring for carbon footprint (CFP) and reduction (Scope 1 and 2) 20% by 2025 %
Reduction in waste quantities through improvement of the reject ratio 15% by 2025 %
Increase in the share of recyclable waste through improved waste sorting 0.75%/year & 8% by 2025 %
Uniform hazardous material management realisation by 2022
Development of innovative products (e. g. lightweight design), which through their use minimum 2 projects p.a. number completed pro.
reduce environmental emissions
22CO2 NEUTRAL PLANT IN EBENSEE (AUSTRIA) 23
PLANT EBENSEE

▪    Ground area: 82,000 m2
▪    Buildings: 34,000 m2
▪    Personnel: 187 (152 + 35 leasing p.)
▪    Automotive products, e. g. for trucks
▪    Logistic boxes (food retail)

    24
RECYCLING OF IFCO LOGISTIC BOXES IN THE PLANT
▪ The recycling facility was agreed in the course of
the IFCO supplementary order
▪ Returned damaged boxes are granulated
▪ Ground polypropylene plastic is temporarily
stored in silos
▪ On demand, the PP is conveyed to the moulding
machines and processed again into new boxes
+ Conveyor belt with metal detector
+ Cutting mill for wet material
+ Friction separator
+ Separator containers
+ Drainage screw
+ Mechanical drier
+ Material transport into the silos after dedusting
+ Mechanical process water treatment
+ Extended water treatment (possible expansion project)
25POLYTEC PHOTOVOLTAIC PROJECTS
▪ Electricity from renewable energy sources will make a
significant contribution to CO2-neutral production at POLYTEC.
Plant Wolmirstedt (DE)
▪ POLYTEC already covers a large part of its electricity needs
with green electricity (100% in AT).
▪ Furthermore, suitable roof surfaces of the POLYTEC sites will
be equipped with photovoltaic systems from 2021.
Plant Lohne (DE) – Symbol photo
Plant Hörsching (AT)
26ESG RATINGS BY GAIA & VIGEO ERIS
Benchmark
27APPENDIX
EARNING PER SHARE, DIVIDENDS 2006 – 2020
                                                                EPS in €
                                                                DPS in €

                  DIVIDEND POLICY
                  ▪ based on profitability
                  ▪ strategic growth perspectives
                  ▪ capital requirements of the POLYTEC GROUP

 29
SHARHOLDER STRUCTURE – RESEARCH COVERAGE
1,50%
29,04% Price
Institute (as at 16.08.2021) Rating
target
BAADER-Helvea Research, Munich BUY EUR 16.0
ERSTE Group Research, Vienna BUY EUR 14.8
M.M.Warburg Research, Hamburg BUY EUR 16.0
69,46%
Raiffeisen Research, Vienna BUY EUR 13.5
Average price target EUR 15.1
Free float Huemer Group Treasury Shares
30POLYTEC SOLUTION FORCE
Bundling of competences from the
entire POLYTEC GROUP:
▪ Technology and manufacturing expertise
of the various locations
▪ High degree of value added
▪ Innovative strength from product and
material development
▪ Profound market understanding
31MAIN APPROACHES OF THE POLYTEC SOLUTION FORCE PERFORMANCE IN PLASTICS POLYTEC is a lightweight construction specialist. FUNCTIONAL INTEGRATION POLYTEC develops multifunctional products. ECONOMIC AND COST EFFICIENCY POLYTEC optimises the product and its manufacturing process. USER ORIENTATION POLYTEC thinks of the product users‘ needs. 32
AUTOMOTIVE MARKET
H1 2021
NEW PASSENGER CAR REGISTRATIONS IN EUROPE
JAN-AUG 2021 (COMPARED TO THE SAME PERIOD OF THE PREVIOUS YEAR)
                                             EU: 6 807 706 (+683 651) +11.2%

                                             ▪ In August 2021, car registrations across the European Union
                                               decreased by 19.1% to reach 622,993 units.

                                             ▪ August performance of EU’s largest markets:
                                               France -15.0%, UK -22.0%, Germany -23.0%, Italy -27.3%, and
                                               Spain -28.9%

                                             ▪ „Big 5“ YTD
                                                  1. GE: 1 820 589 +2.5%
                                                  2. FR: 1 126 543 +12.8%
                                                  3. UK: 1 101 302 +20.3%
                                                  4. IT: 1 060 182 +30.9%
                                                  5. ES: 588 314 +12.1%

                                               Source: ACEA

   34
REGISTRATIONS of NEW CARS in international markets 35
REGISTRATIONS of NEW CARS in Europe (EU, EFTA & UK)

  36
REGISTRATIONS of NEW CARS in Europe (EU, EFTA & UK)
BY DRIVE TECHNOLGY

  37
REGISTRATIONS of NEW COMMERCIAL VEHICLES
in Europe (EU, EFTA & UK)

 38
MAKE YOUR NOTES

 39
CONTACT:
POLYTEC Holding AG
Mr. Paul Rettenbacher – Investor Relations Manager
E-Mail: paul.rettenbacher@polytec-group.com

                                                     https://www.polytec-group.com/investor-relations/news
You can also read