Web-based Interactive Visual Exploration of Dota2 Encounters - CESCG
←
→
Page content transcription
If your browser does not render page correctly, please read the page content below
Web-based Interactive Visual Exploration of Dota2 Encounters
                                               Wilma Weixelbaum*
                                         Supervised by: Krešimir Matković†

                                                       TU Wien
                                                    Vienna / Austria

Abstract                                                       competitive. They are designed to take place in a limited
                                                               space that basically looks the same for every game, just
In the last decade, the popularity of ESports has grown        like the board of a board-game stays the same. In the case
rapidly. The financial leader in the tournament scene is       of Dota2 the map is split diagonally between the Radiant
Dota2, a complex and strategic multiplayer game. The           side and the Dire. There are two teams with five players
driving force behind a Dota2 match are encounters or           each and every player picks a character, also called hero or
teamfights between the two teams, which are often game         champion for the match. Ultimately, the goal is to destroy
deciding. Especially during a Teamfight, analysis is a chal-   the enemy team’s base. In order to do so, opposing heroes
lenging task due to the many actions and interactions be-      engage in combat with each other. It is necessary to fight
tween players. Available resources include the combat log,     and function well as a team to defeat the enemy heroes and
which logs every event at an atomic level, featuring great     emerge victorious from encounters. An encounter is called
detail at the cost of readability, as well as concise third-   Teamfight if the majority of heroes are involved in it. Dur-
party summaries that provide very little detail. What is       ing the fight, the heroes have several options to defeat the
missing is a middle ground that provides both a better rep-    opposing team such as e.g. attacking them with the stan-
resentation of details and meaningful aggregations when        dard attack, using abilities that are unique to each hero or
it comes to Teamfights. This work therefore proposes a         using items that can be obtained during the game. There
web-based visualization of the combat log focusing on in-      are many factors that influence the outcome of a fight rang-
teractions between players by using a directional graph.       ing from ability and item builds over positioning and com-
The result is Dota2 Rumble Flow, an interactive visualiza-     munication to raw player skill. But what ultimately kills a
tion for interaction-based Teamfight analysis, with higher     hero is the damage that was taken. Damage has three dif-
granularity than a summary and better readability than an      ferent types: physical, magical and pure damage and will
atomic log file.                                               affect the champions differently. Those with high armor
Keywords: Interactive Visual Exploration of Teamfights,        take less physical damage but might be prone to magical
Graph Visualization, MOBA Game, Dota2                          damage if they lack magic resistance. Pure damage on the
                                                               other hand ignores armor as well as magic resistance. It is
                                                               therefore interesting to know how much damage of which
1     Introduction                                             type was dealt and also where it came from. Upon death
                                                               a hero loses Gold while the enemy heroes that contributed
Similar to traditional sports, professional ESports teams      to the kill earn Gold. Since heroes die on both sides, the
are competing in tournaments of varying size all around        criteria to win a Teamfight is to earn more Gold from it
the globe with millions of spectators watching and follow-     than the other team.
ing their progress [7]. The ESport scene is still expanding    Looking at a Dota2 match from a viewers perspective, it
and can nowadays even be compared to sports like soc-          features a dramatic arc and tension which comes from the
cer, basketball or football. It is even more popular and       inevitable conflicts between the teams and their uncertain
established in Asia compared to the Western world [1].         outcomes[2]. Teamfights are consequently an important
For example, the annual Dota2 tournament The Interna-          part of the game in order to win and are also very excit-
tional (TI) with a combined value of 34,330,069.00 USD         ing for spectators to watch. Thus they create motivation
in 20191 has been in the same ballpark regarding tourna-       to look further into them. Teamfight summaries and the
ment prize pools of sports tournaments for years and easily    like of it are quite common, but they often neglect the time
overtakes others in this domain. Dota2 is a popular Multi-     aspect and contain mostly aggregated statistical informa-
player Online Battle Arena (MOBA) game. These games            tion. Visualizing this type of information is a common
typically feature very strategic gameplay and are highly       demand in order to increase readability and communicate
                                                               the data in a clear way[8]. In this paper, we introduce the
    * w.weixelbaum@outlook.com
    † matkovic@vrvis.at                                        Dota2 Rumble Flow, an interactive graph visualization that
   1 https://www.esportsearnings.com/tournaments,              is designed to help Teamfight analysis based on interac-
February 2021

      Proceedings of CESCG 2021: The 25th Central European Seminar on Computer Graphics (non-peer-reviewed)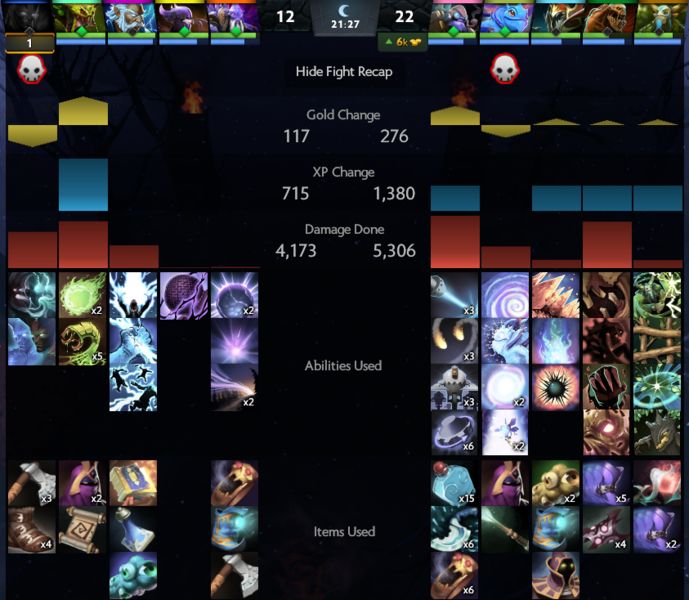
tions between players. It efficiently fills the gap between
detailed game logs, which are difficult to understand, and
aggregated summaries, which often do not provide enough
details for in-depth analysis.
2 Related Work
Visual analysis of sports has become increasingly popular
recently. Du and Yuang [3] provide an overview of visual-
ization and visual analysis of competitive sports. Another
survey on visual analytics for sports is provided by Perin
et.al [5]. Visualization approaches for dynamic graphs are
discussed in the book ‘Visualizing Graph Data’ by Corey
Lanum [4]. When it comes to logging actions, ESports
offer an advantage over traditional sports because log-
ging can be easily implemented. Since we are focusing
on Dota2 in this paper, we will give a brief overview of
data visualization and analysis tools for Dota2 data that Figure 1: Dota2 Fight Recap
are available online.
Teamfight summaries exist on various platforms and
roughly capture what happened during a Teamfight. The
Dota2 Fight Recap (see figure 1) is shown in game dur-
ing a match to be viewed by players and spectators. First
and foremost it shows the three most important variables:
Gold, Experience and Damage. By displaying the values
aggregated for every player as well as for the team the
winners of a Teamfight can easily be recognized. Addi-
tionally, events like Hero Deaths are shown by displaying
a skull icon directly underneath the hero picture. Lastly,
the Fight Recap shows which and how often abilities and
items were used by the players. The Fight Recap is usually
shown while a game is still going, it is therefore convenient
to only show information that can be processed quickly by
humans. By summarizing the most important values and
providing an aggregated view of the impacts made by each Figure 2: Teamfight Summary in opendota
hero, the Fight Recap efficiently conveys this information
to players and spectators. What the Fight Recap does not
show is temporal information. It cannot show when or to figure 3) and shows one hero only. The third shows how
whom damage was dealt, it does not distinguish between much damage was dealt by a hero, distinguishing between
different damage types and damage from items, abilities or standard attacks, items and abilities, also limited to one
standard attacks. There is also no information about heal- hero. The Dotabuff Combat Tab gives a whole lot of sta-
ing. The same is true for the opendota Teamfights View tistical information which is shown in tables with visual
(see figure 2) which is essentially a more detailed Fight cues. There is a bigger focus on the interactions compared
Recap, by extending it with information about healing and to the Teamfight summaries, but it does not convey the
the Teamfight’s location. information of who dealt damage to whom, in a certain
The Dotabuff Combat Tab is basically a web-based anal- time frame, for each hero simultaneously, as this is hard to
ysis tool consisting of components. The scope stretches show in a table additionally to all the other aggregations.
over the whole game and thus the focus is not on isolated This also makes the Combat Tab a bit harder to read. Fur-
Teamfights, but information is offered in finer granular- thermore, it is not entirely for free, it is available only for
ity too by e.g. distinguishing between damage types and professional matches or matches of users with a Dotabuff
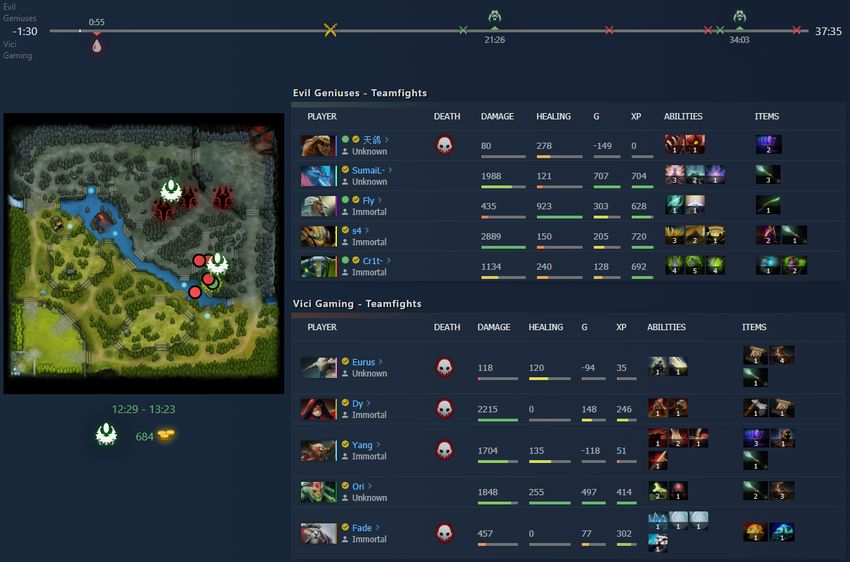
giving information about Crowd Control. The first com- Plus subscription.
ponent is a summary of combat statistics, i.e. cumulative Another subscription service is Dota Plus. With the sub-
damage and healing, duration of crowd control, incom- scription one gains access to the Death Summary (see fig-
ing and outgoing. The second component shows which ure 4) amongst others. As the name suggests, events and
abilities and attacks were used by each player and whom effects that killed a hero are summarized. It shows how
they were used on. It is called Combat Breakdown (see much damage was dealt to a hero as well as its source
Proceedings of CESCG 2021: The 25th Central European Seminar on Computer Graphics (non-peer-reviewed)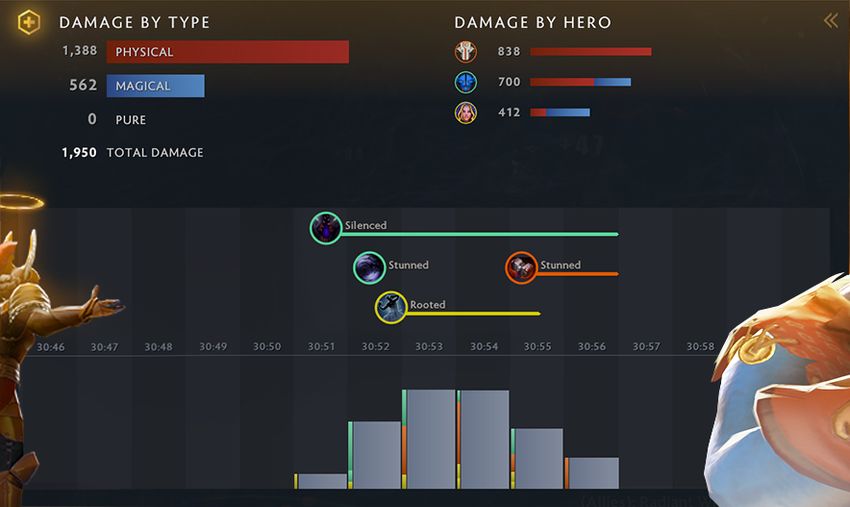
These so-called replays can be downloaded from platforms
                                                                 like opendota3 , which also provide information on e.g. the
                                                                 timeframes of Teamfights in a match. By parsing a replay
                                                                 e.g. with the open source parser Clarity4 one can access
                                                                 match data in high granularity.
                                                                    Several questions arise when analyzing Teamfights. Ba-
                                                                 sic ones would be, e.g., how much damage was dealt to a
                                                                 hero, how much was received, what type did the damage
                                                                 have and did it come from abilities, items or standard at-
                                                                 tacks, what about healing, etc. By going a bit deeper, we
                                                                 can also look at the progression of damage, e.g. see when
                                                                 a hero joined or left the Teamfight, when a hero was killed
                                                                 and by whom, if there are sudden bursts, if it was a long
                                                                 exchange of blows, also what hero was focused when by
Figure 3: Dotabuff Combat Tab, Combat Breakdown and
                                                                 whom, if someone switched targets, etc. in order to better
Damage Timeline
                                                                 determine if the right decisions were made by the players.
                                                                    By visualizing the interactions between the heroes dur-
                                                                 ing a Teamfight, not only can these questions be answered,
                                                                 but this also adds on to existing summaries by showing the
                                                                 context of the aggregated values in relation to the other
                                                                 heroes.
                                                                    The interaction data is obtained from the parse and are
                                                                 basically a collection of ’events’. Every event has a times-
                                                                 tamp and a type. While there are many different types
                                                                 of events, Damage, Critical Damage, Healing and Death
                                                                 are those that interest us. While Death events feature a
                                                                 Source and a Target, the former three event types addition-
                                                                 ally have an Inflictor, a value, as well as the damage type if
                                                                 available. Source and Target correspond to heroes, while
Figure 4: Dota Plus Death Summary, snippet from                  the Inflictor contains the information whether an ability,
https://steamcdn-a.akamaihd.net/apps/                            item, or standard attack caused the event. The value indi-
dota2/images/plus/bg_death.png as promoted                       cates how high the damage or healing dealt was and the
on https://www.dota2.com/plus, February 2021                     damage type distinguishes between physical, magical, and
                                                                 pure damage.

(standard attack, ability, item) and what status effects were
involved. Another aspect that the Death Summary brings           4      Visualization Design
to the table is the depiction of time. It shows at which
time damage was dealt and during which timeframe sta-            Existing Teamfight summaries do a great job at answer-
tus effects were active. Even though the raw information         ing overall questions regarding a Teamfight. Especially
behind the Death Summary is very rich and detailed it is         with subscription services from Dotabuff or Dota Plus a
also easy to understand. Even so, only players with the          lot of insight can be gained from match and combat anal-
Dota Plus subscription have access to this visualization         ysis. But the summaries give relatively few information
therefore they cannot view the Death Summaries of fel-           about the progression of the fight. They show what hap-
low players but only their own. It therefore also lacks the      pened, but not really when it happened. Detailed informa-
display of all the heroes at once.                               tion can also be viewed for one hero at a time. We were
                                                                 looking for a possibility to show interactions, i.e. damage
                                                                 and healing events for all heroes at once. This is possi-
3     Data and Tasks                                             ble by preserving the timeline of a Teamfight, which also
                                                                 enables us to look at the progression of the fight. We pro-
Thanks to the digital nature of ESports a lot of high qual-      pose an interactive graph based visualization: The Dota2
ity data is available, because it can be treated as if it were   Rumble Flow (see figure 5). The Rumble Flow is first and
collected from a lab-like environment[6]. Practically ev-        foremost a node link diagram. The nodes of the graph
erything that happens during a match of Dota2 is logged          correspond to the heroes, the links to damage or healing
and stored into a demo file that uses the Protobuf2 format.          3 https://www.opendota.com/,     February 2021
    2 https://github.com/protocolbuffers/protobuf,                   4 https://github.com/skadistats/clarity,          February
February 2021                                                    2021

     Proceedings of CESCG 2021: The 25th Central European Seminar on Computer Graphics (non-peer-reviewed)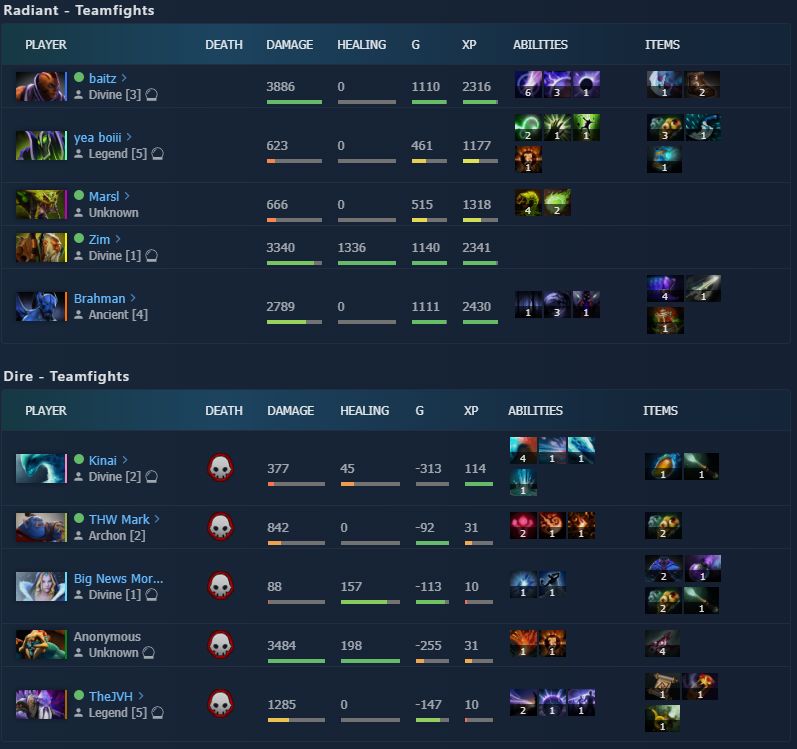
heroes were killed by whom. Lastly, the buttons at the
                                                                  bottom enable the user to walk through the fight bit by bit,
                                                                  which is also called time-based filtering [4]. With the de-
                                                                  fault options of one, three, and ten seconds, timeframes
                                                                  can be selected in varying granularity. For the selected
                                                                  timeframe the corresponding parts of the bar chart and
                                                                  timeline are shown in red color. With the help of the bar
                                                                  chart and the skulls to navigate through the Teamfight, the
                                                                  busiest parts of it can be easily identified. Damage bursts,
                                                                  target switches made by the heroes and the moments when
                                                                  the heroes joined the fight can then be explored in greater
                                                                  detail in the node-link diagram.

                                                                  5    Implementation
                                                                  To implement the Rumble Flow, we had to gather the data
Figure 5: The Dota2 Rumble Flow, a node-link diagram              first. We fetched the images from liquipedia5 and open-
with time controls at the bottom, filter at the side              dota6 . We modified the Clarity Replay Parser7 which is
                                                                  written in Java to generate JSON files with the extracted
                                                                  events. To save disk space we only stored the events that
events. To distinguish between the teams, the borders of          occured during a Teamfight. The information on how
the nodes are color coded consistently with Dota2’s color         many Teamfights were in a match and when they took
scheme of Dire (red) and Radiant (green). Since a regu-           place was fetched from the opendota API8 . From there we
lar Dota2 match is always played with ten heroes, there           also extracted general information i.e. what heroes were
are exactly ten nodes, incidentally keeping the graph clear       picked for the match. We used a PostgreSQL database
and clutter free. The links are weighted with either the          to access the data from our Django web application. For
damage or healing value. The link label contains the exact        the frontend we used React to structure the interface in
amount as well as the directional information of a link.          combination with the D3.js library which was used for the
   With this setup, it is possible to view the interactions for   timeline and bar chart as well as the node link diagram.
all heroes at once, that happened in the same time frame.         Based on the data it was clear that damage could flow be-
Looking at the red links in figure 5 we can see that there        tween two nodes in either direction, which is why we im-
are in fact two isolated encounters happening at the same         plemented the links as arcs in D3. The width of the links
time. While Huskar, Dark Seer, Venomancer and Lone                corresponds to the value of the events that it represents.
Druid are involved in the actual Teamfight, Anti-Mage and         Therefore we decided to put the directional information
Ogre Magi only have a short and quick exchange of blows           into the link label, in order to avoid huge arrows. The li-
apart from the others. Looking at Huskar we see that his          brary also supports force fields which help to arrange the
main damage output focuses on Lone Druid, but he also             nodes initially, but they can be dragged around as well.
inflicts a lot of damage upon himself. With conventional
Teamfight summaries that only show one cumulative value
for hero damage, there is no differentiation between self-        6    Evaluation
inflicted damage and damage inflicted on enemies. By
                                                                  In order to evaluate the visualization, we conducted inter-
showing and accumulating events as links between nodes,
                                                                  views within the scope of a short user study of five partic-
the Rumble Flow therefore adds context to a Teamfight
                                                                  ipants. As the visualization is primarily made for Dota2
summary. The Dota2 Rumble Flow also enables filtering
                                                                  players, all participants have played the game before, al-
between damage types and Sources (see figure 5), to help
                                                                  though the degree of expertise varied.
determine which combinations of these factors represented
                                                                     First we asked the users if they analysed their matches
the biggest problems for each hero.
                                                                  in the past and about their approach when they do so.
   Below the node-link diagram the time controls are lo-          Aside from looking at match summary information that
cated. The module consists of five connected components           can be viewed directly in the game client after a match
which are a bar chart, indicators for hero deaths, a time-        is concluded, they were all familiar with either Dotabuff
line, buttons to go forward and backward in time and the
                                                                     5 https://liquipedia.net/commons/Main_Page, March
label for the current selected timeframe. The bar chart is
located above the timeline and shows the overall damage           2021
                                                                     6 https://github.com/odota, March 2021
ouptut for each second during a Teamfight. Skull sym-                7 https://github.com/skadistats/clarity,    March
bols at the bottom of the bars indicate that a hero died at       2021
this point in time. Hovering above the icons shows which             8 https://docs.opendota.com/

     Proceedings of CESCG 2021: The 25th Central European Seminar on Computer Graphics (non-peer-reviewed)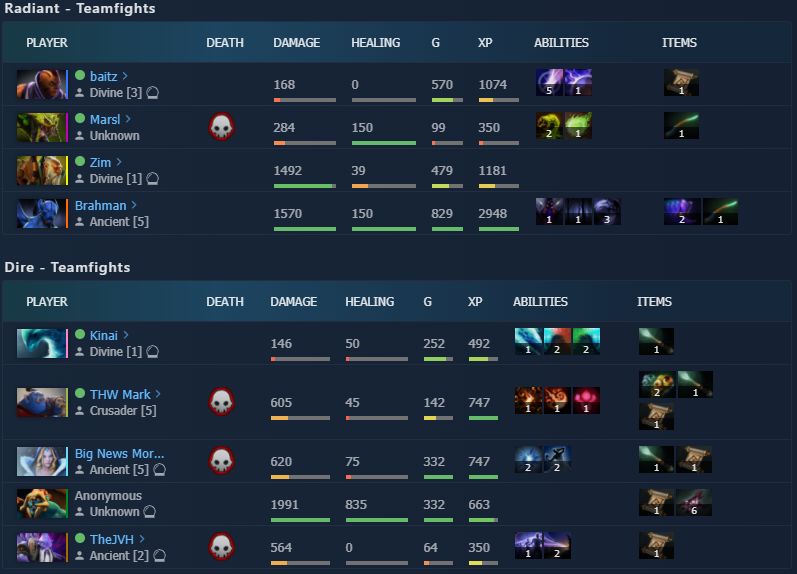
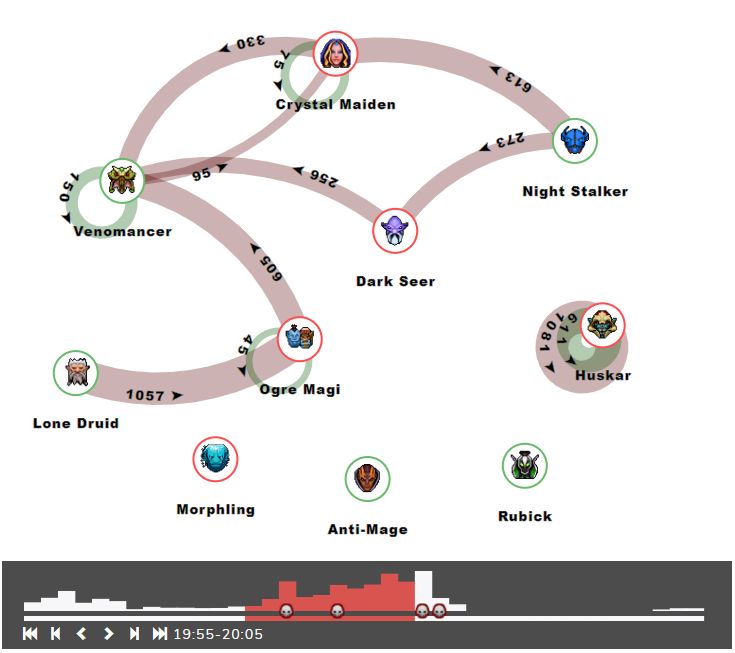
6.2 Scenario: Huskar’s impact
Another interesting Teamfight can be seen in Figure 7.
It shows an opendota Teamfight summary and a Rumble
Flow snippet of the same Teamfight. We asked how many
heroes participated in the fight and which heroes had the
most impact. Based on the summary, the answers were
always: nine heroes with Huskar, Night Stalker and Lone
Druid as the most impactful heroes, because of their dam-
age and healing output. But by exploring the Teamfight
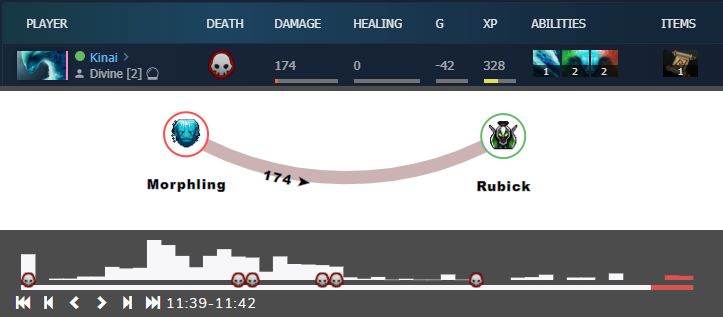
Figure 6: Above: Information on the hero Morphling as with Rumble Flow, smaller numbers of heroes that fought
shown in the opendota Teamfight summary. Below: The in the Teamfight were reported. Two participants said
Dota2 Rumble Flow displaying that Morphling dealt dam- eight heroes were in the fight. The other three divided
age only after he died at the beginning of the fight as he the information further and said it was six plus two, be-
had to wait to respawn. cause they saw two distinct fights. Basically they found
out that Huskar did not participate in the fight at all and
only dealt a lot of damage and healing to himself at the
or opendota and used those platforms for additional infor- time. Huskar is therefore shown in the summary as the
mation. But depending on the analysis task statistics and hero with the most damage and healing output. All partic-
summaries sometimes are not enough. Four out of five ipants stated, that the information from the summary was
participants have therefore also downloaded and watched misleading, because once again, the hero’s actions were
replays in the past in order to analyse the actions of them- not related to the actual fight. Even more so, he did not
selves and their teammates in greater detail. In that case, even partake, but was perceived as having had the most
the participants reported that they usually look for specific impact on the Teamfight. This highlights the importance
moments which are often Teamfights. When analysing a of context when looking at the heroes’ actions, which is
Teamfight this way, they pay attention to the participants not provided by high level summaries.
of the fight, especially their positioning, when someone
joined or abandoned the fight, who focused whom as well
as item and ability usage. 6.3 Scenario: Dire’s loss
After this first part of the interview, the participants We also let the participants analyse a whole Teamfight
were given several tasks to solve with the help of the with the information from both opendota and the Rumble
Rumble Flow and/or the opendota Teamfight summary. Flow (see Figure 8). For this task we selected a Teamfight
The more experienced players were able to extract a lot with significant impact, i.e. the game was pretty level be-
of information from the summaries and make some as- fore the fight and put the winning team into quite a lead
sumptions about the Teamfights, but due to the limitations after it. The questions we asked focused on the reasons
of high level summaries, those assumptions sometimes behind the outcome and engaged the participants to find
turned out to be quite false. While we used two matches explanations for them. The Teamfight summary gave the
and five Teamfights, we want to emphasize the following users a quick overview of the aftermath, as all participants
three scenarios. immediately saw that the whole Dire team was defeated.
Two out of five stated that the Dire did not or could not
use important abilities on some heroes and all participants
6.1 Scenario: Morphling’s damage made guesses about how the fight has played out. By ex-
ploring that same Teamfight with the Rumble Flow, they
Figure 6 shows summarized information from opendota were able to draw more conclusions. The participants were
for the hero Morphling as well as a selected timeframe interested in who joined the fight when and who was fo-
from the Rumble Flow. Based on the information from cused i.e. who received a lot of damage by enemy heroes.
opendota all participants assumed that Morphling dealt a With this information, the participants argued, that Dire
little bit of damage before he died. By hovering over the lost the fight, because one of their main damage dealers
skull symbols in the Rumble Flow, they quickly found out (Morphling) was defeated before the rest of team Dire
when the hero died, which was in the first second of the joined the fight. They discovered that Morphling was en-
fight. All five participants looked for Morphling’s outgo- gaged by the Radiant team for thirteen seconds before he
ing damage links at the beginning of the fight, but by ex- died and the other Dire heroes joined the fight one after an-
ploring the rest of the Teamfight with the time controls, other, once Morphling had already been killed. Team Dire
they saw that Morphling’s damage was in fact dealt at the died in the same order as they joined the fight. Based on
very end of the fight. Three out of five users felt that the these insights, four out of five participants said that Dire
information from the summary was misleading, because should not have joined the fight after Morphling died. All
the hero’s actions were not related to the actual fight. agreed that Morphling should not have been alone for that
Proceedings of CESCG 2021: The 25th Central European Seminar on Computer Graphics (non-peer-reviewed)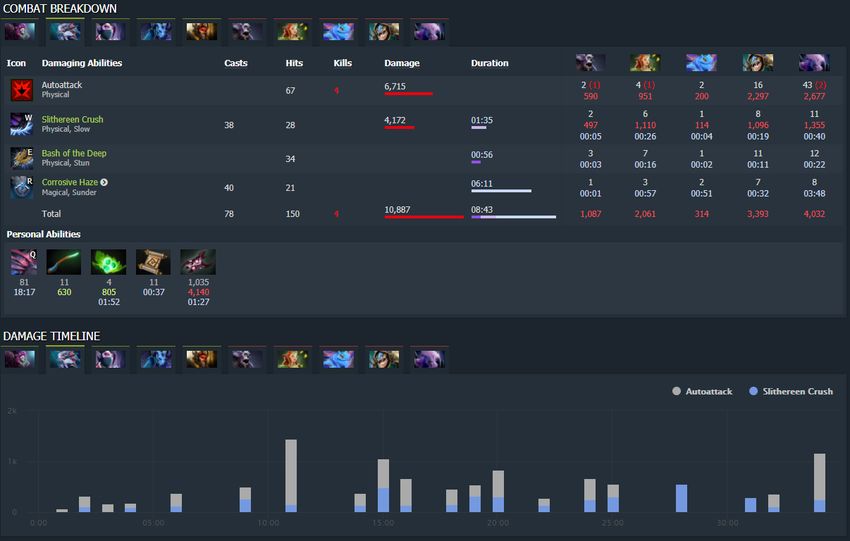
Figure 7: Above: An opendota Teamfight summary,
showing that Huskar had the highest damage and healing
output in the fight. Below: The Dota2 Rumble Flow dis-
playing the same Teamfight, showing Huskar’s damage is
not inflicted upon enemy heroes, but on Huskar himself.
                                                                Figure 8: Above: An opendota Teamfight summary, fea-
                                                                turing a complete wipe of the Dire team. Below: The
long, but to further analyse the reasons behind that, they      Dota2 Rumble Flow displaying ten seconds of the same
would have needed information on the positioning of all         Teamfight that lead up to Morphling’s death.
the heroes. While the participants used the summary as
well as the Rumble Flow in combination, they drew a lot
of information from the Rumble Flow in order to find ex-        in order to find the busiest parts of a fight. They felt the
planations for the Teamfight’s outcome.                         same way about the filters, which only two participants
   We concluded the interview with questions about the          used during exploration. The time controls were sufficient
user interface, as the participants were already familiar       and we received suggestions to improve them further, e.g.
with it by then. We received very positive feedback for         by being able to select a timeframe per mouse drag as well
the node link diagram as information is shown in greater        as the whole fight. Generally, being able to explore the
detail compared to a summary. In combination with the           fight bit by bit and see the flow of interactions was very
skulls that indicate hero deaths along the timeline, partici-   well-received. Further suggestions involved e.g. to vi-
pants stated that they were able to easily explore and navi-    sually mark nodes if the respective heroes are currently
gate through the Teamfight. Interestingly enough, they did      dead, and incorporate damage type information into the
not really pay attention to the damage bar chart, because       links between nodes. The participants also stated that in-
they drew the damage information from the node link di-         formation on items and abilities is missing, as the Rumble
agram anyway. But they all agreed that it is nice to have,      Flow does not show when items or abilities were used and

     Proceedings of CESCG 2021: The 25th Central European Seminar on Computer Graphics (non-peer-reviewed)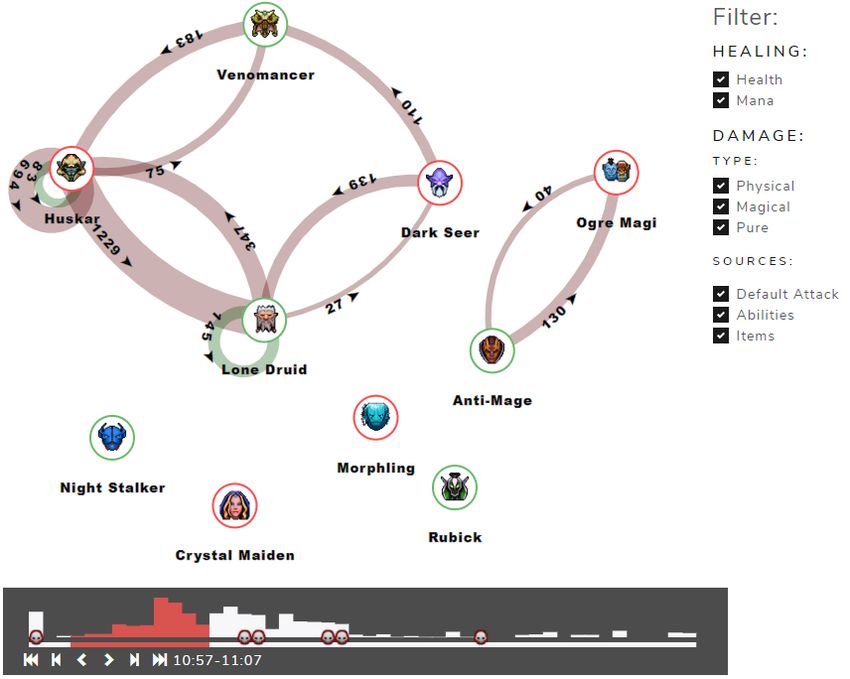
neither by whom. Another relevant aspect is the informa-        References
tion about positioning, which is also not provided by the
Rumble Flow, but would make an important addition for           [1] ESPORTS Charts. The international 2018 statis-
better Teamfight analysis.                                          tics.         https://escharts.com/blog/
                                                                    stats-international-2018, 2018.           Ac-
                                                                    cessed: 2020-03-04.
7    Conclusion
                                                                [2] Winn Chris. The well-played moba: How dota 2 and
The Dota2 Rumble Flow is an interactive graph based vi-             league of legends use dramatic dynamics. In Proceed-
sualization that supports Teamfight analysis. It does not re-       ings of the Ninth DiGRA International Conference:
place conventional Teamfight summaries, but instead ben-            Diversity of Play. Digital Games Research Associa-
efits from them as they provide more information and con-           tion, 2015.
text. In return the Rumble Flow provides more insight
                                                                [3] Meng Du and Xiaoru Yuan. A survey of competitive
into the progression of a fight and can clarify the signif-
                                                                    sports data visualization and visual analysis. Journal
icance of aggregated values from summaries. It can re-
                                                                    of Visualization, 24(1):47–67, Feb 2021.
inforce right and refute false assumptions that are made
from solely looking at summaries. Even so, the Rumble           [4] Corey Lanum. Dynamic graphs: how to show data
Flow can be further improved. Based on the results of               over time. Manning, 2017.
the user study, the most important additions include infor-
mation on hero positioning, and item and ability usage in       [5] Charles Perin, Romain Vuillemot, C. Stolper,
greater detail. Aside from showing which items and abil-            J. Stasko, J. Wood, and Sheelagh Carpendale. State of
ities were used at which point by whom and on who, the              the art of sports data visualization. Computer Graph-
Rumble Flow could further be extended with information              ics Forum, 37, 06 2018.
about cooldowns and possibly even cast ranges.
                                                                [6] Matthew Pluss, Kyle Bennett, Andrew Novak, Derek
   Information on crowd control represent another possible
                                                                    Panchuk, Aaron Coutts, and Job Fransen. Esports:
improvement. During a Dota2 match it is important to use
                                                                    The chess of the 21st century. Frontiers in Psychol-
the right disables on the right target, which is often game
                                                                    ogy, 10, 01 2019.
deciding. Therefore status effects and their duration are
very interesting for Teamfight analysis as well.                [7] Daniel Railsback and Nicholas Caporusso. Investigat-
   In order to keep the Rumble Flow comprehensible it               ing the Human Factors in eSports Performance, pages
might be reasonable to add new visualizations and further           325–334. 01 2019.
utilize the concept of focus and context.
                                                                [8] Joseph Rubleske, Travis Fletcher, and Brett Wester-
                                                                    feld. E-sports analytics: A primer and resource for
                                                                    student research projects and lesson plans. Journal of
                                                                    Instructional Pedagogies, 23, 2020.

     Proceedings of CESCG 2021: The 25th Central European Seminar on Computer Graphics (non-peer-reviewed)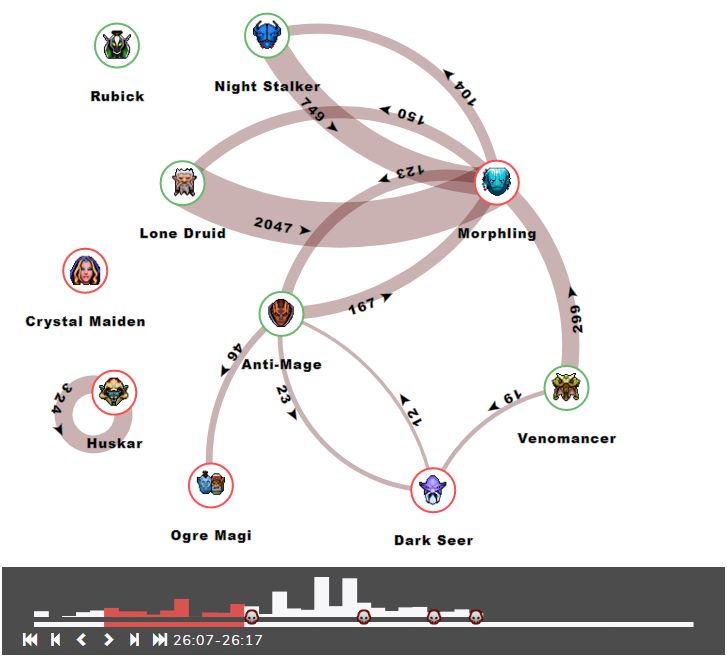
You can also read