Western Jackass Morwong (Nemadactylus macropterus) stock assessment based on data up to 2017
←
→
Page content transcription
If your browser does not render page correctly, please read the page content below
OCEANS AND ATMOSPHERE

 Western Jackass Morwong
(Nemadactylus macropterus)
stock assessment based on
data up to 2017
Jemery Day and Claudio Castillo‐Jordán
CSIRO Oceans and Atmosphere, Castray Esplanade, Hobart TAS 7000, Australia
For discussion at SERAG, 14‐16 November 2018, Hobart, Tasmania.
Australian Fisheries Management Authority

Version 2.03 – 23 November 2018
Citation
Day, Jemery and Castillo‐Jordán, Claudio. (2018) Western Jackass Morwong (Nemadactylus
macropterus) stock assessment based on data up to 2017. For discussion at SERAG, November
2018.

Copyright
© Commonwealth Scientific and Industrial Research Organisation 2018. To the extent permitted
by law, all rights are reserved and no part of this publication covered by copyright may be
reproduced or copied in any form or by any means except with the written permission of CSIRO.

Important disclaimer
CSIRO advises that the information contained in this publication comprises general statements
based on scientific research. The reader is advised and needs to be aware that such information
may be incomplete or unable to be used in any specific situation. No reliance or actions must
therefore be made on that information without seeking prior expert professional, scientific and
technical advice. To the extent permitted by law, CSIRO (including its employees and consultants)
excludes all liability to any person for any consequences, including but not limited to all losses,
damages, costs, expenses and any other compensation, arising directly or indirectly from using this
publication (in part or in whole) and any information or material contained in it.
CSIRO is committed to providing web accessible content wherever possible. If you are having
difficulties with accessing this document please contact enquiries@csiro.au.

ii | Western Jackass Morwong (Nemadactylus macropterus) stock assessment based on data up to 2017
Contents

Acknowledgments........................................................................................................................... 5
Executive summary ......................................................................................................................... 6
1          Introduction ........................................................................................................................ 7
           1.1         The fishery ............................................................................................................. 7
           1.2         Stock Structure ...................................................................................................... 8
           1.3         Previous assessments ............................................................................................ 8
           1.4         Modifications to the previous assessments ........................................................ 12
2          Methods ............................................................................................................................ 14
           2.1         The data and model inputs.................................................................................. 14
           2.2         Stock assessment method ................................................................................... 26
3          Results and discussion ...................................................................................................... 31
           3.1         The base‐case analysis......................................................................................... 31
           3.2         Sensitivity tests and alternative models.............................................................. 41
           3.3         Future work and potential issues with this assessment and data ...................... 41
Appendix A             45
References             56

                                           Western Jackass Morwong (Nemadactylus macropterus) stock assessment based on data up to 2017 | 1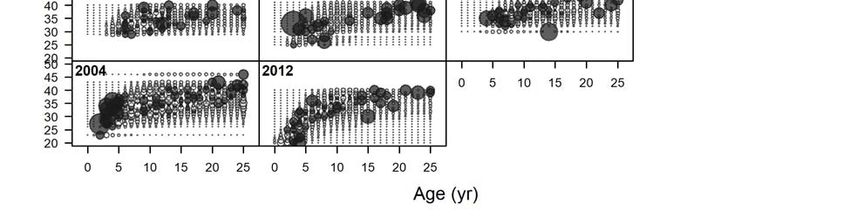
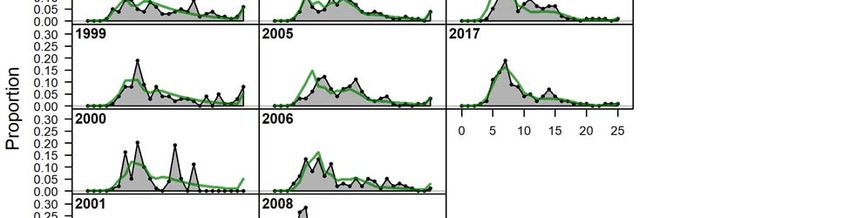
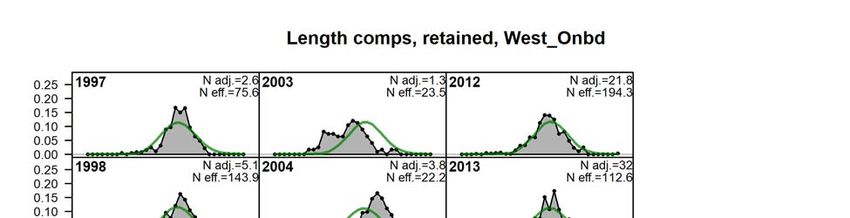
Figures
Figure 1. Total landed catch (tonnes) of western jackass morwong from 1986‐2017 (stacked). 15
Figure 2. Total landed catch (tonnes) of western jackass morwong from 1986‐2017 (lines). ..... 16
Figure 3. Model estimates of discard fractions by fleet, western trawl (blue). ........................... 19
Figure 4. Estimated discards (tonnes) of jackass morwong (Zones 40 and 50) in the SESSF from
1986‐2017, otter trawl (blue). ...................................................................................................... 20
Figure 5. Summary of input data used for the western jackass morwong assessment. .............. 26
Figure 6. Fixed growth curve for western jackass morwong, using parameters estimated from
the eastern morwong stock assessment. ..................................................................................... 31
Figure 7.Selectivity (blue/green) and retention (red) functions for the western trawl fleet. ...... 32
Figure 8. Observed (circles) and model‐estimated (blue line) catch rates vs year, with approx
95% asymptotic intervals for the western trawl fleet. The thin lines with capped ends should
match the thick lines for a balanced model. This index is balanced by estimating an additional
variance parameter within Stock Synthesis which in this case is positive, suggesting the model
requires more variance than the initial values from the loess fit to achieve a good fit............... 33
Figure 9. Observed (circles) and model‐estimated (blue line) catch rates vs year, with approx
95% asymptotic intervals for western FIS. The thin lines with capped ends should match the
thick lines for a balanced model. This index is balanced by estimating an additional variance
parameter within Stock Synthesis, which in this case is positive and large, suggesting the model
requires much more variance than the initial values from the loess fit to achieve a good fit..... 34
Figure 10. Observed (circles) and model‐estimated (blue line) catch rates vs year, with approx
95% asymptotic intervals for western FIS. The thin lines with capped ends should match the
thick lines for a balanced model. This index is balanced by estimating an additional variance
parameter within Stock Synthesis, which in this case is positive and large, suggesting the model
requires much more variance than the initial values from the loess fit to achieve a good fit..... 35
Figure 11. Fits to retained and discarded length compositions, separated by port and onboard
samples, aggregated across all years. Observed data are grey and the fitted value is the green
line. ................................................................................................................................................ 36
Figure 12. Time‐trajectory of spawning biomass depletion (with approximate 95% asymptotic
intervals) corresponding to the MPD estimates for the 2018 base‐case analysis for jackass
morwong. ...................................................................................................................................... 37
Figure 13. Recruitment estimation for the base case analysis. Top left : Time‐trajectories of
estimated recruitment numbers; top right : time trajectory of estimated recruitment
deviations; bottom left : time‐trajectories of estimated recruitment numbers with approximate
95% asymptotic intervals; bottom right: the standard errors of recruitment deviation
estimates. ...................................................................................................................................... 38
Figure 14. Kobe plot base case, showing the trajectory of spawning biomass (relative to B0)
plotted against 1‐SPR, which is a proxy for fishing mortality, essentially integrating fishing
mortality across fleets in the fishery. ........................................................................................... 39

2 | Western Jackass Morwong (Nemadactylus macropterus) stock assessment based on data up to 2017
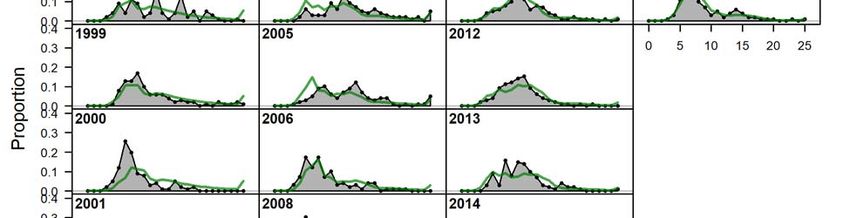
Figure 15. Recruitment estimation for the base case analysis. Left: the stock‐recruit curve and
estimated recruitments; right: bias adjustment. .......................................................................... 40
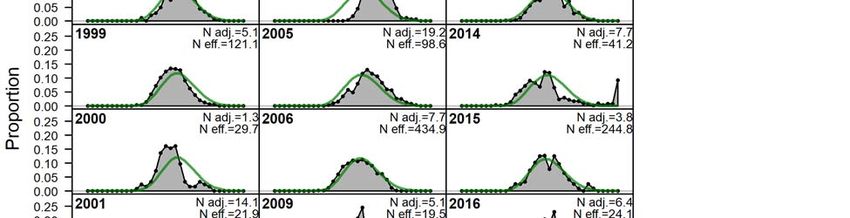
Apx Figure A.1 Jackass morwong length composition fits: western trawl onboard retained. ..... 45
Apx Figure A.2 Jackass morwong length composition fits: western trawl port retained. ............ 46
Apx Figure A.3 Jackass morwong length composition fits: western trawl discarded. ................. 47
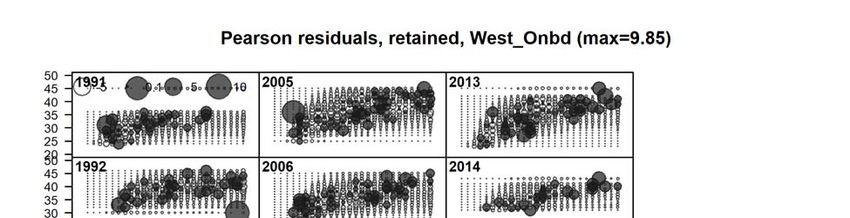
Apx Figure A.4 Residuals from the annual length composition data for jackass morwong
displayed by year and fleet for western trawl fleets (retained and discarded). .......................... 48
Apx Figure A.5 Mean length for jackass morwong from western trawl onboard with 95%
confidence intervals based on current samples sizes. Francis data weighting method TA1.8: Thin
capped lines matching thick lines indicate this is well balanced. ................................................. 49
Apx Figure A.6 Mean length for jackass morwong from western trawl port with 95% confidence
intervals based on current samples sizes. Francis data weighting method TA1.8: Thin capped
lines matching thick lines indicate this is well balanced............................................................... 50
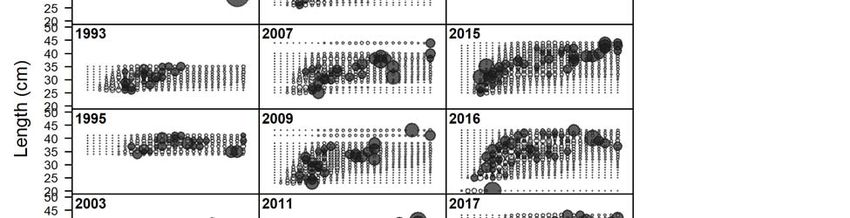
Apx Figure A.7 Implied fits to age compositions for jackass morwong western trawl onboard
(retained). ..................................................................................................................................... 51
Apx Figure A.8 Implied fits to age compositions for jackass morwong western trawl port
(retained). ..................................................................................................................................... 52
Apx Figure A.9 Implied fits to age compositions for jackass morwong western trawl
(discarded). ................................................................................................................................... 53
Apx Figure A.10 Residuals from the fits to conditional age‐at‐length for jackass morwong
western trawl onboard. This plot gives some indication of the variability in the age samples
from year to year. ......................................................................................................................... 54
Apx Figure A.11 Mean age (aggregated across length bins) for jackass morwong from western
trawl with 95% confidence intervals based on current samples sizes. Punt data weighting
method TA1.8: Thin capped lines matching thick lines indicate this is well balanced. Yearly
variation in the data is shown in changes in mean age, which can be large over a short period
(e.g. 1991‐1996). ........................................................................................................................... 55
Tables
Table 1. Total retained catches (tonnes) of western jackass morwong for calendar years from
1986‐2017 and TAC (combined eastern and western stocks) for 1992‐2018. ............................. 17
Table 2. Discard proportions from 1994 to 2017 with sample sizes for each data point. Entries in
grey indicate data that are not used either due to small sample size (less than 10 samples –
although there are none of these here) or because the value is too close to zero (less than
0.02). ............................................................................................................................................. 18
Table 3. Standardised catch rate indices and coefficient of variation (Sporcic and Haddon,
2018b) for the western trawl fleet for western jackass morwong and the FIS abundance indices.
Western Jackass Morwong (Nemadactylus macropterus) stock assessment based on data up to 2017 | 3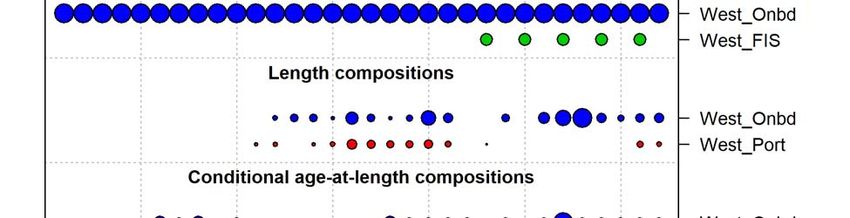
The coefficient of variation is initially set at a value equal to the root mean squared deviation
from a loess fit (Sporcic and Haddon, 2018a). .............................................................................. 21
Table 4. Number of onboard discarded lengths and number of shots for length frequencies
included in the base case assessment by fleet 1994‐2016. Entries in grey indicate data that are
not used due to small sample size (less than 100 fish measured) or, in the case of the 1994
sample, because SERAG decided that the sample looked unrepresentative. .............................. 22
Table 5. Number of port and onboard retained lengths and number of shots or trips for length
frequencies included in the base case assessment by fleet 1996‐2017. Entries in grey indicate
data that are not used due to small sample size (less than 100 fish measured). ........................ 23
Table 6. Standard deviation of age reading error (A Punt pers. comm. 2018). ........................... 24
Table 7. Number of age‐length otolith samples included in the base case assessment for the
western trawl fleet 1991‐2017. .................................................................................................... 25
Table 8. Summary of parameters of the base case model. .......................................................... 32
Table 9. Yearly projected RBCs (tonnes) across all fleets under the 20:35:48 harvest control
rules all assuming average recruitment from 2014 for the agreed base case with January
spawning and improved fits to growth (sensitivity 17). ............................................................... 40
Table 10. Yearly projected discards (tonnes) across all fleets under the 20:35:48 harvest control
rules with catches set to the calculated RBC for each year from 2019 to 2023 for the base
case. .............................................................................................................................................. 41
Table 11. Summary of results for the base‐case and sensitivity tests. Recommended biological
catches (RBCs) are only shown for agreed base case model models (Case 17). .......................... 43
Table 12. Summary of likelihood components for the base‐case and sensitivity tests. Likelihood
components are unweighted, and cases 1‐17 are shown as differences from the base case. A
negative value indicates a better fit, a positive value a worse fit. ............................................... 44

4 | Western Jackass Morwong (Nemadactylus macropterus) stock assessment based on data up to 2017
Acknowledgments

Age data were provided by Kyne Krusic‐Golub (Fish Ageing Services), ISMP and AFMA logbook and
CDR data were provided by John Garvey (AFMA). Franzis Althaus, Mike Fuller, Roy Deng, Claudio
Castillo‐Jordán, and Paul Burch (CSIRO) pre‐processed the data. André Punt, Geoff Tuck, Sandra
Curin‐Osorio, Paul Burch, Malcolm Haddon, Robin Thomson and Miriana Sporcic are thanked for
helpful discussions on this work. Ian Taylor, Richard Methot and Chantel Wetzel (NOAA Fisheries)
are thanked for all the Stock Synthesis support and advice. Malcolm Haddon provided useful code
for auto‐tuning, Athol Whitten provided useful R code for organising plots.

                            Western Jackass Morwong (Nemadactylus macropterus) stock assessment based on data up to 2017 | 5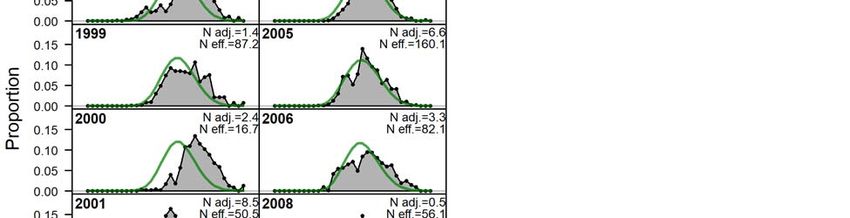
Executive summary

This document updates the 2015 assessment Tier 1 assessment of western jackass morwong
(Nemadactylus macropterus) to provide estimates of stock status in the SESSF at the start of 2019
and describes the base case assessment and some of the issues encountered during development.
This assessment was performed using the stock assessment package Stock Synthesis (version
V3.30.12.00). The 2015 stock assessment has been updated with the inclusion of data up to the
end of 2017, comprising an additional three years of catch, discard, CPUE, length and age data and
ageing error updates, including revisions to historical catch series, length frequencies and discard
rates. A range of sensitivities were explored.
The base‐case assessment estimates that current spawning stock biomass is 68% of unexploited
stock biomass (SSB0). Under the agreed 20:35:48 harvest control rule, the 2019 recommended
biological catch (RBC) is 235 t, with the long term yield (assuming average recruitment in the
future) of 158 t. The average RBC over the three year period 2019‐2021 is 223 t and over the five
year period 2019‐2023, the average RBC is 212 t.
Exploration of model sensitivity showed variation in spawning biomass across all sensitivities
ranging from 33% to 102% of SSB0 with greatest sensitivity to natural mortality. Excluding this
sensitivity to natural mortality, the other sensitivities showed a much narrower range, from 60%
to 75% of SSB0.
Changes to the 2015 stock assessment include: estimating discards and retention rather than
simply adding discards to landed catches; and using the latest agreed best practice tuning method.
The updated assessment is consistent with the results from the 2015 assessment, despite an
additional three years of data, improvements to data processing and modifications to Stock
Synthesis. As in the 2015 assessment, results show poor fits to the abundance data (catch rate and
Fishery Independent Survey (FIS)), but acceptable fits to the length composition and conditional
age‐at‐length data.

6 | Western Jackass Morwong (Nemadactylus macropterus) stock assessment based on data up to 2017
1          Introduction

1.1 The fishery
Jackass morwong (Nemadactylus macropterus) have been landed in southern Australia since the
inception of the steam trawl fishery off New South Wales in the early twentieth century (Fay
2004), with the initial fishery concentrating in the east (SESSF Zones 10, 20 and 30). Jackass
morwong were not favoured during the initial years of this fishery, when the main target species
was tiger flathead (Neoplatycephalus richardsoni). Declines in flathead catches and improved
market acceptance led to increased targeting of jackass morwong during the 1930s and later years
of the steam trawl fishery (Klaer, 2001). Annual estimates of landings of jackass morwong from the
steam trawl fishery in the east between 1915 and 1957 reached a peak of about 2,000 t during the
late 1940s (Day and Castillo‐Jordán, 2018b).
The fishery expanded greatly during the 1950s, with Danish seine vessels becoming the main
vessels in the fishery. Landings of jackass morwong in NSW and eastern Victoria increased
following WWII, and, at their peak in the 1960s, annual landings were of the order of 2,500 t. The
fishery shifted southwards during this time, with the majority of the landed catches coming from
eastern Victoria. Landings of morwong then dropped to around 1,000 t by the mid‐1980s (Table 4),
with landings in eastern Tasmania becoming an increasing proportion of catches. By the mid‐
1980s, the majority of jackass morwong was being landed by modern otter trawlers; with small
landings by Danish seine vessels in eastern Victoria and eastern Bass Strait (Smith and Wayte,
2002). Catches were not recorded in the west (SESSF zones 40 and 50) until 1986.
Since the introduction of management measures into the South East Fishery in 1985, the recorded
catch of jackass morwong has ranged between 111 t in 2015 (102 t in the east and 9 t in the west)
to 1,652 t in 1989 (1567 t in the east and 85 t in the west). Annual landings of jackass morwong in
the eastern zones declined to around 1,000 t during the 1990s and in 2017 are near their lowest
recorded levels (Day and Castillo‐Jordán, 2018b). The catches appear to have been constrained by
the total allowable catch (TAC) in the periods 2002‐2005 and 2008‐2011. In 1992, an initial TAC
was set at 1,500 t (Smith and Wayte, 2002), with this single TAC set to cover catches in both the
east and the west. The agreed TAC was reduced to 1,200 t in 2000, to 960 t in 2003, briefly
increased to 1,200 t in 2006, then further decreased to 878t in 2007. Since 2008 the TAC has
varied between 450‐600t. These changes to the TAC have been in response to stock assessments
showing the stock to be at declining levels. The TAC was set at 450 t from 2009‐2011 as a bycatch
TAC i.e. the amount of unavoidable bycatch of morwong that could be expected from fishing for
other species. Klaer and Smith (2008) calculated that in 2006, 59% of morwong trawl catch was
caught as bycatch (mainly from flathead fishing). From the logbook data in 2006, the morwong
trawl catch was 763 t. Thus 59% of this, or 450 t, is bycatch that is unavoidable if catches of
species that have morwong as a bycatch stay the same as 2006 levels (Wayte, 2011).
Catches of jackass morwong in the west have been recorded since 1986 (153 t) with less than 100t
caught annually in the west from 1987‐1999, then catch totals exceeding 100t in the period 2000‐
2008 (with a peak of 320 t in 2001). All catches have been less than 100t since 2009, indeed less

                             Western Jackass Morwong (Nemadactylus macropterus) stock assessment based on data up to 2017 | 7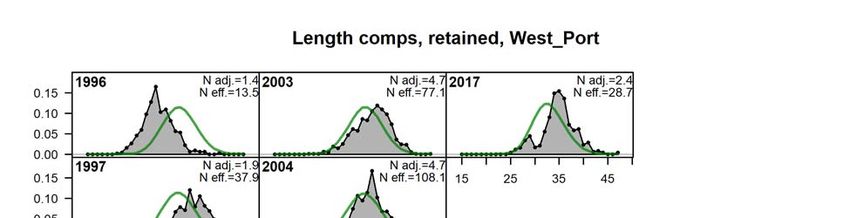
than 50 t in the period 2010‐2016, with a 2017 western catch of 87 t. While the western catches
were not included in stock assessments conducted before 2007, the TAC has always been set for
the combined eastern and western stocks. Since 2007, the recommended biological catches (RBC)
used to determine the TAC (for the combined stock) is simply the sum of the RBC for the eastern
stock and the RBC for the western stock. The eastern and western stocks have been managed
under a single TAC, so an RBC of zero for the eastern stock, (combined with a non‐zero RBC from
the western stock) still allowed a non‐zero TAC to be set for the combined stock, and allowed
some of that TAC to be taken in the eastern part of the stock.
Morwong is also caught in small quantities in state waters off NSW and Tasmania, and by the non‐
trawl sector of the fishery, although these landings are not large. This assessment does not
consider landings from vessels in the non‐trawl sector. The state catches have been added to the
Commonwealth catches in the appropriate zone.
The assessment data for the western stock of jackass morwong comprises a single western trawl
fleet. In the west, 50% recruitment to the fishery occurs at around 8 years old, compared to
between three and seven years in the east.

1.2 Stock Structure
Genetic studies conducted by the CSIRO have found no evidence of separate stocks of jackass
morwong in Australian waters. New Zealand and Australian stocks are however, distinct (Elliott et
al., 1992). Analysis of otolith microstructure (Proctor et al., 1992) found differences between
jackass morwong from southern Tasmania and those off NSW and Victoria, but it is unclear if such
differences indicate separate stocks. Differences among jackass morwong in the western and
eastern zones have been suggested (D.C. Smith, MAFRI, pers. comm. 2004; I. Knuckey, Fishwell,
pers. comm. 2004), and it is assumed for the purposes of this assessment that there are separate
stocks of jackass morwong in the eastern and western zones (Wayte, 2011).

1.3 Previous assessments
Smith (1989) analysed catch and effort data for the Eden fishery (1971‐72 to 1983‐84), finding a
significant decline in catch‐per‐unit‐effort (CPUE) to 1980. Lyle (1989) analysed logbook data for
Tasmania and western Bass Strait from 1976‐84. No trends were apparent in these data.
The biomass of jackass morwong in the eastern zone was estimated to be about 10,000 t in the
mid‐1980s (Smith, 1989), using a combination of trawl surveys and VPA. Age‐structured modelling
of the NSW component of the fishery indicated that Maximum Sustainable Yield (MSY) is
approached with a fishing mortality (F) between 0.2 and 0.3 yr‐1, and that the fishery was at
optimum levels in the mid‐1980s (Smith, 1989).
At the 1993 meeting of SEFSAG, the recent age data (from the Central Ageing Facility, CAF) and
length data were presented together with new age and length data from southeastern Tasmania.
Estimates of total mortality from catch curve analyses were similar to previous estimates in the
early 1980s. Length and age data from southeastern Tasmania were characterised by a greater
proportion of larger and older fish. Preliminary ageing data from sectioned otoliths were tabled at

8 | Western Jackass Morwong (Nemadactylus macropterus) stock assessment based on data up to 2017
SEFAG in 1994 which suggested that morwong were longer lived (35 years) than previously
thought (20 years).
In 1995, catch and unstandardised effort by major area in the fishery were derived from logbook
records for the period 1986‐94. Whereas the 1994 assessment stated that catch rates had
remained relatively stable for the previous 4 years, GLM‐standardized trawl catch rates exhibited a
slow decline from 1987. Indeed, Smith and Wayte (2002) note that the mean unstandardised
catch rate of jackass morwong has continued to decline, and, since 1996, has triggered AFMA’s
catch rate performance criterion.
An assessment in 1997 was based on the collation and analysis of catch and effort data, combined
with new biological information on growth rates of jackass morwong. Information on length
frequencies and the retained and discarded catch of jackass morwong was obtained from SMP
data and the FRDC report by Liggins (1996). Further length‐frequency data were available from
NSW and Tasmanian state projects. Catch curve analysis on fish between 5 and 26 years old
produced an estimate for total mortality of 0.18 yr‐1. This was considerably lower than previous
estimates of 0.6 to 0.77 yr‐1 and was a direct result of the “new” maximum age. It is also lower
than the values obtained by applying the 1993/94 age‐length key (0.3 yr‐1) to length composition
data. Using a value for M of 0.09 yr‐1, a fishing mortality (F) of 0.09 yr‐1 was estimated.
Klaer (2006) used a stock reduction analysis (SRA) method to model the population of jackass
morwong off NSW using catch history data from 1915‐61. This analysis lead to a point estimate of
unexploited total recruited biomass of 29,400 tonnes, which is larger than spawning biomass, with
a 1961 depletion level of 70%.
The first formal quantitative assessment of jackass morwong was conducted by Fay (2004) based
on data to 2002, using Coleraine, a stock assessment software package. It used a generalised age‐
structured modelling approach to assess the status and trends of the jackass morwong trawl
fishery in the eastern zones, using data from the period 1915‐2002. The 2004 assessment
indicated that the spawning biomass of jackass morwong was between 25‐45% of the 1915
unexploited biomass. The base‐case model estimated the current spawning biomass was 37% of
the unexploited biomass. The model could not adequately reconcile changes in catch rates in the
late 1980s with catches during this period.
The 2004 assessment was updated in 2006 using Coleraine with additional data that had become
available since the previous assessment (Fay, 2006). Two recent (1986‐2005) catch rate series
were explored in the 2006 assessment. ShelfRAG originally chose to use a catch rate
standardisation that was restricted to vessels which caught jackass morwong for at least 5 years
and had a median annual catch of at least 5 t. Only shots in which at least 30 kg of jackass
morwong were caught were included. The new standardized catch rate time series, which was
chosen to be consistent with other SESSF species, also endeavoured to select targeted shots by
selecting shots with ≥1kg of morwong from vessels that had reported catches of morwong for
three or more years and whose median annual catch was greater than 2 tonnes.
Base‐case estimates of spawning depletion in 2006 when the model was fit to the ≥1kg catch rate
series indicated that the stock was at a low level, around 15% of the unexploited equilibrium state.
This led to RBCs in 2007 of zero under all Tier 1 and Tier 2 harvest control rules (HCRs). If the
model was fitted to the new age and length data but used the ≥30 kg catch rate index, estimates
of current stock status were more optimistic, with spawning depletion in 2006 estimated to be
                             Western Jackass Morwong (Nemadactylus macropterus) stock assessment based on data up to 2017 | 9
35% of the unexploited state. This assessment also recommended “accounting for the western areas of the SESSF” in future assessments. The results of the 2006 assessment were clearly sensitive to the catch and effort data used to calculate a catch rate index that is representative of changes in biomass. As the estimated population trend is primarily driven by this catch rate index, the choice of data included is key to estimates of stock status for this population. For the 2004 assessment, it was considered that a 30 kg cut‐off for catch and effort data was reasonable for morwong. However, the increasing trend in the number of shots catching small amounts of morwong from those vessels targeting the species (Day 2006) suggests that this might not be the case. The analysis by Day showed that the increase in small shots is not due to a change in reporting practices. In 2006 ShelfRAG decided to use the ≥ 1 kg catch rate as input to the base‐case, as this was the more precautionary approach, no evidence against using this series was presented, and it is consistent with the approach used for other SESSF species. The 2007 base‐case assessment (Wayte and Fay, 2007) for the eastern stock estimated that the 2008 spawning stock biomass was 19% of unexploited stock biomass. This assessment was largely driven by the recent catch rate indices, which indicated a 70% decline in the stock over the last 20 years. The age and length data when fitted in the absence of the catch rate indices did not indicate the same magnitude of decline. In order to fit to the catch rate indices, the model estimated that recruitments were largely below average in the last 25 years, although there was some evidence for an above average recruitment in 2003. Depletion across all sensitivities varied between 11% and 28%. A preliminary assessment for the western stock in 2007 indicated that the stock had declined in recent years as fishing pressure has increased, but spawning stock biomass was 63%, still considerably higher than the target level. The long‐term RBCs estimated for the western stock were comparable with the 2007 catch levels. The single RBC calculated for jackass morwong (combining the east (0t) and west (297t) stocks) was 297t (using the 20:40:48 control rule), with this RBC coming entirely from the western part of the stock. The TAC was set allowing for unavoidable bycatch of jackass morwong in the east. The 2008 base‐case assessment for the eastern stock (Wayte and Fay, 2008) estimated that the 2009 spawning stock biomass was 19% of unexploited stock biomass. The 2007 assessment had estimated good recruitments for both 2003 and 2004. However the limited amount of 2007 data used in the 2008 assessment did not support the high 2004 recruitment estimate. Several data types were not available for 2007, and, for the data that were available, sample sizes were lower than in previous years. The 2008 CPUE indices indicated that the stock abundance was unchanged from the previous year. The 2008 base‐case assessment for the western stock (Wayte and Fay, 2008), was still considered to be preliminary, due to limited data, and estimated that the 2009 spawning stock biomass was 68% of unexploited stock biomass. The single RBC calculated for jackass morwong (combining the east (0t) and west (381t) stocks) was 381t (using the 20:35:48 control rule), with this RBC coming entirely from the western part of the stock. The 2009 assessment (Wayte, 2009) estimated recruitment deviations up to four years before the end of the data instead of two years as in previous assessments. This change was made because it was recognised that fish spawned two and three years before the end of the data will not be well‐ 10 | Western Jackass Morwong (Nemadactylus macropterus) stock assessment based on data up to 2017
represented in the data, and this problem had been compounded in the years leading up to the
2009 assessment by poor data collection. The eastern trawl CPUE index showed a slight increase,
and the 2003 recruitment continued to be estimated as above average – leading to a slight
recovery in the current status of the stock to above the limit reference level (24%). Catch rates had
declined in recent years, despite lower catches than in the past. To reconcile this information the
2009 base‐case assessment estimated recruitments to have been consistently below average since
the early 1980s. The 2009 assessment examined two other possible reasons for this decline: that
recruitment is more closely related to stock size than previously assumed (i.e. steepness is lower);
or that a regime shift has occurred. Both these models led to a better fit to the data than the base‐
case, but neither were accepted as a new base‐case. The best estimate of lower steepness was
considered to be unrealistically low for a Perciforme species such as morwong (Myers et al 1999).
The regime shift model gave a more optimistic picture of current stock status than the other
models, but the long term catch estimate was greatly reduced. It was considered that more
evidence for the existence of a regime shift was required before this model was considered
plausible.
The 2009 base‐case assessment for the western stock (Wayte, 2009), was considered to be
increasingly uncertain, with no recent length frequency data (for 2007 and 2008), and estimated
that the 2010 spawning stock biomass was 70% of unexploited stock biomass. The single RBC
calculated for jackass morwong (combining the east (143t) and west (367t) stocks) increased to
510t, with this RBC coming from both the eastern and western part of the stock.
The 2010 base‐case assessment for the eastern stock (Wayte, 2010) estimated that current
spawning stock biomass was 26% of unexploited stock biomass. Concern was expressed that
catches in the east had continued to be above the eastern component of the (combined) RBC. The
western stock assessment continued to be considered as increasingly uncertain, with no recent
length frequency data (for 2007‐2009). Catches of morwong in the Great Australian Bight were
found to be at a similar level to western morwong catches, but it is not known whether the GAB
morwong form a separate stock.
In 2010 the RAG decided to include both port and onboard retained length frequency data (for
both historic and current years) in future assessments, whereas previously only port data had
been used. The 2010 assessment was run with this change in length frequency data (as well as any
other changes to the data up to 2009), and very little change to the assessment result was seen. At
the ShelfRAG meeting on October 3‐4 2011, an alternative base‐case assuming that eastern
jackass morwong has undergone a shift to lower recruitment was presented and accepted and
was used as the base‐case for the eastern assessment (Wayte, 2011). The justification for this
switch is well described in Wayte (2011), including MSE testing implications of assuming (or not)
the recruitment shift. The western assessment uses the same assumptions as in previous years (no
recruitment shift).
The 2010 base‐case assessment for the western stock (Wayte, 2010), continued to be considered
increasingly uncertain, with no recent length frequency data (for 2007‐2009), and estimated that
the 2010 spawning stock biomass was 70% of unexploited stock biomass. The single RBC
calculated for jackass morwong (combining the east (228t) and west (329t) stocks) increased to
557t, with this RBC coming from both the eastern and western part of the stock.

                            Western Jackass Morwong (Nemadactylus macropterus) stock assessment based on data up to 2017 | 11
The 2011 base‐case assessment for the eastern stock (Wayte, 2011) accepted that there was a
productivity shift for the eastern stock of jackass morwong and estimated that current spawning
stock biomass was 35% of 1988 equilibrium stock biomass. The western stock assessment
continued to be considered as increasingly uncertain, with no recent length frequency data (for
2007‐2010).
The 2011 base‐case assessment for the western stock (Wayte, 2011), continued to be considered
increasingly uncertain, with no recent length frequency data (for 2007‐2010), and estimated that
the 2011 spawning stock biomass was 67% of unexploited stock biomass. The single RBC
calculated for jackass morwong (combining the east (358t) and west (282t) stocks) increased to
640t, with this RBC coming from both the eastern and western part of the stock.
The 2015 base‐case assessment for the eastern stock (Tuck et al., 2015a) estimated that current
spawning stock biomass was 37% of 1988 equilibrium stock biomass. The western stock
assessment continued to be considered as increasingly uncertain, with no length frequency data
for 2007‐2010, limited age data, low samples size for length compositions, very low catches and
conflict between the length and catch rate data. In this assessment, growth parameters were not
estimated, and instead were fixed at the values estimated from the eastern assessment. The 2015
spawning stock biomass was estimated to be 69% of unexploited stock biomass. The single RBC
calculated for jackass morwong (combining the east (314t) and west (249t) stocks) increased to
563t, with this RBC coming from both the eastern and western part of the stock.
1.4 Modifications to the previous assessments
The 2018 assessment uses Stock Synthesis version SS‐V3.30.12.00, (Methot et al., 2018), updated
from version SS‐V3.24U (Methot and Wetzel, 2013) that was used in the 2015 assessment. New
catch, discard, length and conditional age at‐length data is available from the three year period
from 2015‐2017. In addition to these new and updated data, there is an updated standardised
CPUE series for the western trawl fleets (Zones 40 and 50), each with three additional data points
and updated estimates for the ageing error matrix.
1.4.1 Data‐related issues
1. Length‐frequency data are included separately for onboard and port data by fleet. Port and
onboard fleets share a single selectivity pattern.
2. Length frequency data are weighted by shot or trip numbers rather than numbers of fish
measured. A cap of 100 trips and 200 shots was used to set an upper limit on the sample
size.
3. There is a single catch‐rate time series dating back to 1986, western trawl (SESSF Zones 40
and 50).
4. No state catches have been included for the western assessment, with relevant state
catches added into the appropriate fleets in the eastern assessment.
5. The ageing error matrix has been updated.
12 | Western Jackass Morwong (Nemadactylus macropterus) stock assessment based on data up to 20176. Catch, discard, length‐composition, age‐at‐length, and catch rate data have been added for
the period 2015‐2017. The historical catch series (up until 2014) was also revised to
incorporate changes in the catch database.
1.4.2 Model‐related issues
1. Growth is assumed to follow a von Bertalanffy type length‐at‐age relationship, with all four
growth parameters fixed at values obtained in the eastern assessment (Day and Castillo‐
Jordán, 2018b).
2. Natural mortality, M, is fixed (0.15) in the model.
3. Recruitment residuals are estimated from 1989‐2012, with the last recruitment event
estimated five years before the most recent available data, compared to 3 years before the
most recent data in the 2015 assessment.
4. An updated tuning procedure has been used to balance the weighting of each of the data
sources that contribute to the overall likelihood function, using Francis weighting for length
data (Francis, 2011), Punt weighting for the conditional age‐at‐length data (Punt, 2017),
balancing the CPUE series within Stock Synthesis, and improvements to the recruitment
bias ramp adjustment.
5. Discards were estimated separately, using estimates of discard rates and retention
estimated from discard length frequencies. The 2015 assessment ignored discarding in the
west.
6. Discard rates for Tier 1 assessments are required by fishing fleet. This means that the
discard estimates for TAC purposes used for Tier 3 and 4 assessments which are provided
in the discard report (Burch et al., 2018) cannot be used in Tier 1 assessments. The discards
from Burch et al. (2018) are produced using a set of rules to determine, for the entire
quota fishery, whether sufficient data are available to make an annual fishery wide discard
estimate. The discard rates calculated for and input to Tier 1 stock assessments are used to
fit retention selectivity curves, so individual year values are not greatly influential on model
estimated discard rates.
7. The Tier 1 discard estimates have been updated in 2018 to more closely match the discard
calculations in Bergh et al. (2009). These estimates use ratios of total discards to (retained
+ discard) catch on a per shot basis, rather than aggregated across a whole strata, which
are then weighted up according to CDR landings within zone and season (N. Klaer, pers.
comm.).
The usual process of bridging to a new model by adding new data piecewise and analysing which
components of the data could be contributing to changes in the assessment outcome was
conducted (Day and Castillo‐Jordán, 2018a).
Western Jackass Morwong (Nemadactylus macropterus) stock assessment based on data up to 2017 | 132 Methods 2.1 The data and model inputs 2.1.1 Biological parameters A single‐sex model (i.e. both sexes combined) was used, as the length composition data for Jackass morwong are not available by sex. Age‐at‐length data was used as an input, with all four parameters of the von Bertalanffy growth equation fixed at the values obtained for the eastern stock (Day and Castillo‐Jordán, 2018b). This follows the approach first adopted in the 2015 assessment (Tuck et al., 2015), which was due to limited data and inconsistencies between different years of data leading to poor fits to the growth curve estimated for the west. As in the 2015 assessment, M was fixed in the model at 0.15 and the base‐case value for the steepness of the Beverton‐Holt stock‐recruitment relationship, h, is 0.7. Jackass morwong become sexually mature at a length of about 24.5 cm, when the fish are around four years of age. Maturity is modelled as a logistic function, with 50% maturity at 24.5 cm fixed in the assessment. Fecundity‐at‐length is assumed to be proportional to weight‐at‐length. The parameters of the length‐weight relationship are obtained from Smith and Robertson (1995) (a=1.7 × 10‐5, b=3.031). 2.1.2 Fleets The assessment data for the western stock of jackass morwong comprises a single fleet: 1. Western trawl – otter trawlers from SESSF Zones 40 and 50 (1986 – 2017) 2.1.3 Landed catches The model uses a calendar year for all catch data. Landings data come from the Commonwealth logbook records for SESSF Zones 40 and 50, scaled up to the Catch Disposal Records (CDRs), in the same proportion as the ratio logbook totals for the same zones to the logbook total for all zones. Annual landed catches used in this assessment are shown in Figure 1, Figure 2 and listed in Table 1. In order to calculate the RBC for 2019, it is necessary to estimate the calendar year catch for 2018. Without any other information, the 2018 catch was assumed to be the same as the 2017 catch. The recent TAC history, which only applies to the combined eastern and western stocks, is also listed in Table 1, alongside the catches of western stock of jackass morwong. The percentage of total catch taken in the west is quite variable, averaging around 20% since 1998, but ranging from 7% (in both 1998 and 2014) to 39% (2017). 14 | Western Jackass Morwong (Nemadactylus macropterus) stock assessment based on data up to 2017
Figure 1. Total landed catch (tonnes) of western jackass morwong from 1986‐2017 (stacked).

                                Western Jackass Morwong (Nemadactylus macropterus) stock assessment based on data up to 2017 | 15
Figure 2. Total landed catch (tonnes) of western jackass morwong from 1986‐2017 (lines). 16 | Western Jackass Morwong (Nemadactylus macropterus) stock assessment based on data up to 2017
Table 1. Total retained catches (tonnes) of western jackass morwong for calendar years from 1986‐2017 and TAC
(combined eastern and western stocks) for 1992‐2018.

                                            Year         Catch         TAC
                                              1986           153
                                              1987             60
                                              1988             67
                                              1989             85
                                              1990             83
                                              1991             47
                                              1992             72         1500
                                              1993             27         1500
                                              1994             27         1500
                                              1995             91         1500
                                              1996             44         1500
                                              1997             62         1500
                                              1998             65         1500
                                              1999             90         1500
                                              2000           134          1200
                                              2001           320          1185
                                              2002           289           950
                                              2003           198           960
                                              2004           217           960
                                              2005           232           960
                                              2006           217          1200
                                              2007           140           878
                                              2008           122           560
                                              2009             77          450
                                              2010             47          450
                                              2011             99          450
                                              2012             41          568
                                              2013             42          568
                                              2014             13          568
                                              2015               9         598
                                              2016             30          474
                                              2017             87          513
                                              2018                         505

                               Western Jackass Morwong (Nemadactylus macropterus) stock assessment based on data up to 2017 | 17
2.1.4 Discard rates
Information on the discard proportions of jackass morwong by fleet is available from the ISMP for
1994‐2016. This program was run by PIRVic from 1992‐2006 and by AFMA from 2007. These data
are summarised in Table 2. Discard rates were estimated from on‐board data which gives the
weight of the retained and discarded component of those shots that were monitored (Burch et al.,
2018). Discard proportions vary amongst years, and have been as high as 12% (in 2012).
Table 2. Discard proportions from 1994 to 2017 with sample sizes for each data point. Entries in grey indicate data
that are not used either due to small sample size (less than 10 samples – although there are none of these here) or
because the value is too close to zero (less than 0.02).
Year discard n
proportion
1994 0.0111 46
1995
1996 0.0129 53
1997
1998 0.0042 29
1999
2000 0.0413 17
2001 0.0011 45
2002 0.0013 38
2003 0.0560 17
2004 0.0003 49
2005 0.0058 111
2006 0.0063 29
2007
2008 0.0072 23
2009 0.0087 12
2010
2011 0.0362 32
2012 0.1210 18
2013 0.0286 33
2014 0.0748 16
2015
2016 0.0290 21
2017 0.0644 22
Discard practices can be variable between years for reasons that are difficult to model, such as
changes in market demands or issues with quota availability, with some years having very low
discard rates and others having considerable discard rates. Without a mechanism to explain these
years of very low discarding, discarding practices are assumed to be constant through time
Including those years with very low discard rates forces the model to fit very low discard rates to
all years, due to the low absolute variation associated with low discard rates, even those years
when discarding is known to be higher, and underestimates discarding over all years. As a result,
years with very low discard proportions (less than 2%) are excluded as inputs to stock synthesis
(the greyed figures in the proportion columns in Table 2) giving more believable estimates of
discarding in general. Note that any discard estimate coming from a sample size of less than 10
would also be excluded as it is unlikely to be representative of typical discarding practices.
18 | Western Jackass Morwong (Nemadactylus macropterus) stock assessment based on data up to 2017Observations were then used to estimate discard rates (Figure 3) and hence discarded catches for
each fleet (Figure 4), with estimated discard rates of between 3% and 5% for the trawl fleet, and
less than 10 t in all years.
Figure 3. Model estimates of discard fractions by fleet, western trawl (blue).
Western Jackass Morwong (Nemadactylus macropterus) stock assessment based on data up to 2017 | 19Figure 4. Estimated discards (tonnes) of jackass morwong (Zones 40 and 50) in the SESSF from 1986‐2017, otter trawl (blue). 20 | Western Jackass Morwong (Nemadactylus macropterus) stock assessment based on data up to 2017
2.1.5 Catch rate and FIS abundance indices

Catch and effort data from the SEF1 logbook database were standardised using GLMs to obtain
indices of relative abundance (Sporcic and Haddon (2018b); Table 3) from the period 1986‐2017
for the western trawl fleet. In the stock synthesis assessment, the coefficient of variation is initially
set at a value equal to the root mean squared deviation from a loess fit (Sporcic and Haddon,
2018a) and additional variance is estimated for this CPUE index to tune the input and output
variances.
Table 3. Standardised catch rate indices and coefficient of variation (Sporcic and Haddon, 2018b) for the western
trawl fleet for western jackass morwong and the FIS abundance indices. The coefficient of variation is initially set at
a value equal to the root mean squared deviation from a loess fit (Sporcic and Haddon, 2018a).

                                 Year      Catch rate        cv          FIS            cv
                                    1986        2.060        0.192
                                    1987        1.617        0.192
                                    1988        2.392        0.192
                                    1989        1.728        0.192
                                    1990        1.751        0.192
                                    1991        1.183        0.192
                                    1992        0.969        0.192
                                    1993        0.924        0.192
                                    1994        0.902        0.192
                                    1995        0.931        0.192
                                    1996        1.043        0.192
                                    1997        0.822        0.192
                                    1998        0.833        0.192
                                    1999        0.755        0.192
                                    2000        1.195        0.192
                                    2001        1.273        0.192
                                    2002        1.281        0.192
                                    2003        1.085        0.192
                                    2004        1.151        0.192
                                    2005        1.247        0.192
                                    2006        0.988        0.192
                                    2007        0.824        0.192
                                    2008        0.845        0.192        51.564        0.335
                                    2009        0.669        0.192
                                    2010        0.497        0.192        25.525        0.335
                                    2011        0.525        0.192
                                    2012        0.392        0.192        39.263        0.335
                                    2013        0.369        0.192
                                    2014        0.288        0.192         7.269        0.335
                                    2015        0.369        0.192
                                    2016        0.432        0.192         7.031        0.335
                                    2017        0.664        0.192

The restrictions used in selecting data for analysis for Danish seine fleet were: (a) vessels had to
have been in the fishery for three or more years, (b) the catch rate had to be larger than zero and
(c) catches in zone 40 and 50 only.
Abundance indices for western jackass morwong for the FIS surveys conducted between 2008 and
2016 are provided in Table 3. FIS abundance values are reported for all years for jackass morwong

                                 Western Jackass Morwong (Nemadactylus macropterus) stock assessment based on data up to 2017 | 21
for the whole fishery (east and west, Knuckey et al., 2015, Knuckey et al., 2017), but only
separated into zones reflecting the fleets used in Tier 1 assessments in 2016 in this report. The
2016 value for western jackass morwong (Knuckey et al., 2017) is listed in Table 3, along with
values calculated previously for the earlier FIS years and first reported here. As with the CPUE
indices, the coefficient of variation is initially set at a value equal to the root mean squared
deviation from a loess fit (Sporcic and Haddon, 2018a) and additional variance is estimated for this
abundance index to tune the input and output variances.
2.1.6 Length composition data
Port and onboard length composition data are both used separately, with the gear selectivity
estimated jointly from both port and onboard data, as is the standard practice in the SESSF stock
assessments. For onboard data, the number of shots, is considered to be more representative of
the information content in the length frequencies than the number of fish measured. For port
data, the number of shots is not available, but the number of trips can be used instead. In the
2018 assessment, the initial sample size associated with each length frequency in the assessment
is the number of shots or trips.
Length data were excluded for years with less than 100 individual fish measured, as this was
considered to be unrepresentative (with excluded data listed in grey in Table 4 and Table 5).
Sample sizes for retained length frequencies, including both the number of individuals measured
and number of trips are listed in Table 5 for each fleet and year for the period 1996‐2017 and for
discarded length frequencies in Table 4 for the period 1994‐2016.
Length composition information for the retained component of the catch by the western
Commonwealth trawl fleet is available from port sampling for the period 1996‐2017 and from
onboard sampling from 1997‐2017. Onboard data collected by the ISMP were used to calculate
the length frequency of the discarded component of the catch for six years only from 1994‐2016.
Table 4. Number of onboard discarded lengths and number of shots for length frequencies included in the base case
assessment by fleet 1994‐2016. Entries in grey indicate data that are not used due to small sample size (less than
100 fish measured) or, in the case of the 1994 sample, because SERAG decided that the sample looked
unrepresentative.
year fleet (discard)
western western
trawl trawl
# fish # shots
1994 233 2
2009 112 1
2011 9 2
2012 59 10
2013 23 8
2016 86 4
22 | Western Jackass Morwong (Nemadactylus macropterus) stock assessment based on data up to 2017Table 5. Number of port and onboard retained lengths and number of shots or trips for length frequencies included
in the base case assessment by fleet 1996‐2017. Entries in grey indicate data that are not used due to small sample
size (less than 100 fish measured).
year fleet (retained)
trawl trawl
onboard trawl port FIS onboard trawl port FIS
# fish # fish # fish # shots # trips # shots
1996 364 3
1997 245 505 2 4
1998 373 2 4 1
1999 412 341 4 3
2000 124 572 1 5
2001 1434 2232 11 18
2002 859 1918 4 12
2003 124 1680 1 10
2004 397 873 3 10
2005 2116 1426 15 14
2006 820 690 6 7
2008 47 109 512 2 1 15
2009 140 4
2010 72 300 2 16
2011 208 9
2012 318 362 17 14
2013 723 53 25 1
2014 241 61 434 6 1 19
2015 151 3
2016 284 359 366 5 8 15
2017 324 210 6 5
2.1.7 Age composition data
An estimate of the standard deviation of age‐reading error was calculated by André Punt (pers.
comm., 2018) using data supplied by Kyne Krusic‐Golub and a variant of the method of Richards et
al. (1992) (Table 6). Age‐at‐length measurements provided by Kyne Krusic‐Golub of Fish Ageing
Services Pty Ltd, are available from 1991‐2017 for the western trawl fleet (Table 7).
Western Jackass Morwong (Nemadactylus macropterus) stock assessment based on data up to 2017 | 23Table 6. Standard deviation of age reading error (A Punt pers. comm. 2018).
Age sd
0.5 0.255696
1.5 0.255696
2.5 0.27765
3.5 0.300684
4.5 0.324851
5.5 0.350208
6.5 0.376813
7.5 0.404727
8.5 0.434015
9.5 0.464744
10.5 0.496985
11.5 0.530813
12.5 0.566306
13.5 0.603546
14.5 0.642618
15.5 0.683613
16.5 0.726626
17.5 0.771756
18.5 0.819106
19.5 0.868787
20.5 0.920913
21.5 0.975604
22.5 1.03299
23.5 1.09319
24.5 1.15636
25.5 1.22264
26.5 1.29218
27.5 1.36514
28.5 1.4417
29.5 1.52202
30.5 1.60629
24 | Western Jackass Morwong (Nemadactylus macropterus) stock assessment based on data up to 2017Table 7. Number of age‐length otolith samples included in the base case assessment for the western trawl fleet
1991‐2017.
Year otoliths
1991 94
1992 83
1993 42
1995 28
2003 83
2004 474
2005 282
2006 156
2007 51
2009 49
2011 41
2012 87
2013 118
2014 37
2015 71
2016 103
2017 59
Implied age distributions for retained and discarded fish are obtained by transforming length
frequency data to age data by using the information contained in the conditional age‐at‐length
data from each year and the age‐length relationship. Implied age distributions can be calculated
separately for both onboard and port fleets and for the retained and discarded length frequencies,
and can be calculated from 1997‐2017 for the western trawl fleet.
2.1.8 Input data summary
The data used in this assessment is summarised in Figure 5, indicating which years the various data
types were available.
Western Jackass Morwong (Nemadactylus macropterus) stock assessment based on data up to 2017 | 25Figure 5. Summary of input data used for the western jackass morwong assessment. 2.2 Stock assessment method 2.2.1 Population dynamics model and parameter estimation A single‐sex stock assessment for western jackass morwong was conducted using the software package Stock Synthesis (version SS‐V3.30.12.00, Methot et al. 2018). Stock Synthesis is a statistical age‐ and length‐structured model which can allow for multiple fishing fleets, and can be fitted simultaneously to the types of information available for jackass morwong. The population dynamics model, and the statistical approach used in the fitting of the model to the various types of data, are described in the SS technical documentation (Methot, 2005) and are not reproduced here. Some key features of the base‐case model are: (a) Jackass morwong constitute a single stock within the area of the fishery (SESSF Zones 40 and 50). (b) The population was at its unfished biomass with the corresponding equilibrium (unfished) age‐structure at the start of 1986. (c) The CVs of the CPUE indices for the western trawl fleets were initially set to the root mean squared deviation from a loess fit to the fleet specific indices (Sporcic and Haddon, 2018a) and 26 | Western Jackass Morwong (Nemadactylus macropterus) stock assessment based on data up to 2017
then tuned to match the model‐estimated standard errors by estimating an additional variance
parameter within Stock Synthesis.
(d)    One fishing fleet is modelled.
(e)     The selectivity pattern for the western trawl fleet was modelled as length‐specific, logistic
and time‐invariant. The two parameters of the selectivity function for this fleet were estimated
within the assessment.
(f)     Retention was also defined as a logistic function of length, and the inflection and slope of
this function were estimated.
(g)    The rate of natural mortality, M, is assumed to be constant with age, and also time‐
invariant. The value for M was fixed (0.15) within the model in this assessment.
(h)     Recruitment to the stock is assumed to follow a Beverton‐Holt type stock‐recruitment
relationship, parameterised by the average recruitment at unexploited spawning biomass, R0, and
the steepness parameter, h. Steepness for the base‐case analysis is set to 0.7. Deviations from the
average recruitment at a given spawning biomass (recruitment residuals) are estimated for 1989
to 2012. Deviations are not estimated prior to 1989 or after 2012 because there are insufficient
data to permit reliable estimation of recruitment residuals outside of this time period.
(i)    The value of the parameter determining the magnitude of the process error in annual
recruitment, σR, is set equal to 0.7 in the base case. The magnitude of bias‐correction depends on
the precision of the estimate of recruitment and time‐dependent bias‐correction factors were
estimated following the approach of Methot and Taylor (2011).
(j)    A plus‐group is modelled at age thirty years.
(k)    Growth of jackass morwong is assumed to be time‐invariant, meaning there is no change
over time in mean size‐at‐age, with the distribution of size‐at‐age being estimated along with the
remaining growth parameters within the assessment. No differences in growth related to gender
are modelled, because the stock is modelled as a single‐sex.
(l)     The sample sizes for length and age frequencies were tuned for each fleet so that the input
sample size was approximately equal to the effective sample size calculated by the model. Before
this retuning of length frequency data was performed by fleet, any sample sizes with a sample size
greater than 100 trips or 200 shots were individually down‐weighted to a maximum sample size of
100 and 200 respectively.

2.2.2 Relative data weighting

Iterative reweighting of input and output CVs or input and effective sample sizes is an imperfect
but objective method for ensuring that the expected variation is comparable to the input (Pacific
Fishery Management Council, 2018). This makes the model internally consistent, although some
argue against this approach, particularly if it is believed that the input variance is well measured
and potentially accurate. It is not necessarily good to down weight a data series just because the
model does not fit it, if in fact, that series is reliably measured. On the other hand, most of the
indices we deal with in fisheries underestimate the true variance by only reporting measurement
and not process error.

                             Western Jackass Morwong (Nemadactylus macropterus) stock assessment based on data up to 2017 | 27
You can also read