What Can My Patients Eat? - Nutrition Basics for Chronic Kidney Disease Melissa Prest MS RDN CSR LDN - Nutricia Learning Center
←
→
Page content transcription
If your browser does not render page correctly, please read the page content below

What Can My Patients Eat?
Nutrition Basics for Chronic
Kidney Disease

Melissa Prest MS RDN CSR LDN
December 12, 2018
About Me

Disclosures
Honorarium provided by Nutricia
None pose any conflict of interest for this presentation
The opinions reflected in this presentation are those of the
speaker and independent of Nutricia North America
Learning Objectives

1.   Distinguish nutrition recommendations and
     medical nutrition therapy through each stage of
     chronic kidney disease.
2.   Explain nutritional considerations for special
     populations with chronic kidney disease.
3.   Identify common nutrition interventions used in
     chronic kidney disease patients.
Focus on the Patient
     Quality of Life
Quality of Life
Quality of life (QOL) – subjective evaluation of a person’s
perception about his or her happiness and satisfaction with
his or her life and environment
Health-related quality of life (HR-QoL) – a person’s
physical health, psychological state, independence, and
social relationships
1. Zabel R, et al. Appetite. 2012; 59:194-199
2. Buckner S, Dwyer J. J Ren Nutr. 2003;13(4):295-302
Quality of Life
Compared to healthy counterparts, patients
treated with maintenance hemodialysis (MHD)
have lower reported scores on HR-QoL tools
HR-QoL is often decreased in any patient dealing
with the burden of chronic illness
Decreases in HR-QoL is associated with
increased rates of morbidity and mortality
1. Zabel R, et al. Appetite. 2012; 59:194-199
3. Iyasere O, Brown E. Postgrad Med J. 2014;90:340-347
4. Han H, et al. J Ren Nutr. 2012;22(2):237-243
Determinants of HR-QoL
Determinants of HR-QoL in patients on MHD
include:
Disease
Symptom burden
medications, dialysis, fatigue, comorbidities
Other non-renal factors affect HR-QoL
3. Iyasere O, Brown E. Postgrad Med J. 2014;90:340-347
Factors affecting Survival
Factors that affect HR-QoL and Survival
Decreased cognition
Depression more common
Physical function poorer
Caregiver burden increased
Work status disrupted
Nutrition/diet restricted
3. Iyasere O, Brown E. Postgrad Med J. 2014;90:340-347
Depression and HR-QoL
Depression is an independent risk factor for mortality
and common in chronic illness due to high symptom
burden
In patients treated with MHD, depression often leads to
poor dietary intake and poor adherence to treatment
prescription
Depression has also been reported to be associated
with increased hospitalization, sexual dysfunction,
increased infection rates, sleep disturbance, disease
progression, and treatment withdrawal
3. Iyasere O, Brown E. Postgrad Med J. 2014;90:340-347Nutrition and Quality of Life
Patients on MHD with poor nutritional status often report decreased
HR-QoL, reported changes that lead to poorer nutrition status include:
Altered food preferences
Gastrointestinal symptoms
Decreased dietary intake
Sensory changes
Psychosocial concerns
Decreases in HR-QoL usually occur before negative changes in nutritional
status are present
1. Zabel R, et al. Appetite. 2012 2. Buckner S, Dwyer J. J Ren Nutr. 2003 4. Han H, et al. J Ren Nutr. 2012 5. Burrows J, et al. J Ren Nutr. 2002
6. Allen K, et al. J Ren Nutr. 2002 7. Laegreid I, et al. Ren Fail. 2014 8. Dwyer J, et al. J Ren Nutr. 2002 9. Laws R, et al. J Ren Nutr. 2000
10. Mazairac A, et al. J Ren Nutr. 2011 11. Feroze U, et al. Clin J Am Soc Nephrol. 2011What is in the Literature?
Author Subjects Measure Result
Dwyer et al. J Ren Nutr. 1,387 MHD patients from HR-QoL physical Nutrition markers (albumin,
2002. the Hemodialysis (HEMO) component scores (PCS) to creatinine) highly correlated
Study nutritional status with PCS
Allen et al. J Ren Nutr. 1,545 MHD patients from Nutrition factors compared Serum albumin, creatinine,
2002. HEMO study to Short Form-36 (SF-36) and calf circumference were
independently associated
with the PCS score (P ≤
.001)
Vero et al. J Ren Nutr. 94 MHD patients Cross-sectional secondary A statistically significant
2013. analysis using the SF-36 relationship was reported
and 7-point scale subjective between SGA and PCS
global assessment (SGA) score (β = 0.275, t = 2.57, P
= .012)Chronic Kidney Disease Introduction to CKD and Inflammation
WHAT DO THE KIDNEYS DO?

❖   Remove waste products from the blood
❖   Balance chemicals in the body
❖   Regulate the building of bones
❖   Regulate blood pressure
❖   Control red blood cell production
❖   Regulate water
What happens when Your Kidneys Fail

❖   Increase in uremic toxins
❖   Difficulty to control blood pressure
❖   Dysregulation of bone mineral metabolism
❖   Decreased red blood cell production leading to anemia
❖   Fluid retention and reduced urine production
❖   Acid base disorders
Causes of CKD
❖ Causes - hypertension, Diabetes, Peripheral vascular disease
(small vessels), glomerulonephritis, Polycystic kidney disease,
Alports Disease
❖ Acute - drug induced, dehydration, overdoses, hydronephrosis
❖ Diabetes - long history of diets/medications/illness
Is patient very early?
Microalbuminemia or traces of protein without increased creatinine or farther
advanced
Not interested/able to make drastic diet changes?
Be specific about changes desired - consider effects on BS with changes of
compostion - early patients - obtain optimal control of BS and BPStages of CKD
CKD stage Description Possible signs & symptoms eGFR
Stage 1 Kidney damage with normal 90 or higher
kidney function
High blood pressure, swelling in legs, urinary
Stage 2 Kidney damage with mild loss tract infections or abnormal urine test 89-60
of kidney function
Stage 3 3a: Mild to moderate loss of Low blood count, malnutrition, bone pain, 3a: 59-45
kidney function; unusual pain, numbness or tingling, decreased 3b: 44-30
mental sharpness or feeling unwell.
3b: Moderate to severe loss of
kidney function
Stage 4 Severe loss of kidney function Anemia, decreased appetite, bone disease or 29-15
abnormal blood levels of phosphorus, calcium
or vitamin D
Stage 5 Kidney failure and need for Uremia, fatigue, shortness of breath, nausea, Less than 15
End stage renal transplant or dialysis vomiting, abnormal thyroid levels, swelling in
disease (ESRD) hands/legs/eyes/ lower back or lower back painInflammation in CKD
Low grade, systemic inflammation common in advanced
stages of CKD
Linked to acquired immune dysfunction, metabolic and
nutritional derangements, and Protein Energy Wasting
(PEW)
Persistent inflammation associated with premature general
and vascular aging
16. Machowska A, et al. Transl Res. 2016;167(1):204-213
17. Akchurin O, Kaskel F. Blood Purif. 2015;39:84-92Causes of Inflammation in CKD 16. Machowska A, et al. Transl Res. 2016;167(1):204-213 17. Akchurin O, Kaskel F. Blood Purif. 2015;39:84-92
Consequences of Inflammation

                                                          Comorbidities

                                     Metabolic and
                                       Nutritional        Inflammation    PEW
                                     Derangements

                                                          Anemia and
                                                             EPO
                                                          Resistance

16. Machowska A, et al. Transl Res. 2016;167(1):204-213
17. Akchurin O, Kaskel F. Blood Purif. 2015;39:84-92
Medical Nutrition Therapy
Goals and ApplicationMedical Nutrition Therapy Goals
❖ Slow or stop the rate of progression of the
kidney disease
❖ Maintain good nutritional status
❖ Prevent or minimize the side effects of
uremia or chemical imbalancesFactors that can cause or exacerbate malnutrition in patients with kidney disease ❖ Increased needs for calories and protein ❖ Protein losses in treatments ❖ Inadequate dialysis treatment ❖ Anorexia/ decreased oral intake ❖ Excessive dietary restrictions ❖ Psychosocial problems ❖ Other illness (CA, HIV, DM)
Nutrition Assessment
Nutritional screening to identify nutrition related
problems
Use a team approach – nurses may be the first to
notice signs of malnutrition (Comprehensive
Interdisciplinary Patient Assessment)Parts of the Interdisciplinary Assessment
Co-Morbid Conditions Renal bone disease
Dialysis Prescription Nutritional Status
Blood Pressure Psychosocial Needs
Fluid Management Access Type
Laboratory Profile Patient participation
Medication History Transplant status
Anemia Family Support
Activity LevelNutrition Assessment
Nutritional Status Prescribed and over the
Hydration Status counter meds
Metabolic Parameters Previous diets or nutrition
(diabetes) education
Anthropometrics Route of Nutrition
Appetite and intake Self Management skills
Gastrointestinal Issues Attitude and MotivationCore Components to Renal Diet ❖ Adequate calories ❖ Adequate protein ❖ Reduced sodium ❖ Phosphorus control (high or low) ❖ Potassium control (high or low) ❖ Fluid management ❖ Micronutrients
Recommendations

                    HD            PD             Pre-Dialysis/
                                                 CKD
       Protein:     Moderate to   High Needs     Restricted
                    High Needs
       K+:          Restricted    Unrestricted   May be
                                                 restricted
       Na:          Restricted    Mild           May be
                                  Restriction    restricted

       Fluid:       Restricted    Usually not    May be
                                  restricted     restricted
       Phosphorus   Restricted    Restricted     Usually
                                                 Restricted
Energy/Calories
Needs for calories differ for each
stage of renal failure and ageCalories
Provides energy for body functions
Present in
carbohydrates
fats
protein
Caloric needs
30 - 35 kcal/kg/day of lean body weightProtein
Necessary to make and repair cells
Essential for growth and maintenance of body tissue
Provides energy
Essential to maintain osmotic pressure and fluid balance in
bloodProtein
Needs
Acute - 0.6 - 0.8 g/kg
CKD - 0.6 - 0.75 g/kg
HD – 1.2 g/kg
PD – 1.2 – 1.3 g/kg
Transplant
1.3 – 2.0 post op
0.8 – 1.0 chronicProtein/Albumin
Protein food sources
Meat, poultry, fish, eggs, cottage cheese
Plant based protein sources
Protein supplements
Protein Powders
High Protein snack bars
High Calorie Renal Liquid ONS
Lower Calorie Non-Renal Liquid ONS
Hydrolyzed Concentrated protein
Tips to increase protein in diet
Mini-meals 4-6 per day
Protein at every mealPotassium
Needs
Acute 2 g
CKD – unrestricted unless
high
HD – 2 – 3 g
PD – 3 – 4 g
Transplant – Unrestricted
unless highFood sources of Potassium Banana Orange Juice Cantaloupe / Melon V8 Tomato Prunes Potato / French Fries Raisins Pear Mango Gatorade Avocado Potato Chips Milk (also soy milk) Processed Foods Nuts
Sodium
Needs
Acute 1 – 2 g
CKD 1 – 3 g
HD 1 – 3 g
PD 2 – 4 g
Transplant 2 – 4 g
Excessive salt restricted
Recommend ~2,000 mg.
Recommendation for average American is 2300 mg
Average intake is 4000 mg
The vast majority of the sodium consumed is from processed and restaurant
foods; only a small portion is used in cooking or added at the table.Fluid
Needs
Acute – Output plus 500 cc
CKD – no restriction
HD – Output plus 1000 cc
PD – Maintain balance
Transplant – unrestricted
unless overloadedPhosphorus
Needs
Acute – maintain WNL
CKD – 10 mg/kg/day
HD – 17 mg/kg or 10-12
mg/gm protein
PD – Same as HD
Transplant - RDAPhosphorus
❖ Phosphorus is restricted in HD and PD.
❖ Phosphorus is not well dialyzed.
❖ Phosphorus found naturally in many foods and is added to
almost EVERYTHING in food processing!
❖ Organic (naturally occurring sources) better than inorganic
(food additives) for phosphorus control
❖ Diet, dialysis, binders for controlQuick Guide to Food Labels: For those with kidney disease
SERVING SIZE:
Look here first. Make sure you calculate how
much you’re getting based on the serving size
SODIUM:
Look at the “mg” and NOT the “%”
Less thank 2000mg/day
Less than 600 mg/meal
Less than 100-200 mg/snack
POTASSIUM:
This listing is not required. No listing doesn’t
mean no potassium.
Low Potassium: < 100mg or 300mg or >9%Quick Guide to Food Labels: For those with kidney disease
PHOSPHORUS:
Low phosphorus: < 50mg or 150mg or >15%
Phosphorus usually is not on the label,
so you will have to read the ingredient
list. Look for words with “phos” in them.
Phosphoric Acid
Hexametaphosphate
Monocalcium Phosphate
Tricalcium Phosphate
Stay away from added phosphorus. It can easily add
up to 1000mg phosphorus per day.Calcium
Needs
Acute – maintain serum
levels WNL
CKD – 1.0 – 1.5 gVitamins and other minerals
Vitamins
Water Soluble
Vitamin D
Minerals
Iron
ZincMicronutrient Deficiencies in Dialysis
Chronic HD pts have been documented as substantially protein-
energy malnourished
Kcal and protein intake shown to be significantly lower than
recommended levels for maintenance of body weight, lean body
mass and fat stores in HD pts
Chronic HD population at risk for reduced intake of vitamins,
minerals, trace elements associated with adequate energy, proteinPossibly deficient micronutrients Pyridoxine (Vitamin B6) Cyanocobalamin (Vitamin B12) Folic Acid Vitamin C Iron Zinc
Causes for micronutrient deficiencies
Uremia
alters disposition and metabolism of all aforementioned vitamins
and minerals
Losses of essential vitamins, minerals during processes of
HD
water-soluble vitamins easily cross HD membranes, lost in dialysate
more pronounced in high-flux than in high efficiency dialysisCauses for deficiencies (cont.)
Poor dietary intake
excessive dietary restriction (K+, phos)
suboptimal intake of HBV protein, carbohydrate, fat, overall
calories
Medications
anti-neoplastic, anti-convulsant
birth control, amino acid, or ethanol medications
anti-hypertensives i.e. hydralazine (B6)
most likely to impact B6, B12, folate statusGuidelines to Supplementation
Prevention and Maintenance
Generally, all HD pts benefit from supplementation of
water-soluble vitamins
Several products containing B-complex vitamins and
Vitamin C exist for use in HD populationGuidelines to Supplementation (Cont.)
Prevention and Maintenance
Conduct nutrition physical exam quarterly
Document and follow up areas of particular concerns
Monitor serum levels of nutrients for which deficiency is
suspected as indicated
Adjust supplementation PRNAnti-inflammatory Interventions 1. Increasing Fiber 2. Increasing Omega-3 Fatty Acids 3. Soy Intake 4. Pomegranate Juice 5. Decaffeinated Green Tea Extracts (catechins) 6. Decreasing Fructose Intake 7. Addition of Nuts and Seeds (gamma-tocopherol) 8. Adding Probiotics/Prebiotics 16. Machowska A, et al. Transl Res. 2016;167(1):204-213
Intestinal Microbiota
Progression of CKD associated with metabolic alterations that
change the balance of healthy and unhealthy bacteria in the gut
Cause bacterial overgrowth, loss of barrier integrity, and
increase in bacterial translocation
May contribute to CKD progression, accelerated atherogenesis,
and PEW
16. Machowska A, et al. Transl Res. 2016;167(1):204-213
18. Rossi M, et al. J Ren Nutr. 2015;25(5):399-403
19. Ramezani A, Raj D. J Am Soc Nephrol. 2014;25(4):657-670Modulation of Gut Microbiota Prebiotics Probiotics Dietary Fiber 19. Ramezani A, Raj D. J Am Soc Nephrol. 2014;25(4):657-670
Dietary Fiber
Fiber adds a benefit in CKD patients to the integrity of the
intestinal wall and reducing uremic toxins
Soluble Fiber
Insoluble Fiber
Resistant Starch
16. Machowska A, et al. Transl Res. 2016;167(1):204-213
19. Ramezani A, Raj D. J Am Soc Nephrol. 2014;25(4):657-670
20. Evenepoel P, Meijers B. Kidney Int. 2012;81(3):227-229Pre- and Probiotics
Live, beneficial bacteria (probiotics)
Have been consumed for thousands of years
Selectively fermented ingredient (prebiotic)
Available in foods, commercial supplements, and fortified foods
Used to re-establish microbial balance
Other benefits from non-CKD clinical trials suggest improvement in blood
glucose control, hypertension, weight management, and urinary tract
infections
Fundamental principle of dietetic practice is to recommend nutrients from food
sources first, followed by supplements
18. Rossi M, et al. J Ren Nutr. 2015;25(5):399-403
19. Ramezani A, Raj D. J Am Soc Nephrol. 2014;25(4):657-670
21. Moraes C, et al. Eur J Nutr. 2016Prebiotic
Non-digestible food ingredient that has a beneficial effect through its selective
stimulation of the growth or activity of one or a limited number of bacteria in
the colon
Inulin, fructo-oligosaccharides, galacto-oligosaccharides, soya-
oligosaccharides, xylo-oligosaccharides, and pryodextrins
Possibly promotes Bifidobacteria species, mediates weight loss, reduces
inflammation, and improves metabolic function
High fiber intake associated with lower risk of inflammation and reduced
mortality in CKD patients
19. Ramezani A, Raj D. J Am Soc Nephrol. 2014;25(4):657-670Prebiotic Food Sources Asparagus: inulin Rye Bread: inulin Canned Beans: galacto-oligosaccharide Lentils: galacto-oligosaccharide Nectarines: fructo-oligosaccharides *resistant starches 18. Rossi M, et al. J Ren Nutr. 2015;25(5):399-403 21. Moraes C, et al. Eur J Nutr. 2016
Probiotic Live organisms which offer a health benefit Bifidobacteria species, lactobacilli, and streptococci Can alter gut microbiota and affect the inflammatory state Animal studies shows prolonged life in CKD with probiotics Human studies shows decreases in uremic toxin 19. Ramezani A, Raj D. J Am Soc Nephrol. 2014;25(4):657-670
Probiotic Food Sources
Yogurt (fermented milk product): Lactobacillus bulgaricus and
Streptococcus thermophilus
Kefir (fermented milk beverage): Lactobacillus and Lactobobbus
genera, and yeast
Kombucha (tea): Gluconacetobacter, Lactobacillus and
Zygosaccharomyces (yeast)
Kimchi and Sauerkraut: Leuconostoc, Lactobacillus, Pediococcus and
Streptococcus genera
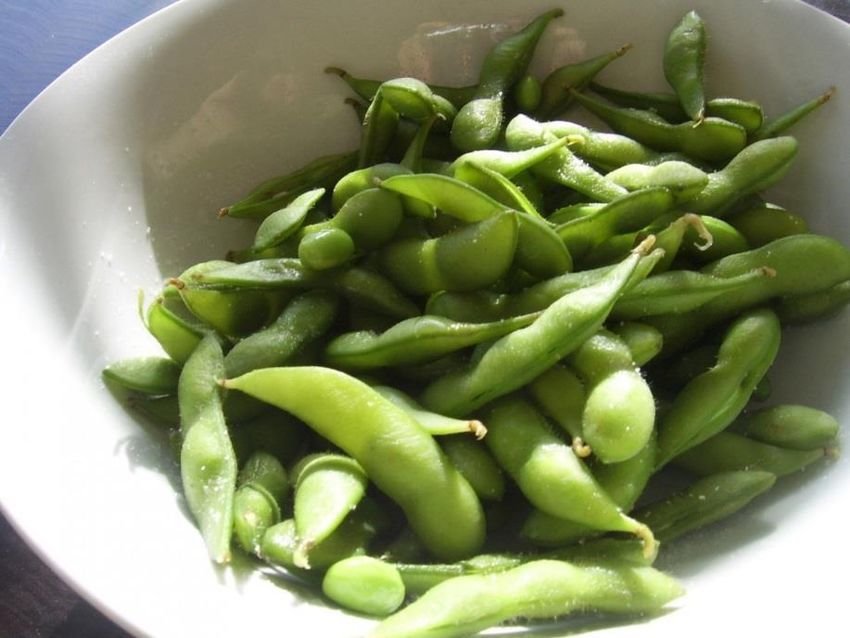
Natto (fermented soy beans): Bacillus subtilis specie
18. Rossi M, et al. J Ren Nutr. 2015;25(5):399-403Summary
References
1.   Zabel R, Ash S, King N, Juffs P, Bauer J. Relationships between appetite and
     quality of life in hemodialysis patients. Appetite. 2012; 59:194-199
2.   Buckner S, Dwyer J. Do we need a nutrition-specific quality of questionnaire for
     dialysis patients? J Ren Nutr. 2003;13(4):295-302
3.   Iyasere O, Brown E. Determinant of quality of life in advanced kidney disease:
     time to screen? Postgrad Med J. 2014;90:340-347
4.   Han H, Burrowes J, Houser R, et al. What is the impact of nutritional status on
     health-related quality of life in hemodialysis patients. J Ren Nutr. 2012;22(2):237-
     243
5.   Burrows J, Cockram D, Dwyer J, et al. Cross-sectional relationship between
     dietary protein and energy intake, nutritional status, functional status, and
     comorbidity in older versus younger hemodialysis patients. J Ren Nutr. 2002;
     12(2): 87-95
6.   Allen K, Miskulin D, Yan G, et al. Association of nutritional markers with physical
     and mental health status in prevalent hemodialysis patients from the HEMO study.
     J Ren Nutr. 2002;12(3):160-169
References
7. Laegreid I, Aasarod K, Bye A, et al. The impact of nutritional status, physical
function, comorbidity and early versus late start in dialysis on quality of life in older
dialysis patients. Ren Fail. 2014;36(1):9-16
8. Dwyer J, Larive B, Leung J, et al. Nutritional status affects quality of life in
hemodialysis (HEMO) study patients at baseline. J Ren Nutr. 2002;12(4):213-223
9. Laws R, Tapsell L, Kelly J. Nutritional status and its relationship to quality of life in a
sample of chronic hemodialysis patients. J Ren Nutr. 2000;10(3):139-147
10. Mazairac A, de Witt A, Penne L, et al. Protein-energy nutritional status and kidney
disease-specific quality of life in hemodialysis patients. J Ren Nutr. 2011;21(5):376-
386
11. Feroze U, Noori N, Kovesdy C, et al. Quality-of-life and mortality in hemodialysis
patients: roles of race and nutritional status. Clin J Am Soc Nephrol. 2011;6:1100-
1111References
12. Allen K, Miskulin D, Yan G, et al. Association of nutritional markers with physical
and mental health status in prevalent hemodialysis patients from the HEMO
study. J Ren Nutr. 2002;12(3):160-169.
13. Vero L, Byham-Gray L, Parrott JS, Steiber A. Use of the subjective global
assessment to predict health-related quality of life in chronic kidney disease
stage 5 patients on maintenance hemodialysis. J Ren Nutr. 2013;23(2):141-147
14. Moreira AC, Carolino E, Domingos F, et al. Nutritional status influences generic
and disease-specific quality of life measures in haemodialysis patients. Nutr
Hosp. 2013;28(3):951-957
15. Burrowes JD, Powers SN, Cockram DB, et al. Use of an appetite and diet
assessment tool in the pilot phase of a hemodialysis clinical trial: mortality and
morbidity in hemodialysis study. J Ren Nutr. 1996;6(4):229-232
16. Machowska A, Carrero J, Lindholm B, et al. Therapeutics targeting persistent
inflammation in chronic kidney diease. Transl Res. 2016;167(1):204-213References
17. Akchurin O, Kaskel F. Update on Inflammation in Chronic Kidney Disease. Blood
Purif. 2015;39:84-92
18. Rossi M, Johnson D, Campbell K. The kidney-gut axis: implications for nutrition
care. J Ren Nutr. 2015;25(5):399-403
19. Ramezani A, Raj D. The gut microbiome, kidney disease, and targeted
interventions. J Am Soc Nephrol. 2014;25(4):657-670
20. Evenepoel P, Meijers B. Dietary fiber and protein: nutritional therapy in chronic
kideny disease and beyond. Kidney Int. 2012;81(3):227-229
21. Moraes C, Borges N, Mafra D. Resistant starch for modulation of gut microbiota:
promising adjuvant therapy for chronic kidney disease. Eur J Nutr. 2016.CEU/CE Instructions
To receive your CEU/CE certificate:
1) Complete the webinar survey at: https://www.surveymonkey.com/r/nutritionckd
2) Once webinar code is obtained, visit www.NutriciaLearningCenter.com and click on
‘CE Credit Request’
**If you have not previously registered for NLC, you will need to register to obtain your CE certificate
3) Enter the webinar code obtained
4) Certificate will be visible for download on your NLC dashboard
For question on this Webinar, please email: NutritionServices@nutricia.com
or call: 1-800-365-7354Thank you!
Nutricia Learning Center
is provided by
Nutricia North America
© 2018 Nutricia North AmericaYou can also read