WHATCOM COUNTY COMPREHENSIVE ECONOMIC DEVELOPMENT STRATEGY (CEDS)
←
→
Page content transcription
If your browser does not render page correctly, please read the page content below
AUGUST 2021

WHATCOM COUNTY
COMPREHENSIVE ECONOMIC
DEVELOPMENT STRATEGY (CEDS)
2021-2025

Completed BY

Port of Bellingham
Economic development Division
Regional Economic Partnership (REP)

Whatcom County, WA ADO

                                               Questions or Comments?
                                                 Jennifer Noveck, Ph.D.
                                 Research & Communications Manager
                     Regional Economic Partnership, Port of Bellingham
                               Email: jennifern@portofbellingham.com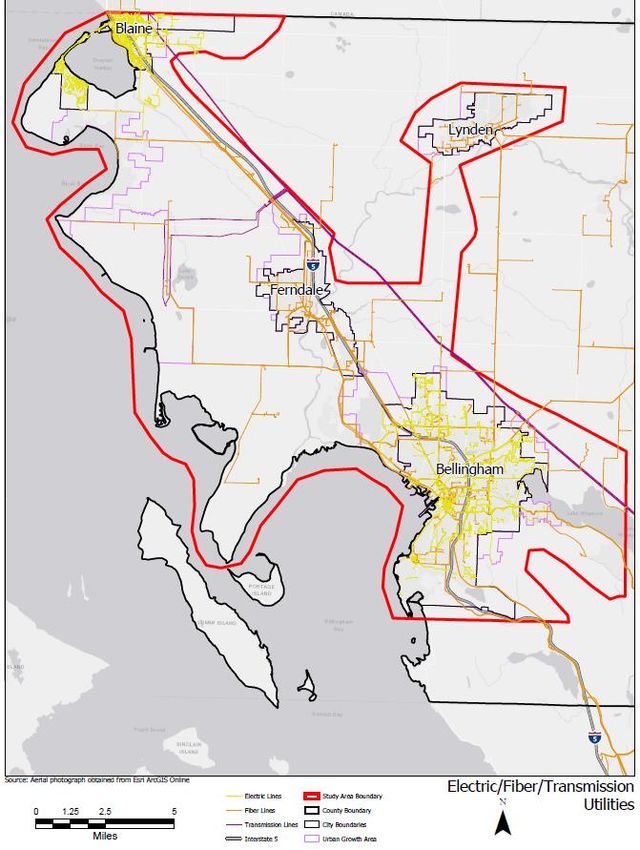
CEDS 2021-2025                //                             AUGUST 2021

                 ABOUT THE REGIONAL
                 ECONOMIC PARTNERSHIP
                 The Regional Economic Partnership (REP) is the
                 economic development division at the Port of
                 Bellingham, which is the associate development
                 organization (ADO), a state Commerce
                 designation, for Whatcom County. REP is funded
                 by Washington State Department of Commerce,
                 Whatcom County, the City of Bellingham, and the
                 Port of Bellingham.

                 REP MISSION
                 The goal of REP is to retain and attract livable
                 wage jobs and to assist businesses,
                 entrepreneurs, and local organizations to thrive.
                 We aim to work with our partners to create a
                 resilient community and economy for all. We
                 have expertise in financing, planning, research,
                 real estate, and technology to help businesses
                 start, develop, and grow throughout Whatcom
                 County, Washington.

                 CONTACT REP
                 web: https://www.portofbellingham.com
                 e-mail: EconDev@portofbellingham.com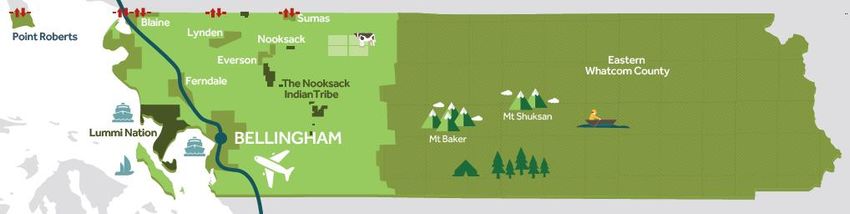
Whatcom County CEDS 2021-2025
Prepared by the Port of Bellingham’s economic development division

Contents
I. Summary Background .................................................................................................................................................... 2
    1. Introduction ............................................................................................................................................................ 2
    2. CEDS Purpose, Process & Review Committee ....................................................................................... 2
    3. Geography ................................................................................................................................................................... 4
    4. Infrastructure .............................................................................................................................................................. 5
    5. Economic Conditions & Statistical Description ................................................................................................. 10
II. SWOT Analyses ........................................................................................................................................................... 21
    1. Regional SWOT Analyses ....................................................................................................................................... 21
    2. Priorities..................................................................................................................................................................... 22
III. Action Plan ................................................................................................................................................................. 22
    1. Vision ......................................................................................................................................................................... 22
    2. Goals and Objectives .............................................................................................................................................. 23
    3. Strategy Implementation and Deliverables .......................................................................................................... 26
IV. Evaluation Framework .............................................................................................................................................. 36
    1. Performance Measures ............................................................................................................................................ 36
    2. Evaluation Plan ........................................................................................................................................................ 37
V. Economic Resiliency ................................................................................................................................................... 37
    1. Planning ..................................................................................................................................................................... 38
    2. Information Networks ............................................................................................................................................ 39
    3. Pre-Recovery Planning ............................................................................................................................................ 39
VI. Appendices .................................................................................................................................................................. 40
    1. Frequently Asked Questions by Stakeholders ..................................................................................................... 40
    2. Key Stakeholders...................................................................................................................................................... 41
    3. SWOT Analyses ....................................................................................................................................................... 43
    4. Reports and Strategic Documents ......................................................................................................................... 50
    5. Port of Bellingham Economic Development Division Reporting .................................................................. 51
    6. CEDS Project List 2021 Update ........................................................................................................................... 52
VII. References.................................................................................................................................................................. 53

                                                                                                                                                                                        1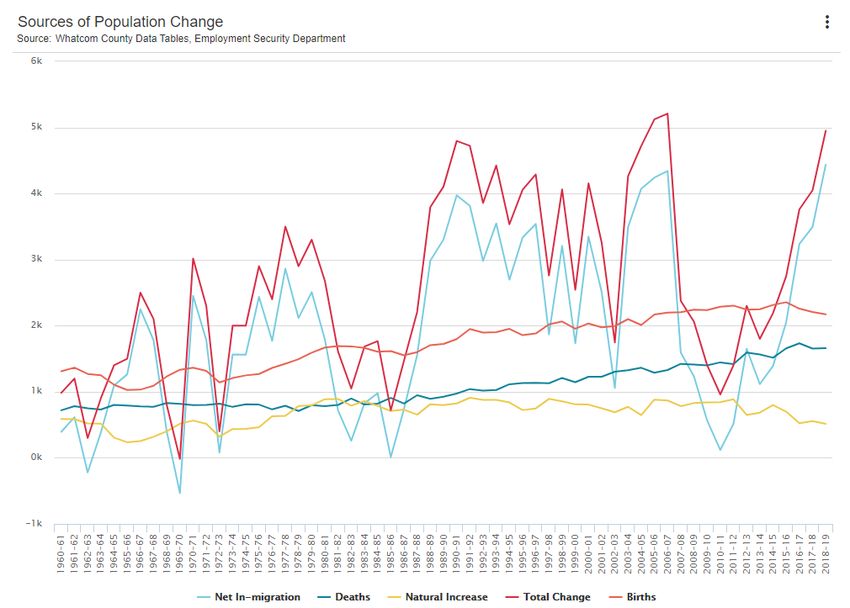
Whatcom County CEDS 2021-2025
Prepared by the Port of Bellingham’s economic development division

I. Summary Background
1. Introduction
The Regional Economic Partnership (REP), which is the economic development division of the Port of
Bellingham (POB), is responsible for economic development and growth for all of Whatcom County. The
division was rebranded as the “Regional Economic Partnership” (REP) in 2017 to signify the hub-and-spoke
model the team takes to development.1 REP strives for a sustainable, resilient regional economy through a
balanced and collaborative programmatic approach. The team works with the private, public, and nonprofit
sectors and connects businesses to economic development and workforce resources throughout Whatcom
County.
In 2012, the association development organization (ADO) status was transferred to the Port of Bellingham in
an effort to cultivate long-term consistency and generate a more programmatic approach to economic
development in Whatcom County. ADOs are local organizations working on economic development on
behalf of the Washington State Department of Commerce and each county has an ADO. This was a natural
fit as the POB, like all Port districts in Washington, is responsible for managing transportation gateways and
supporting economic development. With countywide jurisdiction, the Port is a great place to house the ADO.
REP benefits from being housed at the Port because resources from multiple sources are pooled, which
ultimately saves money. This collaborative model creates more security, allows for long-term planning, and
generates economic resiliency for all of Whatcom County. 2

2. CEDS Purpose, Process & Review Committee
The Whatcom County Comprehensive Economic Development Strategy (CEDS) has been completed and
updated two times in the recent past: in 2002 by the Port of Bellingham’s Economic Development division
and in 2015 by the Whatcom Council of Governments (WCOG). As the economic development ecosystem
in the county evolved and the Port’s economic development staff grew, the responsibility for updating the
CEDS report and project list were transferred from WCOG to the Port’s economic development division in
2019.
The 2021-2025 report update was led by the Port’s economic development staff, overseen by the CEDS
External Review Committee, and informed by broad stakeholder engagement within the community
throughout the entire process. Stakeholders included, but were not limited to Whatcom County, other
divisions of the Port of Bellingham, the seven incorporated cities, the Lummi Indian Business Council, the
Nooksack Indian Tribe, the Public Utility District (PUD) #1 and WCOG, the Northwest Workforce Council,
the Western Washington University Small Business Development Center, the Bellingham Regional Chamber
of Commerce, Whatcom County Business and Commerce Advisory Committee, health and social
organizations, and other economic and community development service providers. Team Whatcom, a local
county-wide group that forms the core of economic development services in the county, was solicited and
presented to multiple times throughout the process for feedback and input in 2020-2021. Appendix VI.2 has
a full list of stakeholders solicited for input.
Stakeholder engagement ran from summer 2020 through summer 2021 and involved:

          Identifying strategic priorities from the stakeholder’s perspective
          Soliciting input and feedback on goals, objectives, and strategies

1 The hub-and-spoke paradigm stems from transportation and distribution planning. The hub signifies a central point
and organizes routes on various outgoing and incoming spokes. As the ADO for Whatcom County, the economic
development department at the Port utilizes this concept to connect businesses to our partners and their many services.
2 Other ports that serve as the county ADO in Washington include Port of Chelan County, Port of Columbia, Port of

Douglas County, and the Port of Walla Walla.

                                                                                                                          2
Whatcom County CEDS 2021-2025
   Prepared by the Port of Bellingham’s economic development division

             Soliciting input and feedback on SWOT analyses
             Asking what additional stakeholders should be solicited for participation
   REP also reviewed CEDS best practices, reviewed input and guidance from data consulting company
   LiveStories, and appraised many examples of CEDS in other communities throughout the United States.
   Numerous reports and local documents were also consulted and can be found listed in Appendix VI.4.
   Based on this information as well as the EDA content guidelines, the CEDS External Review Committee was
   established in January 2021.
   The CEDS External Review Committee includes a representative from each jurisdiction (Whatcom County,
   Bellingham, Blaine, Everson, Ferndale, Lynden, Nooksack, and Sumas) both sovereign tribes (the Lummi
   Nation and the Nooksack Indian Tribe) as well as PUD #1 and WCOG. All four staff members from the
   Port of Bellingham’s economic development team were also on the committee. Members are listed below.

   CEDS External Review Committee
   Matt Aamot, Senior Planner, Whatcom County
   Steve Banham, Public Works Director, City of Lynden
   Roswell Cline Jr., Planning Manager, Nooksack Indian Tribe
   Rollin Harper, Planner, Cities of Nooksack, Everson, and Sumas
   Steve Jilk, General Manager, Whatcom County PUD #1
   Donovan Sather, Director of Economic Development and Planning, Nooksack Indian Tribe
   Tara Sundin, Community and Economic Development Manager, City of Bellingham
   Teresa Taylor, Project Manager, Lummi Indian Business Council
   Alex Wenger, Economic Development and Touri sm Coordinator, City of Blaine
   Robert H. Wilson, Executive Director, Whatcom Council of Governments

   Port of Bellingham Economic Development Division Staff
   Don Goldberg, Director
   John Michener, Economic Development Project Manager
   Jennifer Noveck, Ph.D., Research and Communications Manager
   Gina Stark, Economic Development Project Manager

                                                        Figure 1 illustrates the CEDS cycle and stakeholder
                                                        engagement process. The CEDS cycle begins with the
                                                        Economic Development Administration (EDA), which issues
                                                        guidance. The EDA engages with federal stakeholders and
                                                        identifies strategic investment priorities. Each region has a local
                                                        representative that organizations, such as the Port of
                                                        Bellingham’s economic development team, work with on an
                                                        array of programs and funding opportunities, including CEDS
                                                        planning. During the process, the economic development
                                                        division at the Port worked with a CEDS External Review
                                                        Committee and did stakeholder engagement on multiple inputs
                                                        to the final CEDS report, including the strengths, weaknesses,
                                                        opportunities, and threat (SWOT) analyses, feedback on CEDS
                                                        goals and objectives, as well as the division’s strategies and
                                                        internal work plan items.
                                                        The EDA provides content guidelines for preparing a CEDS
                                                        but also allows the flexibility for a CEDS to emphasize
                                                        strategies or issues important to a region as long as the process
Figure 1: The CEDS Cycle and Stakeholder Engagement Process
                                                                                                                          3
Whatcom County CEDS 2021-2025
Prepared by the Port of Bellingham’s economic development division

and outcomes do not conflict with the guidelines. As Whatcom County nor the Port of Bellingham received
EDA funding to prepare the CEDS, nor is Whatcom County part of an EDA-designated economic
development district (EDD), this CEDS document as well as the 2015 version are “alternative CEDS.”
While a CEDS report must be updated every five years to remain eligible to compete for EDA funding, a
county is not mandated to do so if it does not plan to seek funds in any given year, or if it does not wish to
have an overall economic development strategy. The Port’s economic development division believes having
an overall strategy brings many benefits to economic development in Whatcom County. The team’s purpose
in completing this CEDS update are threefold: to promote a more efficient, stable, programmatic approach to
development, to fulfill EDA requirements so that many actors within the County can access potential funding
sources more successfully, and to create an internal work plan for the team.
Many entities within Whatcom County, including the Port of Bellingham’s economic development division,
have sought or plan to seek EDA funds, particularly as there are opportunities for COVID-19 relief funding,
infrastructure funding, and disaster recovery funding. The Port of Bellingham maintains two EDA funded
Revolving Loan Funds (RLFs) whose lending plans are directly linked to the CEDS. These funds have
provided over $1 million in loans and leveraged an additional $9 million from regional lending institutions.
Many states, including Washington, require counties to have an approved CEDS in order to be eligible for
certain state funding programs that support local economic development. The Whatcom County Economic
Development Investment (EDI) program requires projects be on the CEDS Project List as part of eligibility.
There are also many other federal funders who either require projects be part of a regional strategy for
consideration or who award more points to project applications if they are a part of a regional strategy.
Having one, therefore, provides Whatcom County with a myriad of potential financial benefits and economic
development opportunities. Understanding the benefits, the Lummi Nation has also recently completed and
submitted its own CEDS report to the EDA as of summer 2021.3

3. Geography
Whatcom County is on the land of the Lhaq’temish (Lummi), Nuxwsa’7aq (Nooksack), Coast Salish,
Nłeʔkepmx Tmíxʷ (Nlaka’pamux), Nuwhaha, Sauk Suiattle, Semiahmoo, and Stillaguamish tribes and people
past and present.4
As illustrated in Figure 2 below, Whatcom County borders Lower Mainland British Columbia (BC) to the
north, Skagit County to the south, Okanogan County to the east, and the San Juan Islands to the west. The
Lummi Indian Reservation is primarily to the west of Bellingham and approximately 20 miles south of the
Canadian border and the Nooksack Indian Reservation is located near Deming and approximately 12 miles
south of the Canadian border.

Figure 2: Infographic map of Whatcom County, Washington that shows the seven incorporated cities, the Lummi Nation
Reservation, and the Nooksack Indian Tribe Reservation.

3
  As of August 2021, the Lummi Nation CEDS document is pending EDA approval and will be linked in the appendix
of this document as soon as it is made available.
4 Drawn from https://native-land.ca/. This map tool notes that it does not represent or intend to represent official or

legal boundaries of any Indigenous nations. To learn about definitive boundaries, contact the nations in question.

                                                                                                                          4
Whatcom County CEDS 2021-2025
Prepared by the Port of Bellingham’s economic development division
Three islands in the Strait of Georgia – Lummi, Portage, and Eliza – are part of Whatcom County or the
Lummi Nation Reservation. Lummi Island is part of Whatcom County with a small population and many
businesses. There is regular ferry service between Lummi Island and the mainland. Eliza Island lies to Lummi
Island’s southern tip. Portage Island is fully within the jurisdiction and boundaries of the Lummi Reservation.
Point Roberts, which is on the southern tip of the Tsawwassen peninsula, is a highly unusual geographic
feature of Whatcom County known as a pene-exclave: land area of one country that is accessible only by
traveling through that of another. Point Roberts can be reached from the rest of the county, and vice versa,
by boat or via two border crossings and a 23-mile drive through Canada.
Whatcom County also has seven incorporated cities: Bellingham, Blaine, Everson, Ferndale, Lynden,
Nooksack, and Sumas. There are also several unincorporated communities with substantial populations such
as Birch Bay, Lummi Island, Point Roberts, and several communities in Eastern Whatcom County. The
county has many incredible mountain-river-sea natural features such as 1.2 million acres of public land, some
of the cleanest air in the US, the snowiest mountain in the Lower 48 (Mount Baker), over 130 miles of
coastlines, 188 watersheds, and 100,000 acres of active farmland.
Whatcom County has many regional benefits and amenities to offer. The county boasts access to over eight
million residents within 100 miles, four post-secondary institutions, 90,000 jobs, nearly 6000 registered
business, and five land-based ports of entry. The Port of Bellingham, which is a countywide Port district,
offers an international airport (Bellingham International Airport (BLI)), the Bellingham Shipping Terminal
(BST) for cargo handling and distribution, the Bellingham Cruise Terminal (BCT), which is the southern
connection to the Alaska Marine Highway System, and two full-service marinas (Squalicum and Blaine
Harbors).
4. Infrastructure
Utilities and transportation infrastructure
While both transportation and utility development fall outside of the economic development division’s
authority, infrastructure development and improvement are critical to Whatcom County’s future economic
development.
Washington State’s Growth Management Act (GMA) establishes thirteen goals that are to act as the basis for
comprehensive plans. Whatcom County is one of eighteen counties required to carry out comprehensive
planning activities, which includes utilities and transportation infrastructure elements.5 GMA-mandated
activities are therefore undertaken by Whatcom County and the seven incorporated cities. The Lummi Nation
and Nooksack Indian Tribe carry out similar processes. Utility planning and development occurs under the
city, county, and tribal planning and community development and public works departments, as well as the
Birch Bay Water and Sewer District and Lake Whatcom Water and Sewer District.
In addition, the PUD #1 has countywide authority to supply water and electric services. The PUD’s electric
system peak usage is 29.6MWs and the district owns 15 miles of transmission/distribution lines and three
substations. The PUD also operates two water systems that provide industrial grade (non-potable) water to
Cherry Point, irrigation to at least 50 customers, and potable water and fire protection for a large light-
industrial park at Grandview exit area of I-5. In total, they treat and deliver 5.4 billion gallons of water per
year (PUD #1 Fast Facts 2021).
5 Per RCW 36.70A.020, the GMA topics are summarized by the MSRC (2021) as “concentrated urban growth, sprawl
reduction, regional transportation, affordable housing, economic development, property rights, permit processing,
natural resource industries, open space and recreation, environmental protection, early and continuous public
participation, public facilities and services, historic preservation, and finally shoreline management (RCW 36.70A.480).”
5Whatcom County CEDS 2021-2025
Prepared by the Port of Bellingham’s economic development division
For transportation infrastructure, WCOG is a regional planning conference and is governed by the Whatcom
Transportation Policy Board, which includes voting members from city, county, port, state, and tribal
governments. WCOG is also integrated with the state’s transportation planning process, which falls under the
responsibility of the Washington State Department of Transportation (WSDOT). As a result, Whatcom
Mobility 2040 is the long-range transportation plan for all of Whatcom County. WCOG also manages the
Transportation Improvement Program (TIP), which provides a comprehensive six-year listing of
improvements within the county that are included on the regional transportation network as defined by
Whatcom Mobility 2040.
Whatcom County has limited remaining buildable lands for development and a growing population6. Nearly
half the land in Whatcom County is public land. The county also committed itself in its 2016 Comprehensive
Plan to maintaining 100,000 active acres of farmland. Given these restrictions combined with the fact that
much of the remaining buildable lands are in critical areas (i.e. steep slopes, wetlands), new industrial and
residential developments must be carefully planned and will require significant investments into wetland
mitigation banks7. Whatcom County also has an affordable housing and worker-housing crisis. The county
needs more units of all varieties and at all price points. Property costs and values continue to rise. The cost of
improving and developing infrastructure in Whatcom County is significant. For example, the current total of
the projects on the 2021 CEDS list totals approximately $1.1 billion. This does not include TIP projects nor
does it include many, if not most, city or port capital facility projects. This means that development may
require creative solutions such as innovative public-private partnerships in order to happen.
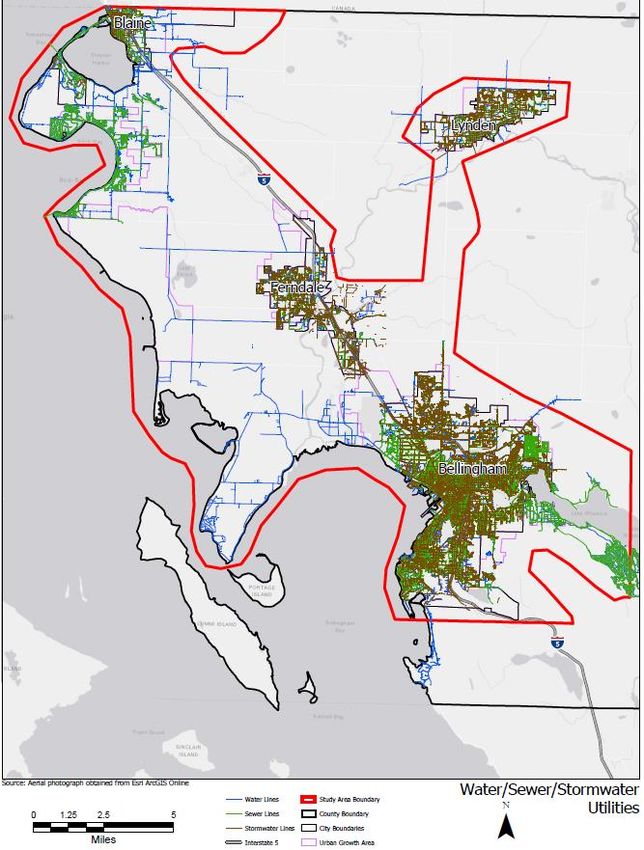
I-5 Infrastructure and Utilities Data Collection Project
In order to facilitate countywide coordination and cost-savings, in 2019 with funding from Whatcom County,
the Port of Bellingham’s economic development staff undertook an infrastructure GIS data collection project
that included many jurisdictions and communities along the I-5 Corridor. While each jurisdiction within
Whatcom County maintains its own utility and infrastructure data, prior to this project there was no single
web map or agency that a user could go to in order to view all available data in Whatcom County. Figure 3
below illustrates the data collected to date for electric, fiber, and transmission lines. Figure 4 shows the data
collected to date for water, sewer, and stormwater lines.
The plan is to expand the current infrastructure GIS database to all of Whatcom County, identify additional
infrastructure data of interest, and to maintain regular updates in order to help partners facilitate efficient
infrastructure development that has regional impacts, with a particular emphasis on reducing the cost of
developing affordable housing and worker housing options.8
6 Relatedly, in 2017 Whatcom County was required by the Washington State legislature to undertake a review and
evaluation program (also called the Buildable Lands program and report). The Review and Evaluation program has two
stated purposes: to “determine whether a county and its cities are achieving urban densities within urban growth areas by
comparing growth and development assumptions contained in the county and city comprehensive plans with actual
growth and development that has occurred; and to identify reasonable measures, if necessary, to reduce the differences
between growth and development assumptions contained in the county and city comprehensive plans with actual
development patterns” (Buildable Lands Guidelines 2018, p. 2).
7 According to the EPA (2021) a “mitigation bank is a wetland, stream, or other aquatic resource area that has been
restored, established, enhanced, or (in certain circumstances) preserved for the purpose of providing compensation for
unavoidable impacts to aquatic resources permitted under Section 404 or a similar state or local wetland regulation. A
mitigation bank may be created when a government agency, corporation, nonprofit organization, or other entity
undertakes these activities under a formal agreement with a regulatory agency.”
8 Gathering an inventory of Whatcom County assets was a suggested deliverable of the Whatcom Futures Report (2014,
p.4).
6Whatcom County CEDS 2021-2025
Prepared by the Port of Bellingham’s economic development division
Figure 3: This map shows where the electric, fiber, and transmission lines are located
around the I-5 Corridor. The plan is to expand this database to all of Whatcom County.
7Whatcom County CEDS 2021-2025
Prepared by the Port of Bellingham’s economic development division
Figure 4: This map shows where the water, sewer, and stormwater lines are located around
the I-5 Corridor. The plan is to expand this database to all of Whatcom County.
Broadband infrastructure
Broadband infrastructure is critical to the growth of Whatcom County’s economy and requires increased
investment. Throughout the United States, there exist significant gaps in access to affordable high-speed
internet services. These inadequacies can be due to a complete lack of physical infrastructure or the
infrastructure could be insufficient for certain household and business needs. There are also major disparities
in terms of access, quality, and cost of services. This is true in Whatcom County, Washington.
Consistent, meaningful, and unbiased data on broadband accessibility and internet speeds is difficult to come
by. Therefore, it is best to evaluate multiple sources. Starting with the Federal Communications Commission
(FCC) Form 477 data, there are five broadband providers in Eastern Whatcom County (Census Tract 101)
with a median speed of 12 Mbps (megabytes per second) download speeds and 1 Mbps upload speeds (e.g.
8Whatcom County CEDS 2021-2025
Prepared by the Port of Bellingham’s economic development division
12/1 Mbps). Speedtests by Ookla data finds that multiple regions in Whatcom County have median speeds
below 25/3 Mbps, including but not limited to the Lummi Nation, Lummi Island, Point Roberts, and Eastern
Whatcom County9. The FCC (2018, 2020) has benchmarked for fixed services is a minimum of 25/3Mbps.
Most consider this speed to be the minimum for an internet connection that allows users to do basic internet
functions, such as utilizing streaming services. They recommend higher speeds if there are multiple devices
using the services.
Other data sources such as the American Community Survey (ACS) and the Department of Commerce State
Broadband Office found serious holes in connectivity, speed, and access in Whatcom County. According to
the ACS (2018) data there are areas of Whatcom where close to zero percent of households have no internet,
primarily around the Bellingham area. The ACS (2018) also found that 534 households in Eastern Whatcom
are completely without internet (+/- 206), which is approximately 17.4% of households. This is higher than
the national figure of 14%. Regardless of data source, it is evident that there are access and quality issues
through multiple parts of Whatcom County.
Public entities, such as the Port of Bellingham, therefore began investing and building broadband
infrastructure in response to the lack of investment by the private sector. Private internet providers have not
been able to build broadband in places like Eastern Whatcom County due to the high expense of last mile
infrastructure10 to households and low rate of return due to the low number of potential customers.
In fall 2018, long-term planning for broadband expansion into unserved and underserved areas began at the
Port of Bellingham after ports in Washington State were given the authority to build out fiber optic
infrastructure in the communities they serve. In November 2018, the Community Economic Realization
Board (CERB) awarded the Port of Bellingham a planning grant. With additional funding from PUD #1, the
Port completed the Whatcom County Rural Broadband Feasibility Study. The study identified broadband
infrastructure routes and accessibility based on needs assessments in unserved and underserved communities.
The Whatcom County Rural Broadband Project is a long-term plan to build an open access dark fiber
broadband network that will provide quality affordable services. Under this plan, multiple internet providers
of any size can lease fiber and provide internet services to the end customer. The Port of Bellingham has
secured funding from the Whatcom County EDI program ($2 million) and CERB ($1,168,781) to construct
the first phase out to Glacier, WA, which is one of the highest need areas. There are approximately 30
businesses located along this initial route in multiple sectors ranging from agriculture to logistics companies to
retail (Rural Broadband Program, Legislative Report 2020). Addressing the broadband needs of Whatcom
County is estimated to cost a minimum of $15-$20 million.
The Port of Bellingham, in partnership with PUD #1, will utilize funding from the county, state, and federal
government in a fiscally responsible manner to continue to identify gaps and build fiber in unserved and
underserved areas that will provide equitable access to affordable high-speed internet. As part of this process,
the Port and the PUD signed an Inter-local Agreement (ILA) stating agreed upon broadband goals and
objectives. The ILA established a Broadband Steering Committee, which includes a representative from both
Commissions, the Port Executive Director, the PUD General Manager, and broadband staff from each
organization. The Steering Committee’s directive and goal is to make decisions on broadband policy, identify
funding opportunities, and make recommendations to each governing body as it pertains to building,
maintaining, and operating the Whatcom County rural broadband network.
9 Ookla is a global company in fixed broadband and mobile network testing applications, data, and analysis. Users can
test their current network speed at: https://www.speedtest.net/
10 Last-mile infrastructure is broadband infrastructure that serves as the final leg connecting the broadband service
provider's network to the end-use customer's on-premises telecommunications equipment.
9Whatcom County CEDS 2021-2025
Prepared by the Port of Bellingham’s economic development division
Healthcare infrastructure
The economic development division of the Port is neither a healthcare provider nor a public health entity.
Public health issues fall under the jurisdiction of Whatcom County Health Department. However, having a
healthy population is key to having a resilient and sustainable economy. It is therefore important to highlight
the current healthcare infrastructure found in Whatcom County. As development and stakeholder
engagement of the CEDS started during the COVID-19 pandemic in summer 2020, inadequate healthcare
infrastructure was and continues to be a top concern throughout Whatcom County.11
Healthcare infrastructure and particularly the limited number of hospital beds and intensive-care unit beds
available was a motivating factor in lockdowns and temporary business closures throughout the United States.
Hospital beds occupied by COVID-19 patients was also one metric used throughout the pandemic to assess
county-level progress with the virus12. During the phased reopening process, related metrics were used to
determine if counties could move into new phases of reopening (higher capacity limits, fewer restrictions on
business and event activity) or not. Whatcom County currently has one hospital with 255 beds, of which 24
are ICU beds, for nearly a quarter million residents.
COVID-19 aside, many communities and stakeholders in the county were concerned about healthcare
services prior to the pandemic. Many of these issues have economic impacts, such as the continuing mental
health crisis and accessibility of health care services. For example, there are populations throughout Whatcom
County that have to travel significant distances to access healthcare services. Residents of Point Roberts have
to make two international border crossings in order to access healthcare services in the United States. Those
in the Eastern part of Whatcom County may need to drive an hour or more for certain healthcare services.
Because of the pandemic the Lummi Nation and the Nooksack Indian Tribe have taken steps towards
expanding and building new healthcare facilities, which is reflected in the updated 2021 CEDS Project List.
5. Economic Conditions & Statistical Description
Demographics
Whatcom County is growing. In 2019, Whatcom County had a population between 220,821 (American
Community Survey 2015-2019) and 229,247 (US Census Bureau 2020).13 Of that, 58% of Whatcom’s
population lives in the seven incorporated cities. Figure 5 below illustrates the population breakdown for the
11
Recognizing that health and the economy are inextricably intertwined, the Port of Bellingham’s economic
development division and the Whatcom County Health Department issued a joint framework for reopening, outlining
each departments responsibilities, during the COVID-19 pandemic. This included co-marketing the countywide Safer.
Stronger. Together. campaign. The ultimate goal of that campaign was and continues to be “to keep our community
healthy while we build consumer confidence and reopen our economy” (Whatcom Together, About 2021).
12 According to the Washington State COVID-19 Risk Assessment Dashboard, the following metrics continue to be
monitored related to the pandemic: rate per 100k of newly diagnosed confirmed and probable cases over two weeks,
average daily COVID-19 testing rate per 100k over a week, percent of molecular tests over a week, percent of adult
staffed acute care beds occupied by patients, staffed acute care beds occupied by adults with suspected and confirmed
COVID-19, percent of adult ICU staffed beds occupied, percent of adult ICU staffed bed occupied by COVID-19
patients.
13 US Census data from the 2020 Census will start to become available in September 2021 through the end of the year.
Many of these data tables will be updated on the CEDS website as soon as the data becomes available. Data changes and
updated will be incorporated into the CEDS report on an annual basis. The next update is in 2022.
10Whatcom County CEDS 2021-2025
Prepared by the Port of Bellingham’s economic development division
seven incorporated cities, the Lummi Nation Reservation, and the Nooksack Reservation and Off-
Reservation Trust Land.
Figure 5: Population by location in Whatcom County, WA.
Figure 6: Sources of population change in Whatcom County, WA.
11Whatcom County CEDS 2021-2025
Prepared by the Port of Bellingham’s economic development division
Some of the population change in Whatcom County is natural and due to births and deaths of current
residents. However, the majority of the growth is from in-migration to the region. As shown in Figure 6
above, in 2018-2019, the total increase in population was 4,950 people. Of that, 4,436 can from in-migration
and the natural increase (births minus deaths) was only 514. Given Whatcom County’s proximity to Lower
Mainland BC and Seattle, both of which have significantly higher populations as well as land and housing
costs, this trend is likely to continue, particularly as remote and hybrid working options increase.
Age demographics
Whatcom County’s population is aging. According to the American Community Survey (2015-2019), an
estimated 22.7% of Whatcom’s population was over 60 years of age and 16.4% were over 65. Figure 7 below
illustrates the population broken down by age groups in Whatcom County and on the Lummi Reservation
and Nooksack Reservation and Off-Reservation Trust Land.
Figure 7: This figure shows the population by age group based on ACS (2015-2019) data for all of Whatcom County, as well as
the Lummi Reservation and the Nooksack Reservation and Off-Reservation Trust Land.
Race and ethnicity demographics
As shown in Figure 8, 83.9% of Whatcom County identifies as white. The next largest group within the
county are people who identify as being two or more races, which comprises 4.4% of the population. 4.1%
identify as Asian, and 3% identify as Native American or Alaska Native. Only 1% of the Whatcom
population identifies as Black.
12Whatcom County CEDS 2021-2025
Prepared by the Port of Bellingham’s economic development division
Figure 8: This figure shows the population by race based on ACS (2015-2019) data for Whatcom County, the Lummi Reservation,
and the Nooksack Reservation and Off-Reservation Trust Land.
Given the large amount of in-migration to Whatcom County that is occurring, we expect these demographics
to shift significantly over time.
Educational attainment
Education data reveals that Whatcom County has a highly educated workforce. According to the ACS (2015-
2019) data in Figure 9 below, 22.1% of the population has a Bachelor’s degree, 11% have an Associate’s
degree, and 11.7% have a graduate or professional degree.
Figure 9: This figure shows educational attainment in Whatcom County, WA.
13Whatcom County CEDS 2021-2025
Prepared by the Port of Bellingham’s economic development division
Washington State’s Path to 70% goal pushes for 70% of the population having some post-secondary
credentials by 2030 (Washington Roundtable 2018). According to the ACS (2015-2019) data, Whatcom
County is close to this goal with 69.2% of its population have at least some college or more. Whatcom
County has four institutions that provide post-secondary education as well as workforce education, including
Western Washington University, Whatcom Community College, Bellingham Technical College, and
Northwest Indian College.
Employment & industry
In Whatcom County there are two primary entities that oversee labor and workforce issues: Washington State
Employment Security Department (ESD) and the Northwest Workforce Council (NWC). NWC has authority
in Whatcom, Skagit, Island, and San Juan counties and ESD has a dedicated Northwest Washington staff
person who covers the same counties.14 ESD works on a range of issue with a focus on unemployment and
jobs. Northwest Workforce advocates for regional workforce needs, leads industry panels and works on
industry specific issues, helps employers to build a skilled workforce, offers training programs, and
coordinates WorkSource, which links job seekers to opportunities.
There are over 6000 registered businesses in Whatcom County (Office of Financial Management, Forecasting
and Research Division 2021). Of these businesses, retail, healthcare and social assistance, manufacturing,
construction, accommodation and food services, as well as other professional services have the largest
number of employees. The same industries also have the largest annual payrolls in the county with
manufacturing making up 20%, construction 18%, healthcare 16%, and retail trade 10%.
According to the Washington State ESD (2021) from 2000 to 2021, nonfarm employment grew in Whatcom
County from 70,000 jobs to 91,000 jobs for an annual average growth rate of 1.7%. While the COVID-19
pandemic caused major disruptions throughout the United States, Whatcom County has rebounded from an
April 2020 low of 82,700 jobs (18.3% unemployment) back to 91,000 jobs (5.4% unemployment) in June
2021. However, as of summer 2021, employers continue to report issues with employee retention and return
to work. Figure 10 below shows the data for jobs by industry, not seasonally adjusted for 2018-2021
Figure 10: This table shows the number of nonfarm jobs by sector and sub-sector, not seasonally adjusted, according to the
ESD's most recent calculations in July 2021.
14 ESD also maintains a lot of labor force data as well as county-specific data that impacts employment, much of which
is used throughout this report. They also provide “labor area summaries” for each county and generate quarterly reports
on the employment situation. See Whatcom’s profile here: https://www.esd.wa.gov/labormarketinfo/county-
profiles/whatcom
14Whatcom County CEDS 2021-2025
Prepared by the Port of Bellingham’s economic development division
The service-providing sectors of the economy, which were some of the hardest hit by pandemic related
closures, account for 73,100 of 91,000 (80%) non-agricultural jobs in June 2021 (ESD Labor Area Summaries
2021). Manufacturing provided 9,500 jobs in June 2021 compared to 10,900 jobs in June 2019.
According to Western Washington’s Center for Economic and Business Research (2021, p.2), Whatcom
County’s top ten employers in 2020 were (in rank order with the first having the largest employee headcount):
St Joseph’s Hospital, the Lummi Nation, Western Washington University, Bellingham Public Schools, BP
Cherry Point, the City of Bellingham, Matrix Service Inc, Ferndale School District, Whatcom County, and
Haggen.15
Prior to the COVID-19 pandemic Whatcom County’s average annual wage was $49,662 in 2019, which is
below the statewide annual average wage of $69,195. In 2018, the county’s median hourly wage was $22.12,
which was also lower than the state median of $25.98 per hour (Washington Employment Security
Department 2021). Wages also differ significantly by occupation. For example, though food preparation and
serving related jobs are the second most likely occupation (9,560 workers) in Whatcom County, the wages
workers receive in this occupation only averages $15.73 per hour. However, the 1,430 workers in computer
and math occupations receive an average hourly wage of $39.81 (Occupational Employment Statistics 2018).
It is also important to point out that when adjusted for inflation, the lowest paid 10% of jobs have had nearly
stagnant wages and only grew from $7.96/hour to $11.71/hour in a nearly 30 year period (1990-2018)
(Employment Security Department, Whatcom County Data Tables 2021).
Another important labor and employment issue in Whatcom County, which relates to its aging population
(discussed above), is retirement. According to the ACS (2015-2019) data, the three industries that make up a
significant portion of Whatcom County’s possible retirees (workers are 55+) are healthcare, education
services, and retail. As noted in the COVID Impact Assessment (2021), many healthcare industries are
currently experiencing labor shortages, which is contributing to delayed access to care for many people. Retail
and hospitality trades throughout Washington have similarly reported difficulty in finding workers to service
providers, local government, and media since spring 2021 (Roberts and Vinh 2021).
United States-Canada Border
The US-Canada border is a vital asset to Whatcom County and Washington State’s economy.
According to the International Mobility and Trade Corridor program’s 2019 data, $53 million (USD) in trade
crosses the Cascade Gateway every day, with over $16 billion in truck trade and $3 billion in rail trade
crossing the border in 2019. In terms of volume, Blaine, WA ranked the 4th largest port-of-entry in the United
States for trucks. Sumas ranked 8th, Lynden ranked 14th, and Point Roberts ranked 18th. The primarily
commodities crossing the Cascade Gateway are motor vehicles, wood and wood products, and computer-
related machinery and parts.
March 21, 2021 marked a full year since the US-Canada border closed due to the COVID-19 pandemic.
While the border stayed open to commercial cargo and activity, passenger travel was strictly limited. Given
Whatcom County’s status as a border county, it receives many economic benefits to visits from Canadians,
such as retail sales, sales tax revenue, as well as tourism dollars. The Border Policy Research Institute (BPRI)
at WWU evaluated the impacts on retail shopping, sales tax revenue, and tourism. Some of the key impacts
identified were:
15 Some numbers in this report were based on 2019 and others were estimates provided by 3rd party sources that are
likely to have been measured before the COVID-19 pandemic. Therefore, the ranking should be interpreted with
caution and is likely to shift with updated data.
15Whatcom County CEDS 2021-2025
Prepared by the Port of Bellingham’s economic development division
Whatcom County lost over 506,000 Canadian tourists, or approximately 13% of all Canadian
passenger travel, just from travel that might have occurred from March to September 2020 (BPRI
2020, Report 3).
Whatcom County is estimated to have lost $54-65 million in retail sales just in the first and second
quarters of 2020 due to COVID-19 border restrictions. Because many Canadians previously crossed
to purchase gas and dairy products, two commodities not measured in taxable retail sales data, the
true decrease in retail sales is likely much higher (BPRI 2020, Report 2).
Canadian shoppers are important to Whatcom’s retail sector and accounted for at least $140 million
in spending in 2018, with an average of 11.7% of taxable retail sales (BPRI 2020, Report 1).
Border communities such as Blaine, Point Roberts, and Sumas were disproportionately negatively
impacted by the border closure in terms of retail sales, tourism, and fuel tax revenue.
Due to the ongoing uncertainties with the COVID-19 pandemic, we do not know when the US Canada
Border will fully reopen to American and Canadian passenger travel. We thus suspect that negative impacts
will continue to accumulate and adversely affect the region.
Export industries
According to the US Department of Commerce, using data from the US Census Bureau, the Bellingham
metropolitan area was the 99th largest metropolitan exporter in 2019 with total goods exported totaling over
$2 billion. The top three export sectors were petroleum and coal products (nearly $1.1 billion) followed by
processed foods ($86.2 million), fish and other marine products ($69.2 million). The largest markets that
received exported goods were the Asia-Pacific Economic Cooperation (APEC), which is an
intergovernmental forum of 21 member countries in the Pacific Rim. APEC received over $1.9 billion in
exports. The next largest markets for exports are to countries with Free Trade Agreements (FTAs) with the
United States ($1.8 billion) and North American Free Trade Agreement (NAFTA) partners ($1.2 billion)16.
This includes Canada.
During the COVID-19 pandemic, many industries throughout Washington and the United States reported
delays, slowdowns, and loses due to Asian market closures. This is important to note because Whatcom
County’s fishing industry reported that they were very negatively impacted by the closures. This dependency
on Asian markets resulted in a push to develop local seafood markets in Whatcom County, with the Port of
Bellingham building a Fisherman’s Pavilion, which will be used to support the industry in myriad ways. The
Working Waterfront Coalition, Port of Bellingham, and other local partners also worked to develop the
Bellingham Dockside Market, which provides a venue for the fishing industry to sell their fresh products
locally.
As Whatcom County has experienced growing interest from Canadian companies even through the COVID-
19 pandemic, the ability of the Port of Bellingham to establish Foreign Trade Zones could be of huge benefit
to companies in the exporting business.
Agriculture
According to the Census of Agriculture (2017, p. 239), Whatcom County currently has 1712 farms totaling
102,523 acres of farmland. Of the 1712 farms, 1363 farms are under 50 acres in size. The average size of is 60
acres, whereas the median size of a Whatcom farm is 12 acres.
16Countries are often members of multiple agreements and trade forums; therefore, the sum exceeds total exports.
Partners are defined based upon membership status in the year of the data.
16Whatcom County CEDS 2021-2025
Prepared by the Port of Bellingham’s economic development division
Table 1: A count of farms by value of sales. Source: 2017 Census of Agriculture, Table 1, County Summary Highlights, p. 239.
Farms by value of sales Number of Farms
Less than $2,500 891
$2,500 to $4,999 166
$5,000 to $9,999 146
$10,000 to $24,999 151
$25,000 to $49,999 61
$50,000 to $99,999 40
$100,000+ 257
In terms of sales, 257 of Whatcom’s farms have sales that exceed $100,000 annually and 40 have sales
between $50,000 and $99,999 annually. 891 farms reported sales under $2,500. The net cash farm income of
the operations, on average per farm, is $33,342. In addition to sales, the estimated market value of the land
and buildings per farm is $1,005,681 for an average of $16,794 per acre. The estimated market value of
machinery and equipment per farm is $95,376 (Census of Agriculture 2017, p. 239).17 According to Whatcom
Family Farmers (2021) Whatcom County agricultural production has close to a $357,312,000 market value.
Marine Trades
The marine trades continues to be a critically important sector to Whatcom County and Washington State.
Marine trades includes shipwrights, boat services and outfitters, boat sales and brokers, tour and charter
companies, boating clubs, commercial fisherman, fisher buyers, fisher processors, aquaculture services, as well
as transportation services such as tug and barge, ferries, cargo shipping and receiving, cold storage, and
warehousing. Over 6000 jobs in Whatcom County are created or supported by the marine trades sector,
which represents approximately 7% of the total workforce (WWU CEBR 2016).
Industrial Lands and Buildings
According to the Whatcom County I-5 Corridor Study (2019, p.19), which was completed under the Port’s
economic development division and funded by the Whatcom County EDI program, the total number of all
residential parcels and industrial parcels with a utilization ratio of under 50 percent with more than three acres
is 9,941 with a total area of 20,517 acres. Of those parcels and acres, only 37 parcels of industrially zoned land
totaling 256.4 acres were ranked “highly developable,” whereas 335 parcels and 7,267 acres of industrial land
fell into the low ranking category. High rank indicates that a parcel has utilities, road access, proximity to I-5,
and few to no critical areas or wetlands. Low rank typically indicates the absence of these characteristics.18
Whatcom County also has extremely low vacancy rates for industrial buildings. According to the 2021 1st
quarter Bellingham CRE Research Report, Bellingham’s average industrial vacancy rate is only 0.96%, with
many industrial parks and buildings having zero square feet of vacant space available. Likewise, the Port of
17 The next US Agriculture Census will take place in 2022 and typically there is a one to two year delay on the data
release, as with the regular Census and other national-level data collection efforts that are granular.
18 The ranking is subjective and does not incorporate specific business needs, the cost of the property, or the land
preparation that may be required. It is important to emphasize that the ranking is not an endorsement or condemnation
of the property by FLO Analytics, the Port of Bellingham, or any other jurisdiction or entity. It is simply a tool to
identify the most shovel ready properties within the study area and assess what factors may make any particular parcel
easier or more difficult to develop. For a full discussion of how the rankings were created, see the Whatcom County I-5
Infrastructure Study linked in Appendix VI.4.
17Whatcom County CEDS 2021-2025
Prepared by the Port of Bellingham’s economic development division
Bellingham is the largest public industrial landowner in Whatcom County and the majority of that property is
currently leased and in use.
While there are several industrial and light industrial parks in Whatcom County, the largest area of heavy
industrial land can be found in the Cherry Point UGA. Cherry Point encompasses approximately 7,000 acres
of heavy industrial land. Cherry Point is also a culturally important area to the Coast Salish people, including
the Lummi Nation who call the area Xwe’chi’eXen. According to the 1855 Treaty of Point Elliot, Cherry Point
is considered part of the “usual and accustomed” hunting and fishing area for the five treaty tribes (Whatcom
County Comprehensive Plan 2016, Chapter 2).
Cherry Point currently contains multiple industrial facilities including two oil refineries (BP and Phillips 66)
and two additional companies (Chemco and Praxair). These industrial facilities occupy approximately 5,500
acres of land, which leaves a fourth track of land that is approximately 1,500 acres that is comprised of two
distinct ownerships.
Cherry Point has several existing important infrastructure features. Deep-water access off Cherry Point
provides three marine transshipment terminals. BNSF Railways also serves the area. Existing industries use
rail to ship and receive multiple feedstock and other products. Both of the refineries receive crude oil
shipments via rail. There is extensive power, abundant liquid petroleum gas, and grey water available. It is
located adjacent to the power grid and has close proximity to I-5.
Housing
The United States is experiencing a housing crisis that is deepening daily. In Whatcom County, there are
issues of affordability, accessibility, and availability of housing, as well as increasing housing insecurity (ability
to retain safe and secure housing) and houselessness.19 These problems have a direct, negative impact on
Whatcom’s local economy, employers, and residents.
Demand for single-family homes in Whatcom County continued to grow exponentially through the COVID-
19 pandemic. According to Redfin (2021) in June 2021, Whatcom County home prices were up 25%
compared to June 2020, selling for a median price of $525,000. On average, homes in Whatcom County sell
after six days on the market compared to 21 days last year. There were 421 homes sold in June this year, up
from 326 last year (a 29% increase). Houses are even more expensive and increasingly difficult to find.
19These issues have been documented at length by the Housing Advisory Committee of Whatcom County, the
Homeless Strategies Workgroup, the Whatcom County Coalition to End Homelessness, the Whatcom County Business
and Commerce Advisory Committee, the Bellingham and Whatcom County Housing Authorities, and the Whatcom
County Health Department, Whatcom County Planning and Development Services, City of Bellingham Planning and
Community Development, as well as the Small Cities, the Lummi Nation, and Nooksack Indian Tribe Planning services,
to name but a few. Numerous nonprofits, such as the Whatcom Housing Alliance, the Opportunity Council, the
Kulshan Land Trust, the Whatcom Community Foundation, Habitat for Humanity in Whatcom County, and the
Lighthouse Mission also work directly on housing related issues. Many other economic development service providers
and business groups such as the Bellingham Regional Chamber of Commerce, the Downtown Bellingham Partnership,
and Sustainable Connections have also advocated and worked on issues that influence small businesses such as
affordable housing, worker housing, and homelessness for at least a decade. This section should therefore not be
interpreted as a full analysis of every housing related issue in Whatcom County, nor a complete summary of current
activities and enormous amount of work currently being done, but rather a short statistical summary of a few key points
to describe the general nature of the situation.
18You can also read