Wyoming's Forest Products Industry and Timber Harvest, 2018

Page created by Clara Reeves
 
CONTINUE READING
Wyoming's Forest Products Industry and Timber Harvest, 2018
Rocky Mountain Research Station   RMRS-RB-33   April 2021

Wyoming’s Forest Products Industry and
Timber Harvest, 2018
Wyoming's Forest Products Industry and Timber Harvest, 2018
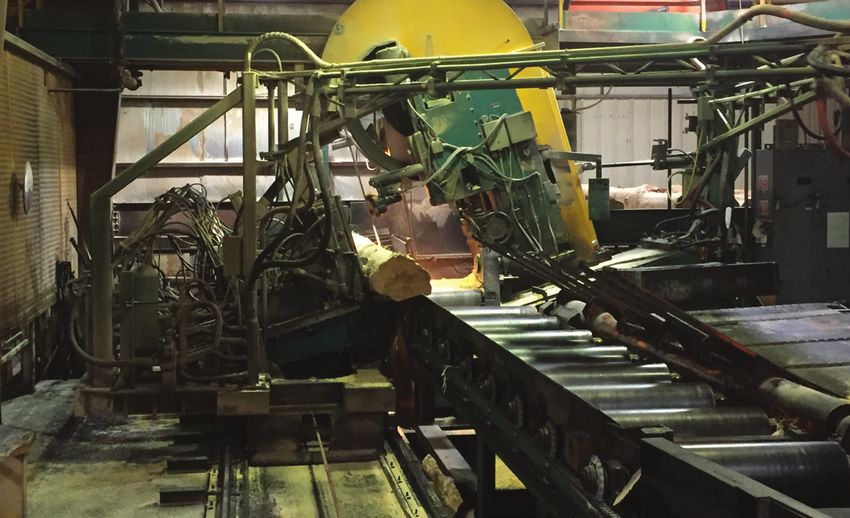
Marcille, Kate C.; Dillon, Thale; Townsend, Lucas P.; Morgan, Todd A.; Shaw, John D. 2021. Wyoming’s forest
products industry and timber harvest, 2018. Resour. Bull. RMRS-RB-33. Fort Collins, CO: U.S. Department of
Agriculture, Forest Service, Rocky Mountain Research Station. 28 p. https://doi.org/10.2737/RMRS-RB-33

Abstract
This report traces the flow of Wyoming’s 2018 timber harvest through the primary wood products industry
and characterizes the structure, capacity, and condition of Wyoming’s forest products sector. Trends in timber
harvest, production, sawmill capacity, mill residuals, and sales value are presented. Employment and worker
earnings in the State’s primary and secondary forest products industries are also discussed. Periodic survey
data collected from the forest products industry provides detailed information on Wyoming’s timber resources,
wood utilization, and the economic contributions of the industry to the State economy.

__________________________
Keywords: forest economics, lumber production, mill residue, mill capacity, wood products, timber harvest,
timber-processing facility, wood utilization.

Cover:
Upper left—Ponderosa pine log entering headsaw. Upper right—Decked pine logs in Wyoming mill yard. Center left—Post and
pole processing sort yard. Center right— Finished wooden dowels stacked for shipping. Bottom—Raw logs and rough cut cants
stacked outside mill. Courtesy photos by the Bureau of Business and Economic Research (BBER).

All Rocky Mountain Research Station publications are published by U.S. Forest Service employees and are in the public
domain and available at no cost. Even though U.S. Forest Service publications are not copyrighted, they are formatted
according to U.S. Department of Agriculture standards and research findings and formatting cannot be altered in reprints.
Altering content or formatting, including the cover and title page, is strictly prohibited.
Wyoming's Forest Products Industry and Timber Harvest, 2018
Authors
Kate C. Marcille is a forest economist, Forest Industry Research, Bureau of Business and Economic Research,
University of Montana, Missoula, Montana.

Thale Dillon is a research economist, Forest Industry Research, Bureau of Business and Economic Research,
University of Montana, Missoula, Montana.

Lucas P. Townsend is a research associate, Forest Industry Research, Bureau of Business and Economic
Research, University of Montana, Missoula, Montana.

Todd A. Morgan is the director of Forest Industry Research, Bureau of Business and Economic Research,
University of Montana, Missoula, Montana.

John D. Shaw is a research forester, U.S. Department of Agriculture, Forest Service, Rocky Mountain Research
Station, Forestry Sciences Laboratory, Ogden, Utah.

Acknowledgments
We would like to acknowledge all of the participating wood products facility owners, managers, and staff that took
the time to provide detailed information about their operations. In addition, we are grateful for the comments and
input provided by: Josh Van Vlack and Melissa Mokry, Wyoming State Forestry Division; Josh Sidon, USDA Forest
Service Region 2; Ben Wudtke, Intermountain Forest Resource Association; various district foresters with the
Wyoming State Forestry Division; the USDA Forest Service Forest Inventory and Analysis program; and all of the
reviewers of the manuscript and summary data tables.

                                                               I
Wyoming's Forest Products Industry and Timber Harvest, 2018
HIGHLIGHTS
•   A total of 30 primary wood-processing facilities operated in 15 Wyoming counties during 2018.
    These facilities included 12 sawmills, 12 post and pole producers, 2 log home manufacturers, 1
    log furniture manufacturer, and 3 other wood products facilities.

•   The sales value of wood products from Wyoming producers fell from more than $66 million
    in 2014 to $63 million in 2018 (2018 dollars), a drop of close to 5 percent. Lumber and sawn
    products accounted for $57 million, pulp and paper products brought in $3.8 million, sales of
    house logs and log homes accounted for $152,000, and sales of other wood products were nearly
    $2.3 million in 2018.

•   Wyoming’s 2018 timber harvest volume was 81.6 million board feet (MMBF) Scribner, with 67
    percent of the timber coming from National Forests, 27 percent from private lands, 3 percent from
    State-owned lands, and just under 3 percent from BLM lands.

•   Crook, Carbon, and Albany were the leading timber harvest counties in Wyoming during 2018,
    accounting for 49, 14, and 11 percent of the total harvest, respectively.

•   Estimated annual capacity to process timber in Wyoming during 2018 was 116 MMBF, Scribner.
    Wood-processing facilities in the State used about 70 percent of their processing capacity in 2018,
    processing 80.7 MMBF of timber.

•   Ponderosa pine was Wyoming’s most harvested species in 2018, accounting for nearly 41 MMBF
    (50 percent) of the total harvest. This was followed by lodgepole pine with 28 percent (23
    MMBF) and Englemann/Black Hills spruce with 11 percent (9 MMBF).

•   Thirty-five percent of the more than 78 MMBF Scribner received by Wyoming mills during 2018
    came from outside the State, while 37 percent of the nearly 82 MMBF of timber harvested in
    Wyoming was shipped outside the State.

•   The forest products industry in Wyoming produced 142,710 bone dry units (BDU) of residue in
    2018, 97 percent of which was utilized for pulp, board, and other products, and for energy.

•   In 2018, the Wyoming forest industry directly supported 952 full- and part-time jobs, with
    combined labor income of $41.4 million.

                                                         II
Wyoming's Forest Products Industry and Timber Harvest, 2018
CONTENTS

INTRODUCTION . . . . . . . . . . . . . . . . . . . . . . . . . . . . . . . . . . . . . . . . . . . . . . . . . . . . . . . . . . . . . . . . . . . . . . . . . . .  1

     Forest Industries Data Collection System . . . . . . . . . . . . . . . . . . . . . . . . . . . . . . . . . . . . . . . . . . . . . . . . . . . . .  1

WYOMING’S TIMBER RESOURCE . . . . . . . . . . . . . . . . . . . . . . . . . . . . . . . . . . . . . . . . . . . . . . . . . . . . . . . . . . . .  2

WYOMING’S TIMBER HARVEST  . . . . . . . . . . . . . . . . . . . . . . . . . . . . . . . . . . . . . . . . . . . . . . . . . . . . . . . . . . . . .  2

     Harvest by Geographic Source . . . . . . . . . . . . . . . . . . . . . . . . . . . . . . . . . . . . . . . . . . . . . . . . . . . . . . . . . . . . .  4

     Harvest by Product Type . . . . . . . . . . . . . . . . . . . . . . . . . . . . . . . . . . . . . . . . . . . . . . . . . . . . . . . . . . . . . . . . . .  5

     Harvest by Species . . . . . . . . . . . . . . . . . . . . . . . . . . . . . . . . . . . . . . . . . . . . . . . . . . . . . . . . . . . . . . . . . . . . . .  6

     End Uses  . . . . . . . . . . . . . . . . . . . . . . . . . . . . . . . . . . . . . . . . . . . . . . . . . . . . . . . . . . . . . . . . . . . . . . . . . . . . .  9

     Timber Flow  . . . . . . . . . . . . . . . . . . . . . . . . . . . . . . . . . . . . . . . . . . . . . . . . . . . . . . . . . . . . . . . . . . . . . . . . . .  10

FOREST PRODUCTS INDUSTRY . . . . . . . . . . . . . . . . . . . . . . . . . . . . . . . . . . . . . . . . . . . . . . . . . . . . . . . . . . . .  11

     Timber Received by Wyoming Mills  . . . . . . . . . . . . . . . . . . . . . . . . . . . . . . . . . . . . . . . . . . . . . . . . . . . . . . . .  13

     Trends and Capacity by Sector . . . . . . . . . . . . . . . . . . . . . . . . . . . . . . . . . . . . . . . . . . . . . . . . . . . . . . . . . . . .  14

     Input and Other Capacity  . . . . . . . . . . . . . . . . . . . . . . . . . . . . . . . . . . . . . . . . . . . . . . . . . . . . . . . . . . . . . . . .  16

PRIMARY PRODUCT SALES VALUE AND MARKETS  . . . . . . . . . . . . . . . . . . . . . . . . . . . . . . . . . . . . . . . . . . .  22

FOREST INDUSTRY EMPLOYMENT AND LABOR INCOME  . . . . . . . . . . . . . . . . . . . . . . . . . . . . . . . . . . . . . .  24

CONTRIBUTION OF WYOMING’S FOREST INDUSTRY TO THE STATE’S ECONOMY  . . . . . . . . . . . . . . . . .  26

REFERENCES  . . . . . . . . . . . . . . . . . . . . . . . . . . . . . . . . . . . . . . . . . . . . . . . . . . . . . . . . . . . . . . . . . . . . . . . . . . .  27

                                                                                    III
Wyoming's Forest Products Industry and Timber Harvest, 2018
IV
Wyoming's Forest Products Industry and Timber Harvest, 2018
INTRODUCTION
                  This report contains the findings from a periodic census of Wyoming’s primary forest
             products industry for calendar year 2018. It presents a discussion of trends since the
             previous census in 2014 and describes developments since 2018. The report’s principal
             goals are to determine the utilization of Wyoming’s timber harvest, identify the type and
             number of primary forest products firms operating during 2018 and their sources of raw
             material, and quantify outputs of finished products. Data on subsequent years are provided
             where available.
                  The University of Montana’s Bureau of Business and Economic Research (BBER)
             and the USDA, Forest Service, Rocky Mountain Research Station (Ogden, Utah)
             cooperated in the analysis and preparation of this report. BBER, in cooperation with
             the Forest Inventory and Analysis (FIA) programs at the Rocky Mountain and Pacific
             Northwest Research Stations, has developed a system to collect, compile, and make
             available State and county information on the operations of the forest products industry—
             the Forest Industries Data Collection System (FIDACS). This is the sixth application of
             this system in Wyoming.

Forest Industries Data Collection System
                  FIDACS is based on a census of primary forest product manufacturers located
             in a particular State and facilities in surrounding States that receive timber harvested
             from that State. Primary forest product manufacturers are firms that process timber into
             manufactured products such as lumber, and facilities like wood pellet plants, that use the
             wood fiber residue directly from timber processors. Wyoming’s primary forest products
             manufacturers were identified through telephone directories and with the assistance of
             the manufacturers themselves. Through a written questionnaire or telephone interview,
             manufacturers provided the following detailed information for each facility operating
             during calendar year 2018:
                  • Plant location, production capacity, and employment.
                  • Volume of raw material received, by county and ownership.
                  • Species of timber received and live/dead proportions.
                  • Preferred and accepted log lengths and diameters.
                  • Finished product volumes, types, sales value, and market locations.
                  • Utilization and marketing of manufacturing residue.
                  Facilities participating in the 2018 Wyoming census processed virtually all of the
             State’s commercial timber harvest. Volumes and characteristics of Wyoming timber
             processed by out-of-state firms were determined by surveying facilities in nearby
             States including Montana, Idaho, South Dakota, and Utah. A variety of publications
             and information provided by Federal, State, and industry managers were used to verify
             estimates of Wyoming’s total timber harvest and wood products production and sales.
                  Information collected through FIDACS is stored at the University of Montana’s
             BBER. Because of the substantial detail on the industry and its timber use, there is a time
             lag between the date of the census and the publication of this report. To make the data
             available in a more timely fashion, results and a summary are posted online as they are
             compiled and reviewed (https://www.bber.umt.edu/FIR/S_WY.asp). Key data from other

USDA Forest Service RMRS-RB-33. 2021.                                                                      1
Wyoming's Forest Products Industry and Timber Harvest, 2018
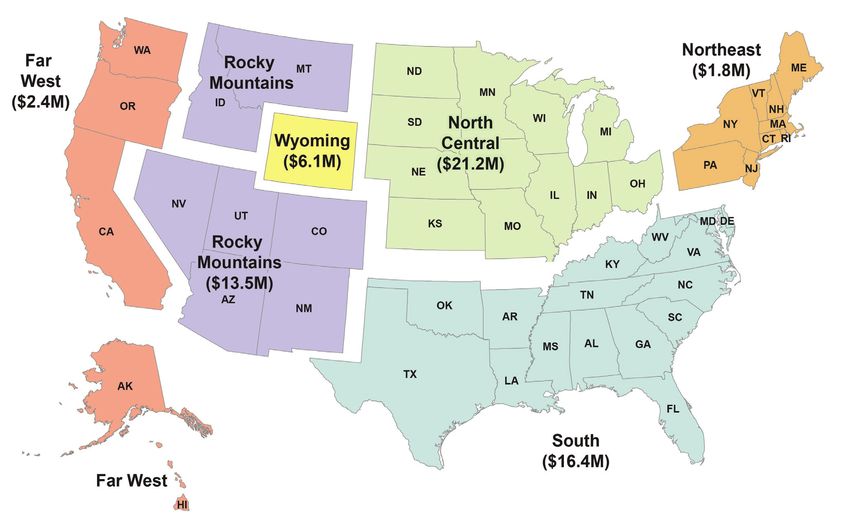
sources are included to provide the most recent measurers of general industry activity, and
                     references to other publications dealing with industry conditions are included. Additional
                     information is available by request. However, individual firm-level data are confidential
                     and will not be released.

WYOMING’S TIMBER RESOURCE
                         Wyoming contains approximately 5.5 million acres of “nonreserved timberland”—
                     lands not permanently reserved through statute or administrative designation such as
                     Wilderness Areas, National Parks, and National Monuments. The majority (71 percent) of
                     nonreserved timberland in Wyoming is National Forest System (NFS) land managed by
                     the USDA Forest Service (USDA FIA 2020) (table 1). Likewise, the majority (83 percent)
                     of sawtimber tree volume is found of NFS lands (fig. 1).
                         By comparison, NFS lands provided 67 percent of the 2018 harvest, while private
                     and tribal landowners provided 27 percent and other public sources provided the
                     remaining 6 percent.
                         Available sawtimber volume on Wyoming’s nonreserved timberland is approximately
                     28.7 billion board feet Scribner (fig. 1). The greatest portion of this volume (83 percent, or
                     23.8 billion board feet) is on NFS land, while 10 percent (2.8 billion board feet) is located
                     on private land and the remaining 7 percent (2.1 billion board feet) is on other public lands.
                     Net annual growth of sawtimber on nonreserved timberland is approximately -421 million
                     board feet (MMBF) per year; mortality, primarily from insect outbreaks, greatly exceeds
                     growth.

WYOMING’S TIMBER HARVEST
                         Timber harvested from lands in Wyoming in 2018 totaled 81.6 MMBF, or close
                     to 19 million cubic feet (MMCF). This constitutes a 21 percent increase over the 2014
                     harvest of 67.5 MMBF and a near doubling over the 2010 harvest of 41.7 MMBF (fig. 2).
                     The strong rebound in Wyoming’s harvest can be explained in part by economic forces
                     affecting wood products markets over the past two decades. The Great Recession and
                     associated drop in U.S. home construction during the period between 2007 and 2009
                     greatly reduced the demand for lumber through 2010 and 2011 (Keegan et al. 2012).

Table 1—Wyoming timberland by ownership class.
    Ownership class                                                 Thousand acres                       Percent of timberland
    National Forest                                                          3,893                                        71.0
    Non-industrial private                                                    977                                         17.8
    Industrial                                                                  —                                           —
    Bureau of Land Management                                                 367                                           6.7
    State                                                                     241                                           4.4
    Other public                                                                2                                           0.0
    All owners   a
                                                                             5,480                                         100
Source: USDA FIA 2020.
a
    Percentage detail may not sum to 100 percent due to rounding.

2                                                                                          USDA Forest Service RMRS-RB-33. 2021.
Private and Tribal
                                        Private and Tribal                        10%
                                              18%                                                          Private and Tribal
                                                                            Other Public 7%
                                                                                                                 27%

                                        Other Public 11%

                                                                                                           Other Public 6%

                                                                        National Forest 83%

                                       National Forest 71%
                                                                                                         National Forest 67%

                                           Timberland                          Sawtimber                      Harv ested
                                              area                            tree volume                      v olume

                                  Figure 1—Characteristics of Wyoming’s timberland by ownership class, 2018.

                            90
                                       National Forest       Nonindustrial Private               State   Bureau of Land Management

                            80                                                                                                   2.6%
                                                                                                                                 3.2%

                                               0.8%
                            70                                                                                  1.6%
                                        6.8%                         1.4%
                                                                                                                                27.4%
                                                             4.0%                                            12.1%
  Volume (MMBF) Harvested

                            60

                            50
                                                                                                             34.1%

                            40         72.7%                 66.2%                       7.0%
                                                                                         8.9%

                            30                                                          25.0%
                                                                                                                                66.8%

                            20
                                                                                                             52.2%

                                                                                        59.1%
                            10                               28.4%
                                       19.7%

                             0
                                        2000                 2005                        2010                2014               2018

                                                                                        Year

                                 Figure 2—Wyoming timber harvest by ownership, selected years (sources: Brandt et al. 2009; McIver et al.
                                 2018; Morgan et al. 2005).

USDA Forest Service RMRS-RB-33. 2021.                                                                                                       3
Since 2011, increases in home construction, as well as overseas demand, has led to
                    improved markets for wood products. Aside from market influences, landowner decisions
                    to increase or decrease harvest levels in response to disturbance (e.g., fire, insects, and
                    disease), or in an effort to proactively manage their forests for other resource values (e.g.,
                    restoration, wildlife, or fire hazard reduction), can affect the amount of timber being
                    offered, sold, and cut each year. In Wyoming, the different ownership classes saw great
                    variation in harvest changes between 2014 and 2018: National Forest lands increased by
                    55 percent, whereas other public lands went down by 49 percent and private lands went
                    down by 3 percent (table 2).

Table 2a—Wyoming timber harvest, thousand board feet Scribner, by ownership class, selected years.

    Ownership class                                           2000                     2005                    2010                2014                2018
                                                      ------------------------------------- Thousand board feet, Scribner -------------------------------
    National Forest                                         13,861                  18,189                  24,621               35,260              54,525
    Non-industrial Private                                  51,252                  42,380                  10,415               23,016              22,328
    State                                                    4,785                    2,565                   3,720               8,180                2,611
    Bureau of Land Management                                   596                     903                   2,939               1,091               2,157
    All owners                                              70,494                  64,037                  41,695               67,547              81,621

Table 2b—Wyoming timber harvest by ownership class, selected years.

    Ownership class                                           2000                     2005                    2010                2014                2018
                                                       ------------------------------------------- Percent of harvest ----------------------------------------
    National Forest                                            19.7                     28.4                    59.1                52.2                66.8
    Non-industrial Private                                     72.7                     66.2                    25.0                34.1                27.4
    State                                                           6.8                  4.0                     8.9                12.1                  3.2
    Bureau of Land Management                                       0.8                  1.4                     7.0                  1.6                 2.6
    All ownersa                                                 100                     100                     100                  100                 100
Sources: Brandt et al. 2009; McIver et al. 2018; Morgan et al. 2005.
a
    Percentage detail may not sum to 100 percent due to rounding.

Harvest by Geographic Source
                        The geographic source of Wyoming’s timber harvest has been from the mountainous
                    regions of the State, where sufficient moisture allows timber to achieve a merchantable size
                    (Green and Conner 1989). Wyoming’s timber harvest was divided among five resource
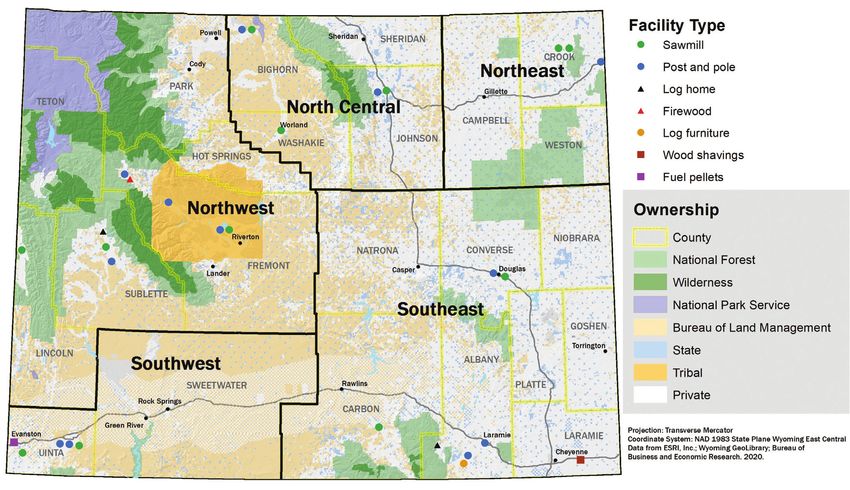
                    areas for 2018: Northeast, North Central, Northwest, Southeast, and Southwest (fig. 3).
                        The Northeast resource area includes Campbell, Crook, and Weston counties and
                    accounted for 51 percent (41.6 MMBF) of Wyoming’s 2018 timber harvest (table 3),
                    the majority (40 MMBF or 49 percent of total State harvest) from Crook County. The
                    Southeast resource area accounted for 25 percent (20.2 MMBF) and includes Albany,
                    Carbon, Converse, Goshen, Laramie, Natrona, Niobrara, and Platte counties. Only Albany

4                                                                                                               USDA Forest Service RMRS-RB-33. 2021.
Figure 3—Wyoming’s geographic resource areas.

             and Carbon counties yielded a timber harvest. The Northwest resource area provided 12
             percent (9.4 MMBF) and includes Fremont, Hot Springs, Lincoln, Park, Sublette, and
             Teton counties. The North Central resource area includes Big Horn, Johnson, Sheridan,
             and Washakie counties and was the origin of 7 percent (5.9 MMBF) of Wyoming’s timber
             harvest, while 5 percent (4.4 MMBF) of the harvest originated in the Southwest resource
             area, which includes the counties of Sweetwater and Uinta. Timber from the Northeast,
             North Central, and Southeast resource areas was harvested primarily on National Forest
             lands, whereas timber from the Northwest and Southwest was harvested mostly on private
             lands. Two-thirds of Wyoming counties had at least some timber harvest in 2018.

Harvest by Product Type
                 Wyoming’s timber harvest falls into three general product categories: sawlogs, posts
             and small poles, and other products. Sawlogs are timber sawn to produce lumber, mine
             timbers, and other sawn products. Posts and small poles are timber used to manufacture
             fence posts, small poles, and rails used in fence construction. Other products include
             timber used to manufacture house logs, log furniture, and firewood.
                 The product shares of the Wyoming harvest have been changing over the years,
             although the changes have been less significant in the last decade. During 2018, sawlogs
             were the primary timber product harvested in Wyoming, accounting for 95 percent (77.4
             MMBF) of the total harvest (table 4). Post and small poles accounted for less than 3
             percent (2.1 MMBF) of the total 2018 harvest, as did house logs and other products.

USDA Forest Service RMRS-RB-33. 2021.                                                                   5
Table 3—Wyoming timber harvest, thousand board feet Scribner, by county and ownership, 2018.

    Resource area                        National Forest            Private   State     BLM           Total   Percent of total
    Northeast Wyoming                                27,543         12,512    1,414      100         41,569              50.9
      Campbell                                             —            —        —         —             —                 —
      Crook                                          27,543         11,155    1,283        —         39,981              49.0
      Weston                                               —         1,357     131       100          1,588                1.9
    North Central Wyoming                             4,613            970     367         —          5,950                7.3
      Big Horn                                        1,609             12                            1,729                2.1
      Johnson                                             15           755     242         —          1,012                1.2
      Sheridan                                        2,345             —      125         —          2,470                3.0
      Washakie                                           644            95      —          —            739                0.9
    Northwest Wyoming                                 4,356          4,785     300          5         9,446               11.6
      Fremont                                               8           29      —           5            42                0.1
      Hot Springs                                          —            25     300         —            325                0.4
      Lincoln                                            351         3,961      —          —          4,312                5.3
      Park                                            3,235             18      —          —          3,253                4.0
      Sublette                                           679           752      —          —          1,431                1.8
      Teton                                               83            —       —          —             83                0.1
    Southeast Wyoming                                17,673             51     530      2,000        20,254              24.8
     Albany                                           8,894             22       4         —          8,920              10.9
      Carbon                                          8,779             —      500      2,000        11,279              13.8
      Converse                                             —            18      15         —             33                0.0
      Goshen                                               —            —        —         —             —                 —
      Laramie                                              —            —        —         —             —                 —
      Natrona                                              —            11      11         —             22                0.0
      Niobrara                                             —            —        —         —             —                 —
      Platte                                               —            —        —         —             —                 —
    Southwest Wyoming                                    340         4,010       —         52         4,402                5.4
      Sweetwater                                           —            —        —         —             —                 —
      Uinta                                              340         4,010       —         52         4,402                5.4
    All counties   a
                                                     54,525         22,328    2,611     2,157        81,621               100
a
    Percentage detail may not sum to 100 percent due to rounding.

Harvest by Species
                            As in previous years, ponderosa pine and lodgepole pine were Wyoming’s most
                       harvested species; however, the species composition of the State’s sawlog harvest has
                       shifted from predominantly lodgepole pine (73 percent in 1969) to a distribution with
                       an increasing component of ponderosa pine (73 percent in 2005) (tables 5, 6, and 7). In
                       2018, ponderosa pine constituted 53 percent of the sawlog harvest, while lodgepole pine
                       constituted 24 percent. Both spruces and firs made up close to 11 percent each, with other
                       species making up less than 1 percent. Harvest volume of spruce increased by more than
                       17 percent between 2014 and 2018 (from 1.6 MMCF to 1.9 MMCF).

6                                                                                          USDA Forest Service RMRS-RB-33. 2021.
Table 4—Wyoming timber harvest volume by ownership source and product type, 2018.
    Ownership source                                             Sawlogs              Post and pole                   Other productsa             All products
                                                                ------------------------------ Thousand board feet, Scribner ---------------------------------
    Private timberlands                                             21,181                            368                            779                  22,328
       Industrial                                                         —                            —                              —                         —
       Non-industrial                                               21,181                            368                            779                  22,328
    Public timberlands                                              56,240                         1,724                         1,329                    59,293
       National Forests                                             52,121                         1,447                             957                  54,525
       Other publicb                                                  4,119                           277                            372                   4,768
    Total                                                           77,421                         2,092                         2,108                    81,621
                                                                 -------------------------------------- Percent of harvest ----------------------------------------
    Private timberlands                                                27.4                           17.6                         37.0                      27.4
       Industrial                                                         —                            —                              —                         —
       Non-industrial                                                  27.4                           17.6                         37.0                      27.4
    Public timberlands                                                 72.6                           82.4                         63.0                      72.6
       National Forests                                                67.3                           69.2                         45.4                      66.8
       Other public    b
                                                                         5.3                          13.2                         17.6                        5.8
    Total                                                               100                           100                            100                      100
a
    Other timber products include logs used for house logs, log furniture, and industrial fuelwood.
b
    Other public includes State and BLM lands.

Table 5a—Wyoming timber harvest by species, selected years.
    Species                                                            1983                2000          2005           2010          2014            2018
                                                                     ----------------------------- Thousand board feet, Scribner ----------------------------
    Ponderosa pine                                                  70,203              42,121               44,156        19,538          23,702        41,099
    Lodgepole pine                                                  60,058              18,824                9,853        13,383          29,024        22,535
    Engelmann/Black Hills spruce                                      9,528               4,112               3,640         6,510           7,699          8,541
    Douglas-fir                                                       4,688               3,562               5,785         1,107           6,775          4,227
    True firs                                                         2,492               1,661                597            107             178          4,491
    Other softwoodsa                                                      93                  13                 4          1,048                9           236
    Hardwoods                                                             36                201                  3              —             161            492
    All species                                                    147,098              70,494               64,038        41,694          67,548        81,621

Table 5b—Wyoming timber harvest by species, selected years.
    Species                                                            1983                2000               2005           2010           2014            2018
                                                              ------------------------------------- Percent of harvest -------------------------------------------
    Ponderosa pine                                                      47.7               59.8                69.0           46.9           35.1            50.4
    Lodgepole pine                                                      40.8               26.7                15.4           32.1           43.0            27.6
    Engelmann/Black Hills spruce                                         6.5                 5.8                5.7           15.6           11.4            10.5
    Douglas-fir                                                          3.2                 5.1                9.0            2.7           10.0             5.2
    True firs                                                            1.7                 2.4                0.9            0.3            0.3             5.5
    Other softwoods        a
                                                                         0.1                 0.0                0.0            2.5             0.0            0.3
    Hardwoods                                                            0.0                 0.3                0.0             —              0.2            0.6
    All speciesb                                                         100                100                100            100             100            100
Sources: Brandt et al. 2009; McIver et al. 2018; McLain 1987; Morgan et al. 2005.
a
  Other softwoods include limber pine, western hemlock, western larch, western redcedar, and western white pine.
b
    Percentage detail may not sum to 100 percent due to rounding.

USDA Forest Service RMRS-RB-33. 2021.                                                                                                                                 7
Table 6a—Wyoming timber harvest by species and product, 2018.
    Species                                                    Sawlogs                        Post          Other productsa              All products
                                                      ------------------------------------ Thousand board feet, Scribner ----------------------------------
    Ponderosa pine                                                  41,095                        4                                 —                  41,099
    Lodgepole pine                                                  18,740                   2,045                            1,750                    22,535
    Spruces                                                          8,469                       12                               60                    8,541
    Douglas-fir                                                      3,982                        3                             242                     4,227
    Other species    b
                                                                     5,135                       28                               56                    5,219
    All species                                                     77,421                   2,092                            2,108                    81,621

Table 6b—Wyoming timber harvest by species and product, 2018.
    Species                                                    Sawlogs                        Post             Other productsa                 All products
                                                    -------------------------------------------- Percent of harvest --------------------------------------------
    Ponderosa pine                                                    53.1                      0.2                                 —                     50.4
    Lodgepole pine                                                    24.2                    97.8                             83.0                       27.6
    Spruces                                                           10.9                      0.6                              2.8                      10.5
    Douglas-fir                                                        5.1                      0.1                             11.5                        5.2
    Other species    b
                                                                       6.6                      1.3                              2.7                        6.4
    All speciesc                                                      100                      100                              100                        100
a
  Other products include logs used for log homes, log furniture, and industrial fuelwood.
b
  Other species include subalpine fir, Rocky Mountain juniper, and aspen.
c
  Percentage detail may not sum to 100 percent due to rounding.

Table 7a—Wyoming sawlog harvest by species, selected years.

    Species                                         1969             1976         1983         2000          2005           2010          2014           2018
                                                     -------------------------------------- Thousand cubic feet ----------------------------------------------
    Ponderosa pine                                 3,383            6,000       14,138         8,870         9,235         3,916         5,130          9,381
    Lodgepole pine                               21,300          12,546         11,990         2,869         1,394         2,362         5,558          4,278
    Engelmann/Black Hills spruce                   3,399            2,563        1,902           863           761         1,110         1,645          1,933
    Douglas-fir                                      833            1,323           937          622         1,183           185         1,461             909
    True firs                                        369            1,084           503          222           124             18             2         1,012
    Other species    a
                                                         3             75            26               3          —           171             35            160
    All species                                  29,287          23,591         29,496       13,449        12,697          7,762        13,831         17,674

Table 7b—Wyoming sawlog harvest by species, selected years.
    Species                                         1969             1976         1983         2000          2005           2010          2014           2018
                                                  -------------------------------------------- Percent of harvest ----------------------------------------------
    Ponderosa pine                                   11.6            25.4          47.9         66.0          72.7          48.5          37.1            53.1
    Lodgepole pine                                   72.7            53.2          40.6         21.3          11.0          25.0          40.2            24.2
    Engelmann/Black Hills spruce                     11.6            10.9            6.4          6.4           6.0         19.8           11.9           10.9
    Douglas-fir                                       2.8             5.6            3.2          4.6           9.3           3.3         10.6              5.1
    True firs                                         1.3             4.6            1.7          1.7           1.0           0.3           0.0             5.7
    Other speciesa                                    0.0             0.0            0.0          0.0              -          3.1           0.3             0.9
    All speciesb                                     100              100           100          100           100           100           100             100
Sources: Brandt et al. 2009; Keegan and White 1979; Keegan et al. 1979; McIver et al. 2018; McLain 1987; Morgan et al. 2005; Setzer 1971
a
  Other species include aspen, limber pine, western hemlock, western larch, western redcedar, and western white pine.
b
    Percentage detail may not sum to 100 percent due to rounding.

8                                                                                                               USDA Forest Service RMRS-RB-33. 2021.
End Uses
                 Wyoming’s 2018 total timber harvest was approximately 18,973 MCF, which went to
             timber processors both within and outside the State. Of this volume, 93.7 percent (17,793
             MCF) went to sawmills, 4.6 percent (864 MCF) went to post and pole manufacturers, and
             1.7 percent (316 MCF) went to other facilities, including house log/log home facilities, and
             firewood and wood pellet manufacturing (fig. 4).
                 By converting all mill inputs from board feet Scribner to cubic feet, inputs are
             measured in the same units as outputs, thus accounting for both mill residues and timber
             products. This allows the flows of wood fiber from different components of the industry,
             which usually express outputs in different units, to be analyzed collectively. The following
             conversion factors, converting Scribner board foot volume to cubic feet, were developed
             from log size specifications, as well as product and residue recovery information, provided
             by processors of Wyoming’s 2018 timber harvest:
                 • 5.01 board feet per cubic foot for house logs
                 • 4.37 board feet per cubic foot for sawlogs
                 • 2.55 board feet per cubic foot for posts and poles
                 • 4.88 board feet per cubic foot for all other products

             Figure 4—Wyoming timber harvest and utilization.

USDA Forest Service RMRS-RB-33. 2021.                                                                       9
Timber Flow
                         Wyoming continues to have proportionately larger flows of timber into and out of
                    the State than other western States, primarily because its timber resource and mills are
                    located along its borders. In 2018, Wyoming mills brought in 27.6 MMBF of timber from
                    other States, while 30.5 MMBF of Wyoming timber was processed out-of-state, making
                    the State a net exporter of 2.9 MMBF of timber (tables 8, 9, and 10). In 2014, Wyoming
                    was a net importer of nearly 24 MMBF of timber, with mills bringing in more than 49
                    MMBF of timber from other States (McIver et al. 2018b), nearly double the imports
                    observed in 2018. During 2014, more than 25 MMBF was processed out-of-state (McIver
                    et al. 2018b) compared with the 30.5 MMBF exported in 2018. More than 58 MMBF
                    crossed Wyoming State lines in 2018, a volume equal to 71 percent of the State’s timber
                    harvest. In comparison, nearly 75 MMBF crossed Wyoming State lines in 2014, a volume
                    equivalent to 110 percent of the State’s timber harvest that year.
                         Of the Wyoming timber processed in-state, 92 percent was processed in the resource
                    area where it was harvested (table 11). The proportion of timber harvested and processed
                    in the same resource area increased from 60 percent in 2014. Contractions in lumber
                    markets likely made it uneconomical for timber to travel farther to be processed.

Table 8—Timber flow into (imports) and out of (exports) Wyoming, 2018.
    Timber products                                                    Imports                  Exports             Net imports (Net exports)
                                                           ------------------------------ Thousand board feet, Scribner -----------------------------
    Sawlogs                                                              26,762                   28,470                                    (1,708)
    Post and pole                                                           844                       656                                       188
    Other products     a
                                                                               6                   1,416                                    (1,410)
    All products                                                         27,612                   30,542                                    (2,930)
a
    Other products include house logs and log furniture.

Table 9—Origin of timber processed by Wyoming mills by State, 2018.

    Origin                                                   Amount processed (MBF)                            Percent of volume processed
    Colorado                                                                           8,027                                                   10.2
    Idaho                                                                                  60                                                    0.1
    Montana                                                                              483                                                     0.6
    South Dakota                                                                      14,941                                                   19.0
    Utah                                                                               4,100                                                     5.2
    Total from out-of-state                                                           27,611                                                   35.1

    Wyoming                                                                           51,080                                                   64.9
    Total from all States     a
                                                                                      78,691                                                    100
a
    Total may not add to 100 percent due to rounding.

10                                                                                                      USDA Forest Service RMRS-RB-33. 2021.
Table 10—Location of mills processing timber harvested in Wyoming, 2018.

    Mill location                                           Amount processed (MBF)                                   Percent of volume processed
    Colorado                                                                               24
Table 12—Active Wyoming primary wood products facilities by county and product, 2018 and other years.

                                                                            Post and            Log             Log                Other        All
    County                                           Sawmills                  poles          homes        furniture           productsa   products
    Northeast Wyoming                                           2                      1         —                 —                  —          3
      Campbell                                                 —                     —           —                 —                  —          —
      Crook                                                     2                      1         —                 —                  —          3
      Weston                                                   —                     —           —                 —                  —          —
    North Central Wyoming                                       3                      2         —                 —                  —          5
      Big Horn                                                  1                      1         —                 —                  —          2
      Johnson                                                   1                      1         —                 —                  —          2
      Sheridan                                                 —                     —           —                 —                  —          —
      Washakie                                                  1                    —           —                 —                  —          1
    Northwest Wyoming                                           3                      4           1               —                  1          9
      Fremont                                                   1                      3         —                 —                —1           5
      Hot Springs                                              —                     —           —                 —                  —          —
      Lincoln                                                   1                    —           —                 —                  —          1
      Park                                                     —                     —           —                 —                  —          —
      Sublette                                                  1                      1           1               —                  —          3
      Teton                                                    —                     —           —                 —                  —          —
    Southeast Wyoming                                           2                      3           1                 1                1          8
      Albany                                                   —                       2           1                 1                —          4
      Carbon                                                    1                    —           —                 —                  —          1
      Converse                                                  1                      1         —                 —                  —          2
      Goshen                                                   —                     —           —                 —                  —          —
      Laramie                                                  —                     —           —                 —                  1          1
      Natrona                                                  —                     —           —                 —                  —          —
      Niobrara                                                 —                     —           —                 —                  —          —
      Platte                                                   —                     —           —                 —                  —          —
    Southwest Wyoming                                           2                      2         —                 —                  1          5
      Sweetwater                                               —                     —           —                 —                  —          —
      Uinta                                                     2                      2         —                 —                  —          5
    2018 Total                                                12                     12            2                 1                3         30
    2014 Total                                                12                       9           3                 2                2         28
    2010 Total                                                12                       7           3                 2                5         29
    2005 Total                                                21                       8         18                  8                4         59
    2000 Total                                                23                       8           8               11                 5         55
    1983 Total                                                34                       3           4                 0                0         41
    1976 Total                                                50                       7           4                 0                1         62
    1962 Total                                                76                       0           0                 0                0         76
Sources: Brandt et al. 2009; Keegan et al. 1979; Keegan and White 1979; McIver et al. 2018; McLain 1987; Morgan et al. 2005.
a
    Other primary products include fuel pellets, firewood, and other primary manufacturers.

12                                                                                                            USDA Forest Service RMRS-RB-33. 2021.
Figure 5—Location of Wyoming’s primary wood products manufacturers, 2018.

Timber Received by Wyoming Mills
                         As opposed to the volume of timber harvested within a State, timber received refers to
                     the volume of timber delivered to in-state mills from both in-state and out-of-state sources.
                     In 2018, Wyoming mills received 78.7 MMBF of timber for processing. This amount
                     constituted a 14 percent decrease from the amount processed in 2014 (tables 13, 14).
                         Twenty-two percent (17.4 MMBF) of the timber received by Wyoming mills in 2018
                     originated from private lands, while public timberlands contributed the remaining 78
                     percent (61.3 MMBF). These are the same proportions as in 2014 but dramatically different
                     from 2005, when private lands contributed 57 percent and public lands 43 percent.

Table 13—Timber received at Wyoming mills by ownership class, 2018.

    Ownership class                                                      Volume                               Percent of total
                                                                    MBF, Scribner
    Private                                                               17,386                                         22.1
      Industrial                                                              —                                            —
      Non-industrial                                                      17,386                                         22.1
    Public                                                                61,306                                         77.9
      National Forest                                                     53,993                                         68.6
      Other public   a
                                                                           7,313                                          9.3
    Canadian                                                                  —                                            —
    All owners   b
                                                                          78,691                                          100
a
    Other public includes State and BLM lands.
b
    Percentage detail may not sum to 100 percent due to rounding.

USDA Forest Service RMRS-RB-33. 2021.                                                                                       13
Table 14—Timber received at Wyoming mills by ownership class and product type, 2018.

    Ownership class                                              Sawlogs              Post and pole            Other productsa               All products
                                                        ------------------------------------ Thousand board feet, Scribner ----------------------------------
    Private                                                         16,734                     514                             138                  17,386
      Industrial                                                          —                      —                               —                        —
      Non-industrial                                                16,734                     514                             138                  17,386
    Public                                                          58,980                    1,766                            560                  61,306
     National Forest                                                52,249                    1,556                            188                  53,993
    Other public    b
                                                                     6,731                     210                             372                    7,313
    All owners                                                      75,713                    2,280                            698                  78,691
a
    Other products include logs used for log homes, log furniture, and industrial fuelwood.
b
    Other public includes state and BLM lands.

Trends and Capacity by Sector

                    Sawmill Sector
                         Lumber production in Wyoming peaked in the 1980s and has generally been declining
                    since (fig. 6), following trends observed in several other western States (McIver et al. 2013 and
                    2015; Sorenson et al. 2012). Lumber-production declines continued into the 21st century despite
                    strong housing and lumber markets in 2004 and 2005. These markets bottomed out in 2009,
                    severely impacting Wyoming’s remaining forest products industry, though a slow recovery
                    began in 2010 and 2011. By 2014, timber harvest and lumber production exceeded prerecession
                    levels, only to drop again by 2018 to reach an average annual production level of 9.9 MMBF
                    (table 15). This constitutes a 5 percent decrease from 2014.
                         Wyoming’s 12 sawmills processed 77.7 MMBF Scribner in 2018, 102 percent more
                    than the volume of sawlogs received by Wyoming sawmills due to existing inventory. These
                    sawmills produced about 118.4 MMBF lumber tally of lumber, timbers, and other sawn
                    products, which constitutes a 5 percent decrease compared to 2014 production. Sales from
                    the sawmill sector were $57 million, compared to the 2014 sales value of slightly less than
                    $60 million (inflation adjusted).
                         The 12 sawmills active in Wyoming in 2018 had a combined annual production capacity
                    of 171.3 MMBF lumber tally, of which only 69 percent was utilized (table 18). The 6
                    sawmills with annual output capacity greater than 1 MMBF accounted for 98 percent of the
                    State’s lumber-producing capacity and 99 percent of lumber production.

                    Post and Pole Sector
                        The post and pole sector consists of manufacturers of fence posts, small poles and rails
                    used in fence construction. The number of post and pole producers jumped from 9 facilities
                    in 2014 to 12 in 2018, an increase of 33 percent. The combined annual output capacity of
                    the 12 active Wyoming producers was 1,558,000 pieces with 957,000 pieces produced, for a
                    capacity utilization of 61 percent.

14                                                                                                              USDA Forest Service RMRS-RB-33. 2021.
300

                                        250
Lumber production (MMBF lumber tally)

                                        200

                                        150

                                        100

                                        50

                                         0
                                          47
                                          49
                                          51
                                          53
                                          55
                                          57
                                          59
                                          61
                                          63
                                          65
                                          67
                                          69
                                          71
                                          73
                                          75
                                          77
                                          79
                                          81
                                          83
                                          85
                                          87
                                          89
                                          91
                                          93
                                          95
                                          97
                                          99
                                          01
                                          03
                                          05
                                          07
                                          09
                                          11
                                          13
                                          15
                                          17
                                        19
                                        19
                                        19
                                        19
                                        19
                                        19
                                        19
                                        19
                                        19
                                        19
                                        19
                                        19
                                        19
                                        19
                                        19
                                        19
                                        19
                                        19
                                        19
                                        19
                                        19
                                        19
                                        19
                                        19
                                        19
                                        19
                                        19
                                        20
                                        20
                                        20
                                        20
                                        20
                                        20
                                        20
                                        20
                                        20
                                                                                              Year

                                              Figure 6—Wyoming annual lumber production 1947–2018 (source: WWPA 1947-2019).

       Table 15—Active Wyoming sawmills and annual average lumber production per mill, selected years.

                     Year                                                       Number of mills           Average annual lumber production per mill
                                                                                                                                            MMBF, lumber tally
                     2018                                                                   12                                                                  9.9
                     2014                                                                   12                                                                10.4
                     2010                                                                   12                                                                  4.6
                     2005                                                                   21                                                                  6.0
                     2000                                                                   23                                                                  7.3
                     1983                                                                   34                                                                  5.0
                     1976                                                                   50                                                                  4.1
                     1974                                                                   49                                                                  3.4
                     1969                                                                   50                                                                  3.8
                     1966                                                                   65                                                                  1.9
                     1962                                                                   76                                                                  1.4
                     1957                                                                  107                                                                  1.0
       Sources: Brandt et al. 2009; Keegan and White 1979; Keegan et al. 1979; McIver et al. 2018; McLain 1987; Miller and Wilson 1959; Morgan et al. 2005; Setzer
       and Wilson 1970; Setzer 1971; Spencer and Farrenkopf 1964.

  USDA Forest Service RMRS-RB-33. 2021.                                                                                                                              15
Log Home and Log Furniture Sector
            In 2018, Wyoming had two log home manufacturers and one manufacturer of log
       furniture, down from three and two, respectively, in 2014. The sector’s peak was in 2005,
       when 18 log home and 8 log furniture businesses were active. The severe contraction in
       this sector was largely due to the 2006 housing collapse and recession as these products
       tend to be luxury goods and, as such, tie the industry to regional and national economic
       conditions. However, with relatively low capital costs, many inactive facilities could
       recommence production as demand increases.

       Other Sectors
           The three remaining primary forest products facilities active during 2018 in Wyoming
       include a pellet mill, one animal shavings manufacturer, and a commercial firewood
       producer. The pellet and shavings operations utilized chips, sawdust, and shavings
       generated as mill residue by other primary processing facilities. Production statistics and
       sales figures for the individual sectors are not provided in order to protect firm-level data.

Input and Other Capacity
            There are two measures of capacity: input capacity, which refers to timber processing,
       and output, referring to production. Output capacity is the most commonly utilized,
       measuring the volume of finished product a mill could produce within a given timeframe,
       usually per shift or per year. However, finished products are measured in a variety of units
       depending on the output: board feet lumber tally (lumber), lineal feet (house logs), and
       pieces (posts and poles, log furniture), etc., making it difficult to express the total capacity
       of the industry as a whole. The alternative is to use input capacity, often measured as
       timber-processing capacity, which is a measure of the volume of timber (i.e., logs) that
       a mill could process in a given timeframe, generally per year, measured in board feet
       Scribner.

       Timber-Processing Capacity
           Wyoming timber processors provided their 8-hour shift and annual production
       capacities, given sufficient supplies of raw materials and a firm market demand for
       their products. To estimate the industry’s total capacity to process timber, production
       capacity was divided by each facility’s recovery factor and expressed in units of timber
       input (i.e., MMBF Scribner) (tables 16 and 17). For example, sawmill capacity figures
       were calculated by dividing a mill’s lumber-production capacity by that mill’s calculated
       lumber recovery, measured in board feet of lumber per board foot Scribner of timber.
           Wyoming’s 2018 timber-processing capacity was 116.7 MMBF Scribner, of which
       69 percent was utilized—a decrease of more than 9 percent compared to 2014. Capacity
       has dropped by more than 60 percent since its 1986 peak of close to 308 MMBF.
       Wyoming capacity utilization has historically not exceeded 50 percent (fig. 7); however,
       recent improvements in wood product markets and rising timber harvests on private and
       State lands in the region have enabled remaining facilities to increase operating levels
       over the past few years.

16                                                                             USDA Forest Service RMRS-RB-33. 2021.
Table 16—Active primary timber processorsa by capacity size class, percent of total timber capacity, timber use, and percent of
total timber use, 2018.

                                                                                    Percent         Average                                       Average
                                                                                     of total         timber                        Percent         timber
    Log input capacity size                   Number of            Timber            timber         capacity            Timber       of total      use per
    classb                                        mills           capacity         capacity          per mill              use   timber use            mill
                                                                      MBFc                              MBFc              MBFc                        MBFc
    1 MMBF or less                                      21            5,885                5.1             280           4,758           5.9            227

    Between 1 and 5 MMBF                                  4          11,908              10.3           2,977            4,725           5.9          1,181

    Over 5 MMBF                                           3         97,893               84.6          32,631           71,256          88.3        23,752
    Total                                               28         115,686                100           4,132           80,739           100          2,884
a
    Includes only roundwood receiving facilities. Pellet mills and animal shavings manufacturers are not included.
b
    Log input capacity is expressed in million board feet (MMBF), Scribner.
c
 Timber use and capacity are expressed in thousand board feet (MBF) Scribner.

Table 17—Wyoming’s timber-processing capacity and volume utilized, 1976–2018.

    Year                                             Processing capacitya                            Volume utilized                    Percent utilized
                                                    ------------------------------------- Thousand board feet, Scribner -------------------------------------
    2018                                                                116,682                                      80,739                            69.2
    2014b                                                               118,845                                      91,204                            76.7
    2010                                                                137,104                                      43,873                            32.0
    2005    b
                                                                        180,157                                      88,522                            49.1
    2002                                                                217,094                                      74,875                            34.0
    2000                                                                260,194                                  113,687                               44.0
    1996                                                                273,483                                  116,906                               43.0
    1986                                                                307,800                                  153,608                               50.0
    1983                                                                272,867                                  153,260                               56.0
    1976                                                                302,083                                  147,280                               49.0
Sources: Brandt et al. 2009; Keegan and White 1979; McLain 1987; McIver et al. 2018; Morgan et al. 2005; Keegan et al. 1979.
a
  Includes active and inactive sawmills, post and pole, log home, log furniture, and commercial firewood facilities.
b
    Represents revised processing capacity.

USDA Forest Service RMRS-RB-33. 2021.                                                                                                                      17
350
                                                                                                                             Processing capacity

                                                                                                                             Volume processed

                               300

                               250
             MMBF (Scribner)

                               200

                               150

                               100

                               50

                                0
                                     1976      1983     1986        1996      2000           2002         2005        2010            2014         2018
                                                                                     Year

                               Figure 7—Wyoming timber-processing capacity, selected years (sources: Keegan and White 1979; Keegan and
                               others 1979; McLain 1987; Morgan et al. 2005; Brandt et al. 2009; McIver et al. 2018).

                               Lumber-Production Capacity
                                    Capacity to produce lumber varies considerably among Wyoming’s 12 sawmills, from
                               less than 1 MMBF to over 100 MMBF (table 18). Lumber-production capacity in 2018
                               was 171.3 MBF lumber tally, of which 69 percent was utilized.

                               Mill Residue
                                    Over half (58 percent) of the wood fiber processed by primary forest products
                               manufacturers in Wyoming in 2018 ended up as mill residue. Residue can present a
                               difficult and expensive disposal problem, or it can be used to produce additional products
                               to generate revenue. The three types of wood residues include coarse residues (chips,
                               slabs, edging, trim, and log ends), fine residue (planer shavings and sawdust), and bark.

Table 18—Capacity and production of active Wyoming sawmills by production capacity size class, 2018.

                                                                            Percent         Average                               Percent             Average
    Lumber production                       Number        Production         of total       capacity                               of total        production
    capacity size class                     of mills        capacity       capacity          per mill     Production           production              per mill
                                                                    MBF                         MBF                MBF                  MBF                MBF
    1 MMBF or less                                6              2,300           1.3                383             625                   0.5               104
    between 1 and 10 MBF                          3             11,000           6.4           3,667               8,690                  7.3              2,897
    over 10 MMBF                                  3            158,000          92.2          52,667             109,050                 92.1             36,350
    Totala                                       12            171,300        100.0           14,275             118,365               100.0               9,864
a
    Percentage detail may not sum to 100 percent due to rounding.

18                                                                                                               USDA Forest Service RMRS-RB-33. 2021.
Wyoming primary forest product manufacturers generated 142,710 bone dry
                   units (BDU) of mill residue in 2018, 97 percent of which was utilized (table 19). This
                   constitutes just a slight increase from 96 percent in 2014. The proportion of mill residues
                   that are utilized has been increasing over time, from 33 percent in 1969, to 60 percent
                   in 1983, 85 percent in 2000, and 97 percent in 2010—very similar to utilization rates
                   observed during 2018 (Brandt et al. 2009; McIver et al. 2014; Morgan et al. 2005).
                        Thirty-nine percent (55,411 BDU) of Wyoming’s 2018 mill residue was used for
                   energy, including firewood, raw material to manufacture wood pellets, burned to generate
                   electricity, or burned in a boiler system on-site at mills (table 19). Another 33 percent
                   (46,651 BDU) went to pulp and reconstituted board plants, while 25 percent (35,891
                   BDU) of residue was used for animal bedding, mulch, and decorative bark. The remaining
                   3 percent (4,756) was not used.
                        Statewide residue volume factors (table 20), which express mill residue generated
                   per MBF of lumber produced, were derived from production and residue output volumes
                   provided by Wyoming sawmills. Sawmills accounted for 88 percent of all mill residues
                   generated in 2018, or about 126,000 BDU. More than 99 percent of this residue was
                   utilized (table 21), with the highest utilization (100 percent) in coarse residue types. The
                   forest industry has worked towards improving residue utilization through investments of
                   time and capital, and sawmill utilization of residue has increased over time (table 22).

Table 19a—Wyoming’s production and disposition of residues, 2018.

    Type of residuea                  Pulp and board                Energy         Other uses           Total utilized         Non-utilized                  Total
                                      ------------------------------------------------------ Bone-dry units ------------------------------------------------------
    Coarse                                         36,911            20,029              12,362                  69,302                    455             69,757
    Fine:                                           9,740            23,449              15,522                  48,711                    848             49,560
      Sawdust                                       6,003            15,800                3,105                 24,908                    463             25,370
      Planer shavings                               3,737             7,649              12,418                  23,804                    386             24,189
    Bark                                                   -         11,934                8,007                 19,941                 3,453              23,393
    Total                                          46,651            55,411              35,891                137,954                  4,756            142,710

Table 19b—Wyoming’s production and disposition of residues, 2018.

    Type of residuea                   Pulp and board               Energy         Other uses           Total utilized         Non-utilized                  Total
                                      ------------------------------------------------------ Percent of total ------------------------------------------------------
    Coarse                                             52.9              28.7                17.7                   99.3                    0.7                100
    Fine:                                              19.7              47.3                31.3                   98.3                    1.7                100
       Sawdust                                         23.7              62.3                12.2                   98.2                    1.8                100
       Planer shavings                                 15.4              31.6                51.3                   98.4                    1.6                100
    Bark                                                   -             51.0                34.2                   85.2                  14.8                 100
    Total                                              32.7              38.8                25.1                   96.7                    3.3                100
a
    Includes residue from the manufacture of post and poles, house logs, and log furniture, as well as lumber and plywood.

USDA Forest Service RMRS-RB-33. 2021.                                                                                                                             19
Table 20—Wyoming sawmill residue factors, 2018.

    Type of residue                                                            Bone-dry unitsa
                                                      Per thousand board feet lumber tally
    Coarse                                                                                     0.56
    Sawdust                                                                                    0.21
    Planer Shavings                                                                            0.16
    Bark                                                                                       0.13
    Total                                                                                      1.06
a
    Bone-dry units (2,400 lbs. of ovendry wood) of the various residue types generated for every 1,000
board feet of lumber manufactured.

Table 21—Estimated volume of wood residue generated and utilized by Wyoming sawmills, 2018.

                                                             Wood residue                                         Percentage of type
     Residue type                        Used                 Unused                          Total          Used           Unused                 Total
                                     ------------------------- Bone-dry units --------------------       -------------------- Percent --------------------
    Coarse                             66,747                         33                    66,780           100.0                    -             53.0
    Finea                              43,997                       125                     44,122            99.7                 0.3              35.0
    Bark                               14,649                       415                     15,064             97.2                2.8              12.0
    Total                             125,393                       573                    125,966            99.5                 0.5               100
a
    Fine residue includes sawdust and planer shavings.

20                                                                                                         USDA Forest Service RMRS-RB-33. 2021.
Table 22—Historical sawmill utilization of Wyoming mill residues.

 Residue                                                   Year                                         Used                                       Unused
                                                                                           -------------------------------- Percent --------------------------
 Coarse                                                    2018                                         100.0                                                -
                                                           2014                                          95.9                                             4.1
                                                           2010                                          99.8                                             0.2
                                                           2005                                          98.5                                             1.5
                                                           2000                                          97.7                                             2.3
                                                           1983                                          77.4                                           22.6
                                                           1976                                          77.8                                           22.2
                                                           1969                                          58.2                                           41.8

 Fine                                                      2018                                          99.9                                            0.3
                                                           2014                                          99.1                                            0.9
                                                           2010                                          99.7                                            0.3
                                                           2005                                          99.7                                            0.3
                                                           2000                                          98.8                                            1.2
                                                           1983                                          49.4                                           50.6
                                                           1976                                          34.9                                           65.1
                                                           1969                                          28.7                                           71.3

 Bark                                                      2018                                          97.2                                            2.8
                                                           2014                                          88.3                                           11.7
                                                           2010                                          90.9                                            9.1
                                                           2005                                          69.8                                           30.2
                                                           2000                                          32.5                                           67.5
                                                           1983                                          31.9                                           68.1
                                                           1976                                          11.7                                           88.3
                                                           1969                                            0.1                                          99.9

 All residues                                              2018                                          99.5                                            0.5
                                                           2014                                          96.5                                            3.5
                                                           2010                                          97.3                                            2.7
                                                           2005                                          91.9                                            8.1
                                                           2000                                          84.5                                           15.5
                                                           1983                                          59.5                                           40.5
                                                           1976                                          48.6                                           51.4
                                                           1969                                          32.8                                           67.2
Sources: Brandt et al. 2009; Keegan et al. 1979; Keegan and White 1979; McIver et al. 2018; McLain 1987; Morgan et al. 2005; Setzer 1971.

USDA Forest Service RMRS-RB-33. 2021.                                                                                                                       21
PRIMARY PRODUCT SALES VALUE AND MARKETS
                                     The 2018 FIDACS census in Wyoming identified 30 active primary forest products
                                manufacturers, reporting total sales of more than $63 million, free on board (f.o.b.) the
                                producing mill (table 23). This constitutes a 5 percent decrease from 2014, when sales were
                                reported at almost $66.5 million (constant 2018 dollars). Sales of lumber and other sawn
                                products continue to account for the bulk (90 percent) with a total sales value of $57 million
                                (fig. 8). While this proportion is a sizeable increase over 2014, total sales value for this product
                                category increased by less than $1 million, or 1 percent. The next largest sector, posts and poles,
                                experienced a sizeable drop in sales value, from $5.3 million (constant 2018 dollars) in 2014
                                to $3.8 million in 2018. Sales value for house logs and log homes was $152,000 (less than 1
                                percent of total sales) and close to $2.3 million for other products (4 percent of total sales).
                                     Approximately $57 million (90 percent) of Wyoming’s primary wood products sales were
                                to locations outside the State (fig. 9). The greatest market reported was the North Central
                                Region (34 percent), followed by the South (26 percent) and the Rockies (21 percent). More
                                than $6 million (10 percent) of total primary product sales remained in-state, with lumber
                                and other sawn products accounting for the majority ($4.5 million). Mills distributed their
                                products through their own distribution channels or through independent wholesalers and
                                selling agents. Because of subsequent wholesale transactions, the geographic destination
                                reported here may not reflect the ultimate delivery points of shipments.

                                160

                                140

                                120
     Millions of 2018 dollars

                                100

                                80

                                60

                                40

                                20

                                  -
                                      1970
                                      1971
                                      1972
                                      1973
                                      1974
                                      1975
                                      1976
                                      1977
                                      1978
                                      1979
                                      1980
                                      1981
                                      1982
                                      1983
                                      1984
                                      1985
                                      1986
                                      1987
                                      1988
                                      1989
                                      1990
                                      1991
                                      1992
                                      1993
                                      1994
                                      1995
                                      1996
                                      1997
                                      1998
                                      1999
                                      2000
                                      2001
                                      2002
                                      2003
                                      2004
                                      2005
                                      2006
                                      2007
                                      2008
                                      2009
                                      2010
                                      2011
                                      2012
                                      2013
                                      2014
                                      2015
                                      2016
                                      2017
                                      2018

                                                                                   Year

                                      Figure 8—Wyoming lumber sales, 1970–2018 (source: WWPA 1947-2018).

22                                                                                                     USDA Forest Service RMRS-RB-33. 2021.
Table 23a—Destination and sales value of Wyoming’s primary wood products, 2018.
                                                        Rocky                    Far              North                                    Other
    Product                                  Wyoming Mountainsa                 Westb           Centralc   Northeastd      Southe       Countries          Total
                                                                                   ------- Thousand 2018 dollars -----
    Lumber, timbers and                           4,463            11,414       1,615            19,782         1,725      16,344             1,712       57,055
    associated products
    Posts and poles                               1,283             1,425          556              582             —            —                —        3,847
    House logs and log homes                        125                 14           —               14             —            —                —         152
    Other finished products       f
                                                    238                641         216              860           100          100              100        2,256
    All primary wood products                     6,109            13,494       2,388            21,237         1,825      16,444             1,812       63,309

Table 23b—Destination and sales value of Wyoming’s primary wood products, 2018.
                                                                  Rocky           Far             North                                   Other
    Product                                   Wyoming          Mountainsa        Westb          Centralc   Northeastd      Southe      Countries           Total
                                                                                         ------ Percent of sales -----
    Lumber, timbers, and                               7.0               18.0        2.6            31.2           2.7        25.8               2.7        90.1
    associated products
    Posts and poles                                    2.0                2.3        0.9             0.9             —           —                —          6.1
    House logs and log homes                           0.2                0.0         —              0.0             —           —                —          0.2
    Other finished productsf                           0.4                1.0        0.3             1.4           0.2          0.2              0.2         3.6
    All primary wood products            g
                                                       9.7               21.3        3.8            33.5           2.9        26.0               2.9        100
a
    Rocky Mountains includes Arizona, Colorado, Idaho, Nevada, New Mexico, Utah, and Montana.
b
    Far West includes Alaska, California, Hawaii, Oregon, and Washington.
c
    North Central includes Illinois, Indiana, Iowa, Kansas, Michigan, Minnesota, Missouri, Nebraska, North Dakota, Ohio, South Dakota, and Wisconsin.
d
    Northeast includes Connecticut, Maine, Massachusetts, New Hampshire, New Jersey, Pennsylvania, Rhode Island, and Vermont.
e
    South includes Alabama, Arkansas, Delaware, Florida, Georgia, Kentucky, Louisiana, Maryland, Mississippi, North Carolina, Oklahoma, South Carolina,
    Tennessee, Texas, Virginia, and West Virginia.
f
    Other primary products include log furniture, wood pellets, firewood, and animal bedding.
g
    Percentage detail may not sum to 100 percent due to rounding.

USDA Forest Service RMRS-RB-33. 2021.                                                                                                                          23
Figure 9—Destination and sales value of Wyoming’s primary wood products.

FOREST INDUSTRY EMPLOYMENT AND LABOR INCOME
          Primary forest products manufacturers are just one component of the broader forest
     industry in Wyoming. The classification of forest industries used here follows the North
     American Industrial Classification System (NAICS), which is available online from the
     U.S. Department of Commerce. The forest industry in Wyoming consists of four sectors:
     NAICS 113 (forestry and logging), NAICS 1153 (forestry support activities), NAICS 321
     (wood products manufacturing), and NAICS 322 (paper manufacturing). These latter two
     sectors include employees who work in both the primary and secondary wood products
     and paper manufacturing industries. Data from the U.S. Census Bureau’s County Business
     Patterns (CBP) are used to distinguish between primary and secondary manufacturing
     employment and income.
          It should be noted that these four NAICS sectors provide a conservative estimate of
     total employment associated with the forest industry, as they do not reflect the additional
     employment created through the demand for services from log hauling companies, lumber
     and construction material wholesalers, road construction and maintenance contractors, and
     forest management services carried out by government agencies or nonprofit organizations.
          Data from the Bureau of Labor Statistics (Quarterly Census of Employment and
     Wages, QCEW) are combined with data from the Bureau of Economic Analysis in order
     to determine the magnitude of the forestry support sector. Such public data sources (e.g.,
     CBP) also provide a point of comparison for estimates of employment and labor income
     for the primary forest products manufacturing sector, as well as additional information on
     the larger forest industry.

24                                                                        USDA Forest Service RMRS-RB-33. 2021.
In 2018, total employment in the forest industry in Wyoming was an estimated 952
                             full- and part-time workers (USDC BEA 2020; USDC CB 2020; USDL BLS 2020). In
                             addition to the approximately 372 workers employed in the manufacturing of primary
                             wood products, an estimated 148 workers were employed in forestry and logging, 179
                             workers provided supporting activities for forestry operations, and the remaining 253
                             workers were employed in secondary manufacturing of wood products. Workers in the
                             forest industry earned just over $41 million (constant 2018 dollars) in labor income or
                             worker earnings. Labor income includes wages and salaries, some benefits, and earning of
                             the self-employed (figs. 10, 11).
                                  Since 2014, employment in the Wyoming forest industry has dropped by 16 percent,
                             from 1,136 to 952 workers. Labor income has experienced a smaller drop of 5 percent,
                             from $43.7 million in 2014 (in constant 2018 dollars) to $41.4 million in 2018. The
                             greatest drop in both employment and labor income occurred in the forestry support
                             sector, where both went down by 44 percent over the 4-year period. This drop, however,
                             masks an increase of over 100 percent since 2016, when sector employment dropped to
                             89 and labor income fell to below $1 million.
                                  Employment declines have outpaced drops in earnings in the forestry and logging
                             sector since 2014, a trend indicating that while workers in the industry are laid off, those
                             who remain are either working more/longer shifts, receiving higher pay than before, or a
                             combination of both.

                             2000

                                                                                              Total forest industry employment

                             1800                                                             Primary wood products mfg

                                                                                              Secondary wood products mfg

                             1600                                                             Support activities for forestry

                                                                                              Forestry and logging

                             1400
       Number of employees

                             1200

                             1000

                             800

                             600

                             400

                             200

                               0
                                    1998   2000   2002     2004    2006     2008     2010    2012           2014           2016   2018

                                                                            Year

                               Figure 10—Forest industry employment, 1998–2018 (sources: USDC BEA 2018b; USDC CB 2017; USDL
                               BLS 2018).

USDA Forest Service RMRS-RB-33. 2021.                                                                                                    25
70
                                                                                                                    Total forest industry labor income

                                                                                                                    Primary wood product mfg

                                    60                                                                              Secondary wood products mfg

                                                                                                                    Support activities for forestry

                                                                                                                    Forestry and logging

                                    50
         Millions of 2018 dollars

                                    40

                                    30

                                    20

                                    10

                                     -
                                          1998 1999 2000 2001 2002 2003 2004 2005 2006 2007 2008 2009 2010 2011 2012 2013 2014 2015 2016 2017 2018

                                                                                            Year

                                         Figure 11—Forest industry labor income, 1998–2018 (sources: USDC BEA 2018a; USDC CB 2017; USDL
                                         BLS 2018).

                                             Of the different forest industry sectors, forestry support has the lowest average annual
                                         income. The sector includes primarily seasonal workers, making many of the forestry
                                         support jobs only part-time. As a result, despite total industry employment dropping 16
                                         percent, labor income dropped by much less (5 percent). Overall, forest industry sectors
                                         experienced small increases in average labor income between 2014 and 2018.

CONTRIBUTION OF WYOMING’S FOREST INDUSTRY TO
THE STATE’S ECONOMY
                                              Economic contribution analyses measure gross changes in economic activity that can
                                         be associated with an industry, event, or policy on an existing regional economy (Watson
                                         et al. 2007). This report assesses the contribution of Wyoming’s forest industry as money
                                         spent on intermediate inputs, taxes, labor, and, in turn, by households, that generates
                                         economic opportunities as it cycles through the State’s economy.
                                              Primary and secondary wood products manufacturers, and forestry, logging, and
                                         forestry support firms directly contribute approximately 952 jobs and $41.4 million in
                                         labor income to the State. Using regional data and existing linkages within Wyoming’s
                                         economy represented by the Bureau of Economic Analysis’ (BEA) RIMS II multipliers1,
                                         BBER estimates that the wood products manufacturing sector alone supports more than
1
    The Bureau of Economic Analysis does not endorse any resulting estimates and/or conclusions about the contribution of a given sector on an area.

26                                                                                                                USDA Forest Service RMRS-RB-33. 2021.
You can also read