Year Ended 30 June 2021 Investor Presentation - Breville ...
←
→
Page content transcription
If your browser does not render page correctly, please read the page content below

17th August 2021

Manager, Company Announcements,
Australian Securities Exchange Limited,
Level 4, 20 Bridge Street,
Sydney NSW 2000

Year Ended 30 June 2021 Investor Presentation

Attached is a copy of the Breville Group Limited Investor Presentation for the year ended 30 June
2021.

The release of this announcement was authorised by the Board.

Yours faithfully,

Sasha Kitto and Craig Robinson
Joint Company Secretaries
Breville Group Limited

Telephone: (02) 9384 8100
Breville Group Limited (BRG)

      FULL YEAR FY21 RESULTS
        Investor Presentation
             17th August 2021
Disclaimer

    To the extent this Presentation contains any forward looking statements, such statements are not
    guarantees of future performance and involve known and unknown risks and uncertainties and other
    factors, many of which are beyond the control of Breville, its Directors and management, and involve
    elements of subjective judgement and assumptions as to future events which may or may not be correct.
    Actual performance may differ materially from these forward-looking statements. A number of
    important factors could cause actual results or performance to differ materially from the forward-
    looking statements. The forward-looking statements are based on information available to Breville as at
    the date of this Presentation. Except as required by law, including the ASX Listing Rules, Breville
    undertakes no obligation to provide any additional or updated information, whether as a result of new
    information, future events or results or otherwise.

2
Group Summary Result
    AUDm                                             FY211                  FY201                 % Chng                Commentary
    Revenue                                         1,187.7                 952.2                   24.7%               •   Record Group sales reaching ~$1.2bn
    Gross Profit                                     413.7                  320.6                   29.0%
                                                                                                                        •   Improved gross margin with higher
    Gross margin                                     34.8%                  33.7%                                           average selling price offsetting input
    EBITDA                                           163.3                  120.1                   36.0%                   cost inflation
    EBIT                                             136.4                   97.7                   39.6%
                                                                                                                        •   EBIT growth rate +39.6%, or +24.1%
    NPAT                                              91.0                   63.9                   42.3%                   against normalised FY20 (pcp +16.2%)
    EPS                                               65.8                   48.8                   34.8%
                                                                                                                        •   EPS growth +34.8%
    Normalised EBIT2                                 136.4                  109.9                  24.1%
                                                                                                                        •   Full year dividend 26.5c, 100%
    Normalised         NPAT2                          91.0                   72.7                  25.1%                    franked, in line with revised 40%
    Normalised EPS2                                   65.8                   55.6                  18.3%                    payout ratio to support continued
                                                                                                                            funding of growth agenda
    Dividends per share (cents)                       26.5                   41.0                 (35.4)%
    •   Interim                                       13.0                   20.5
                                                                                                                        •   High net cash position reflects
                                                                                                                            continued low working capital that
    •   Final                                         13.5                   20.5
                                                                                                                            should reverse in FY22
    Franked (%)                                     100.0%                  60.0%

    Net cash ($m)                                    129.9                  128.5                   1.1%

1FY21 and FY20 reflects the impact of the new IFRIC agenda decision on configuration and customisation costs in cloud computing arrangements ("SaaS accounting"). This has decreased FY21 EBITDA

by $10.3m (FY20: $6.5m) and EBIT by $6.1m (FY20: $3.2m).
2 FY20 shown normalised for impact of both abnormal expenses (doubtful debt provisioning and IoT platform write down) and abnormal cost savings (compensation and marketing) in Q4 2020 . Net

impact on EBIT +$12.2m , NPAT +$8.8m, EPS +6.8c. No normalisation of FY21 result.

3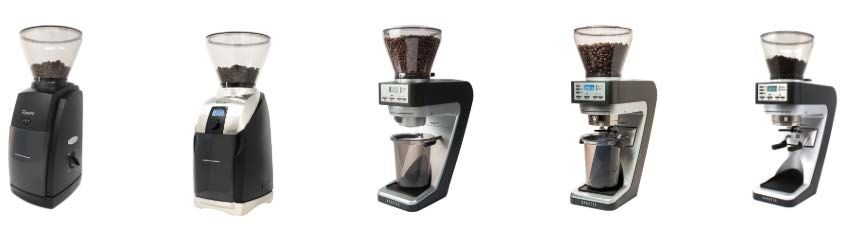
Segment Results
                                                         REVENUE                                                 EBIT                             EBIT MARGIN (%)
             AUDm
                                            FY21             FY20           % Chng              FY21            FY201           % Chng             FY21             FY201

             Global Product                984.2             764.4            28.7%             111.1             87.0           27.7%             11.3%            11.4%

                % Change CC2                                                 37.0%

             Distribution                  203.5             187.8            8.4%              25.3              22.9           10.6%             12.4%            12.2%

             TOTAL                        1,187.7            952.2            24.7%            136.4             109.9           24.1%             11.5%            11.5%

            Commentary
            •   Global Product segment constant currency revenue growth of 37.0%
            •   Work-from-home conditions and continued geographic expansion offsetting the impact of
                intermittent supply challenges
            • Distribution segment driven by strong growth in Breville Local, offset by lower growth in
              Kambrook & Nespresso
            • Incremental Distribution segment profits reinvested into Global segment

    1 FY20 shown normalised for impact of both abnormal expenses (doubtful debt provisioning and IoT platform write down) and abnormal cost savings (compensation and marketing) in Q4 2020 .
      Net impact on EBIT +$12.2m. No normalisation of FY21 result
    2 CC – Constant Currency

4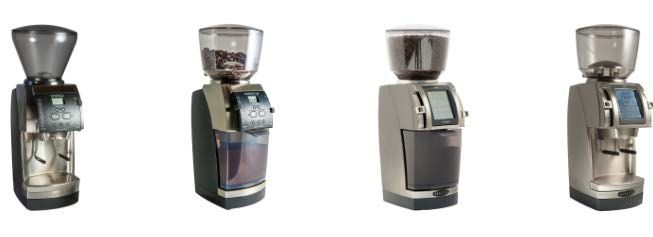
Global Segment Revenue by Theatre
                                                  GLOBAL PRODUCT SEGMENT REVENUE
    AUDm
                                     FY21                  FY20              % Chng $A            % Chng CC*

    Americas                         493.0                 422.3                16.7%                  27.6%

    EMEA                             257.0                 170.0                51.2%                  58.4%

    APAC                             234.2                 172.1                36.1%                  37.4%

    TOTAL                            984.2                 764.4                28.7%                  37.0%

                                                                                                  *CC – Constant Currency
    Group
    • Growth in constant currency strong in both halves >30%

    •   Strong denominator to be lapped in FY22
    •   Gross margins remain comparable across Theatres

    Theatres
    • Americas: +$71m and 27.6% cc sales growth. Consistent above trend sell-out growth supporting sell–in growth. Operations
      in Mexico commenced in Q4. Bricks-and-mortar retail largely now open. Some transportation-led inventory constraints in
      Q4. Weaker USD in H2 dampens A$ reported growth
    •   EMEA: +$87m and 58.4% cc sales growth. Europe, both new and existing markets, continuing to perform well. France entry
        completed in Q1, and Portugal and Italy entered in Q4. Some transport led inventory constraints in Q4
    •   APAC: +$62m and 37.4% cc sales growth. Strong performance across the entire region driven by sustained WFH, supply
        chain management, and consumer access to physical retail. Slower H2 (+24.3%) after remarkable H1 (+49.7%). Inventory
        largely restored to equilibrium levels

5
EBIT Bridge FY20 - FY21
                                          Sales & Margin Gains Reinvested in Growth Drivers

    A$m                                                                  13.7
                                                                     Gross Margin                     (49.0)
                                                                    +1.1% increase

                                           79.4                                                       Increased
                                                                                                    investment in
                                                                                                                                    (17.6)                        136.4
                                                                                                   Marketing, R&D,
                                                                                                        and IT                                                                  EBIT Increase
            109.9                                                                                                                                                +26.5             24.1%
                                          Net sales
                                        growth of 24%

                                                    Funds generation                                   Funds invested

            FY20                     Sales Growth                       GM%                     Mkting/R&D/IT                Other Overhead                       FY21
            EBIT1                                                                                                                                                 EBIT
       Commentary
       • Sales growth and gross margin improvement generated an incremental $93m gross profit
       • Incremental Gross Profit and operating leverage reinvested in medium-term growth drivers
       • Increased investment in marketing, R&D and IT by $49m or 43% over prior year
       • Other overheads well controlled, declining as % sales from 10.3% in FY20 to 9.6% in FY21
       • EBIT margin stable at 11.5%; EBIT$ grew by $27m or 24.1%
1   FY20 shown normalised for impact of both abnormal expenses (doubtful debt provisioning and IoT platform write down) and abnormal cost savings (compensation and marketing) in Q4 2020 .
    Net impact on EBIT +$12.2m. No normalisation of FY21 result

6
Financial Position at 30 June
AUDm FY21 FY201 Commentary
Inventory2 216.7 153.7 • Working capital below equilibrium by ~$80m
Receivables 119.3 156.1 – Inventory recovering, but a high proportion still in
Trade and other payables (175.8) (147.9) transit due to Yantian and Suez incidents and
inbound port delays
Working Capital 160.2 161.9
– Receivables below prior year due to improved
Fixed assets 14.4 13.5 debtor days (75days62days), exchange rate, and
Intangibles 229.8 144.0 constrained Q4 deliveries
– Payables growing in line with business
Other (liabilities) / assets (27.9) (32.8)
• Increase in intangibles +$85.8m driven by
NET ASSETS EMPLOYED 376.6 286.6
– Baratza acquisition (+$81.6m)
Net (Cash) / debt (129.9) (128.5) – Continued NPD investment
Shareholders’ equity 506.5 415.1
• Net cash of $130m
CAPITAL EMPLOYED 376.6 286.6 – Significant outflow planned for FY22 as working
capital normalises
3
ROE % 19.7% 17.9% • Adequate working capital debt facilities in place
4
ROA% 13.0% 11.3% • ROE/ROA showing good returns on invested capital
1 FY20 balance sheet has been restated to reflect adoption of IFRIC agenda decision on SaaS accounting
2 FY21Inventory comprises $142.1m in warehouse and $74.6m in-transit; FY20 $127m in warehouse and $27m in-transit
3 ROE is calculated based on NPAT for the 12 months ended 30 June for the financial year divided by the average of shareholders’ equity.
4 ROA is calculated based on NPAT for the 12 months ended 30 June for the financial year divided by the average of total assets.
7
Key Take Outs from FY21

    • Throughout FY21 we experienced strong demand for our products in all
     geographies, with demand spread broadly across our range

    • Gross margin % benefitted from mix and temporarily low promotional
     spend more than offsetting inflationary pressures in input costs

    • With core overheads well controlled, operating leverage was reinvested in
     marketing, R&D, and IT capability to support mid-term growth

    • EBIT growth accelerated to 24% over normalised pcp

    • The balance sheet is not at equilibrium: Inventory and Receivables are
     temporarily suppressed, resulting in cash being temporarily overstated

    • We are planning for a working capital rebuild in FY22

8
• FY21 Acceleration Program Execution

    • Strategy Assessment & Analysis

    • FY22 COVID Snapshot

9
FY21 New Product Launches
FY21 Colours
Fast Slow Pro The Bambino Creatista Pro
Black Stainless Steel
Almond Nougat
HydroPro HydroPro Plus FoodCycler
240v
Combi Wave 3 in 1 Compact Wave Pizzaiolo
Olive Tapenade
10New Geographies
France: April 2020 entry
Portugal: March 2021
COVID extended rollout
into beginning of FY21
Italy: April 2021 Mexico : May 2021
11Acquisition
• Headquarters: Seattle, WA
• Closed transaction Sep. 2020
• Fully integrated into corporate
platform
• Filled out grinder offering from
entry to light commercial
• Team extends coffee expertise
• Performing above expectations
12Corporate Platform Rollout
FY20 FY21 FY22
• Germany/Austria • United States • Canada (completed)
• Benelux • Italy • Baratza (completed)
• Switzerland • Portugal • Australia
• UK • Mexico • Any New Geography
• France • Hong Kong
• New Zealand
• Republic of Ireland
The Northern Hemisphere is now fully deployed. Australia is all that
remains, which will go live in the 2HFY22, plus any new geographies
13Acceleration Program Milestones Achieved in FY21
• Total Revenue exceeded $1 Billion
• EMEA now bigger than APAC in Global Segment
• Mainland Europe now bigger than UK
14• FY21 Acceleration Program Execution
• Strategy Assessment & Analysis
• FY22 COVID Snapshot
15Growth Acceleration Framework
More Larger
Product Market
Scalable, Acceleration Platform
Growth-Oriented Business Model
16Reinforcing Loop of Innovation Driven Growth
Marketing/R&D as %
Net Sales => 12%
Increase Investment
GTM Accelerate Revenue
Inorganic
NPD R
Increase Investment
Increase Revenue
Geography Increase Geographic Footprint
Accelerate Revenue
Marketing & NPD Efficiency
17Acceleration Program: EBIT Growth Evolution
160.0 25.0%
140.0 136.4
20.0%
Year/Year EBIT Growth Rate
120.0
109.9
97.3
EBIT A$ Millions
100.0
15.0%
86.9
79.0
80.0 73.7
10.0%
60.0
40.0
5.0%
20.0
0.0 0.0%
FY16 FY17 FY18 FY19 FY20 FY21
EBIT EBIT Growth
1HFY16: Made commitment that Acceleration Program (business
model evolution) would not “steal” from EBIT, and it has not
18Levers for Migrating Business Model
FY16 FY17 FY18 FY19 FY201 FY21
BRG Rev Growth A$ 9.4% 5.1% 7.7% 17.5% 25.3% 24.7%
Global CC Rev Growth 14.3% 13.4% 12.0% 20.1% 37.0%
EBIT Growth 5.9% 7.2% 10.0% 12.0% 16.2% 24.1%
There are four levers for changing the business model while simultaneously
growing EBIT dollars:
1. Identify cost savings in one function (e.g., finance), and convert the savings
to a marketing and R&D expense;
2. Generate EBIT dollars in the Distribution Segment and convert them to a
marketing and R&D expense in the Global Segment;
3. Create operating leverage and spend the savings on marketing and R&D;
and,
4. Grow revenue, in constant currency, faster than EBIT, spending
incrementally generated gross profit dollars on marketing and R&D while
simultaneously delivering overall EBIT growth.
Over the years, we have done all four.
1 FY20 shown normalised for impact of both abnormal expenses (doubtful debt provisioning and IoT platform write down) and abnormal cost savings (compensation
and marketing) in Q4 2020. Net impact on EBIT +$12.2m.
19Growth Lever Rollout by Theatre
FY17 FY18 FY19 FY20 FY21
Incrementally increase spend on Global Segment
APAC marketing and R&D
Incrementally increase spend on Global Segment
Americas marketing and R&D
Acquisitions
Geo Exp
Incrementally increase spend on Global
EMEA Segment marketing and R&D
Flip from Distributor to Direct GTM:
Geographic Expansion
20Global Segment Net Sales: APAC Theatre*
Business Model: Business Model:
• 8% Net Sales on • Climbing to 12% Net Sales on
marketing/R&D marketing/R&D
11.1%*
3.3%*
FY14 FY15 FY16 FY17 FY18 FY19 FY20 FY21
Increasing spend on marketing and R&D has
resulted in a 7.8% Net Sales CAGR improvement
* Net Sales and CAGR (Compound Annual Growth) calculations are based on a constant currency rate
21Global Segment Net Sales: Americas Theatre*
Business Model: Business Model:
• 8% Net Sales on • Climbing to 12% Net Sales on
marketing/R&D marketing/R&D
12.3%*
8.7%*
1%*
US
FY14 FY15 FY16 FY17 FY18 FY19 FY20 FY21
Increasing spend on marketing and R&D has
resulted in a 3.6% Net Sales CAGR improvement
* Net Sales and CAGR (Compound Annual Growth) calculations are based on a constant currency rate
22Global Segment Net Sales: EMEA Theatre*
Business Model: Business Model:
• Distributor GTM • Transitioning to Direct GTM
• 8% Net Sales on • Climbing to 12% Net Sales on
marketing/R&D marketing/R&D
34.4%*
-2.1%*
FY14 FY15 FY16 FY17 FY18 FY19 FY20 FY21
Converting Europe to Direct GTM, coupled with increased investment in
marketing/R&D, has resulted in a 36.5% Net Sales CAGR Improvement
* Net Sales and CAGR (Compound Annual Growth) calculations are based on a constant currency rate
23Global Segment Net Sales: BRG*
Business Model: Business Model:
• 8% Net Sales on • Climbing to 12% Net Sales on
marketing/R&D marketing/R&D
14.6%*
3.1%*
FY14 FY15 FY16 FY17 FY18 FY19 FY20 FY21
Changing the business model, coupled with geographic expansion,
has resulted in an 11.6% Net Sales CAGR improvement
* Net Sales and CAGR (Compound Annual Growth) calculations are based on a constant currency rate
24Evolution in New Country Offense
Western Europe*
UK*
Year 1 Year 2 Year 3 Year 4 Year 5 Year 6 Year 7 Year 8
* *
Germany and other direct European countries had greater net sales in their
3rd year than the UK did in its 8th year. Meanwhile, the UK exhibits the same
acceleration pattern from increased investment in Marketing and R&D
* Sales from UK/Germany warehouses to Distributor-led markets excluded from analysis to make a like-for-like comparison. Analysis in constant currency.
25Strategy Driving Geographic Diversification
FY17 Global Product Segment Net Sales FY21 Global Product Segment Net Sales
Total: A$ 470M Total: A$ 984M
24%
26%
57% 50%
17%
26%
APAC EMEA Americas
EMEA + APAC is equal to the Americas Region. Any shortfall in one region can now be covered by
another. EMEA and APAC can cover each other, and EMEA+APAC can cover Americas
26Strategy Assessment
• Migrating to a business model that spends more on marketing
and R&D as a percent of sales is improving the long-term
growth rate of the company across all Theatres
• Geographic expansion is proving to be an impactful lever in
driving top-line growth as well as diversifying revenue,
geographically
• The new approach for entering new geographies significantly
accelerates revenue trajectory
27• FY21 Acceleration Program Execution
• Strategy Assessment & Analysis
• FY22 COVID Snapshot
28FY22 COVID Snapshot
• Expect FY22 to be a transitional year of sorts:
– Countries in various states of vaccine rollout, opening up, with
regional lock downs
– Comping a COVID-driven spike (FY21). Consumers have pent up
savings and economies are growing as they open, but consumers will
begin spending on services
• View from the front lines:
– USD, transactional currency, weakened against all currencies
– Supplier cost increases and parts challenges
– Logistics delays and cost increases
• How lining up against the uncertainties of FY22:
– Long-term strategy unchanged
– Taking price increases where appropriate
– Running tactical high/low approach to FY22 (inventory/costs)
29Breville Group Limited (BRG)
FULL YEAR FY21 RESULTS
Investor Presentation
17th August 2021You can also read