Year-round passive acoustic data reveal spatio-temporal patterns in marine mammal community composition in the Weddell Sea, Antarctica
←
→
Page content transcription
If your browser does not render page correctly, please read the page content below

Vol. 638: 191–206, 2020              MARINE ECOLOGY PROGRESS SERIES
                                                                                                  Published March 19
https://doi.org/10.3354/meps13258                Mar Ecol Prog Ser

                                                                                                  OPEN
                                                                                                  ACCESS

    Year-round passive acoustic data reveal spatio-
   temporal patterns in marine mammal community
      composition in the Weddell Sea, Antarctica
                                    I. Van Opzeeland1, 2,*, H. Hillebrand 2, 3
         1
          Ocean Acoustics Lab, Alfred-Wegener Institute (AWI), Helmholtz Centre for Polar and Marine Research,
                                              27570 Bremerhaven, Germany
        2
         Helmholtz Institute for Functional Marine Biodiversity (HIFMB), Carl von Ossietzky University, Oldenburg,
                                                26129 Oldenburg, Germany
             3
              Plankton Ecology Lab, Institute for Chemistry and Biology of the Marine Environment (ICBM),
                         Carl von Ossietzky University Oldenburg, 26382 Wilhelmshaven, Germany

      ABSTRACT: To date, the majority of studies investigating marine mammal distribution and
      behavior take a single-species perspective, which is often driven by the logistic difficulties of
      collecting appropriate data at sea. Passive acoustic monitoring, provided recording tools exhibit
      sufficient bandwidth, has the potential to provide insights into community structure as devices
      operate autonomously simultaneously collecting data on baleen, pinniped and toothed whale
      acoustic presence. Data can provide information on local species diversity, residency times and
      co-occurrence. Here, we used multi-year passive acoustic data from 6 sites in the Weddell Sea,
      Southern Ocean, to explore how local marine mammal community compositions develop over
      time and in relation to sea-ice. Diversity peaked in austral late spring and early summer, shortly
      before seasonal sea-ice break-up. The effective number of species exhibited little variation over
      time, reflecting that species remain in Antarctic waters throughout austral winter. Community
      composition showed almost complete seasonal overturn, indicating that species replace each
      other throughout the year. For all 6 sites, community dissimilarity increased with increasing tem-
      poral distance, reflecting temporal trends in community composition beyond seasonality. Several
      species exhibited significant positive or negative co-occurrence patterns over time. These sea-
      sonal associations were consistent across all 5 oceanic sites, but partly inversed at the Western
      Antarctic Peninsula recording site. This study shows that the application of biodiversity metrics to
      passive acoustic monitoring data can foster insights into the timing of behaviors and community
      composition, which can boost the interpretation of responses in the light of ongoing environmental
      changes.

      KEY WORDS: Biodiversity change · Species composition · Richness · Passive acoustic monitoring ·
      Marine mammals · Southern Ocean

                 1. INTRODUCTION                               global changes are causing rapid and extreme shifts
                                                               in animal and plant communities across ecosystems
  In many regions of the world, inventory studies              (Sala et al. 2000, Lotze et al. 2006, Sorte et al. 2017).
aiming to understand the role and functioning of               In the marine realm, ecosystems are experiencing a
community composition are facing a race against the            multitude of human pressures, comprising chemical
clock as direct and indirect effects of human-induced          pollution, climate-induced changes (e.g. sea-level
                                                               © The authors 2020. Open Access under Creative Commons by
*Corresponding author: ilse.van.opzeeland@awi.de               Attribution Licence. Use, distribution and reproduction are un-
                                                               restricted. Authors and original publication must be credited.
                                                               Publisher: Inter-Research · www.int-res.com
192                                       Mar Ecol Prog Ser 638: 191–206, 2020

rise, ocean acidification, sea-ice melt), fishing, mar-          Marine mammals dominate large parts of the natu-
ine debris and increasing underwater noise levels             ral acoustic environment in most polar waters and
(Halpern et al. 2015). In many marine regions, these          their sounds are generally well known, in contrast to
stressors have or are expected to have severe con-            many fishes, crustaceans and invertebrates for which
sequences for ecosystem health and biodiversity               information on acoustic behavior is much sparser, if
(Worm et al. 2006, Hillebrand et al. 2018a). Assessing        existent at all. Due to the fact that marine mammals
patterns of richness and composition of marine ani-           are often migratory, apex predators, exhibiting long
mal communities through ecological gradients such             life spans, they integrate ecological variation across
as latitude and depth and over time are of primary            large spatial and temporal scales and have been de-
importance in conservation biology as these can               scribed as sentinels of various marine ecosystems (e.g.
provide important warning signs of environmental              Aguirre & Tabor 2004, Moore & Huntington 2008).
change for management and conservation measures               Monitoring of sentinel species can play an important
to respond to. Fast and reliable methods are required         role in detecting first warning signals and under-
for biodiversity assessments to determine and com-            standing the effects of environmental change for im-
pare species richness patterns that can be applied in         pacted regions (Moore 2008). In contrast to physical
both accessible and remote habitats.                          measurements of the environment, sentinel species,
   Rapid acoustic surveys, relying on acoustic analy-         particularly when studied as part of a(n acoustic) com-
ses of sound produced by animal communities, have             munity, can allow assessment of the integrated re-
proved a fast, reliable and non-invasive method to            sponse of organisms to environmental pertubations
collect information on biological diversity in terres-        (Milnes & Guillette 2008, Templeton et al. 2016).
trial realms (Sueur et al. 2008, Andreassen et al.               Here, we used multi-year passive acoustic record-
2014, Darras et al. 2017). In marine environments,            ings from 6 sites throughout the Antarctic Weddell
passive acoustic methods have become an estab-                Sea, comprising data on acoustic presence from 9 mar-
lished method to acquire information on the occur-            ine mammal species, of which some exhibit migratory
rence and behaviour of sound-producing species                behavior (e.g. fin and Antarctic blue whales) and some
(e.g. Van Parijs et al. 2009). In contrast to visual sight-   are resident species of which at least part of the popu-
ings, passive acoustic data collection in marine              lation is associated with the sea-ice environment year-
underwater environments can occur with autono-                round (e.g. the 4 pinniped species and Antarctic minke
mous recording units that are relatively independent          whales). We applied multiple biodiversity measures to
of weather and light conditions, securing data acqui-         explore trends in marine mammal community compo-
sition on a year-round basis. For polar environments,         sition over various spatial and temporal scales and in
the collection of passive acoustic data offers the most       relation to local sea-ice concentrations.
reliable tool of choice to obtain year-round informa-
tion on species distribution (e.g. Van Opzeeland et al.
2008, 2013b, Van Parijs et al. 2009). Visual sighting                   2. MATERIALS AND METHODS
data on marine mammals in polar waters are season-
ally biased to the summer period as the access of               Passive acoustic records were collected with a suite
ships is often too restricted to carry out surveys dur-       of autonomous passive acoustic recording device
ing winter due to adverse weather and light condi-            types attached to deep-sea moorings of the Hybrid
tions and heavy ice cover in large areas. Auto-               Antarctic Float Observation System (HAFOS; Reeve
nomously operating acoustic recording devices are             et al. 2016); see Table 1 for a summary of recording
deployed year-round throughout the world’s oceans             and deployment specifications for sites 1−6 (Fig. 1).
and, provided sufficient recording bandwidth, have            The sample rate of all recording devices allowed reli-
the potential to provide a wealth of information re-          able identification of baleen whales and pinnipeds,
lating to acoustic communities and local species              but excluded (reliable) identification of all odonto-
compositions. To date, however, most marine passive           cete species except killer whales. In addition to
acoustic studies have taken a single-species perspec-         clicks, killer whales also produce pulsed calls and
tive (most often marine mammals), only rarely con-            whistles, which fell within our recording range and
solidating contextual acoustic data in analyses and           were used for species identification.
interpretation providing information on acoustic                For all passive acoustic data, daily presence infor-
environments, biodiversity or species association             mation for marine mammal species was extracted
patterns (for a review, see Risch & Parks 2017, also          during manual analyses of the data using RAVEN Pro
see Roca & Van Opzeeland 2019).                               1.5 (Bioacoustics Research Program 2019). Spectro-
Van Opzeeland & Hillebrand: Antarctic marine mammal community composition 193
Table 1. Locations and recording parameters of passive acoustic recorders. Recording sites are assigned IDs representing geographic location by a combination of site
Operational
period
(mo)
11
24
37
21
34
8
6
34
12
(dB re. 1V/µPa)
number and a Roman numeral indicating deployment period. Hydrophone sensitivity information is as provided by the manufacturer
PHO@250Hz
hydrophone
Sensitivity
−193
−164
−164
−193
−164
−193
−193
−165
−168
Continuous
Continuous
Continuous
Continuous
(min/min)
Sampling
scheme
4.5/180
5/240
5/240
5/60
6/60
frequency
Sampling
(kHz)
32.77
5.33
32.77
32.77
5.33
32.77
2.00
5.33
5.33
Fig. 1. Map showing the 6 locations (red dots) in the South-
ern Ocean, section Weddell Sea, bordered to the west by the
Deploy-
depth
ment
Western Antarctic Peninsula (WAP), where passive acoustic
958
207
210
934
206
4838
1007
969
189
(m)
records were collected
grams were visually and aurally scanned for vocal-
01/2013−05/2016
12/2012−11/2013
12/2010−01/2013
12/2010−09/2012
03/2008−12/2010
12/2010−06/2011
03/2008−12/2010
12/2008−12/2009
12/2010−08/2011
izations of marine mammals and anthropogenic noise
(mm/yyyy)
Recording
period
(originating from seismic investigations and vessels).
Spectogram settings (Hanning window, overlap:
50%; fast Fourier transform: 512 points for sites 1−5,
16 000 points for site 6, in both cases resulting in a
time resolution of 2 s and a frequency resolution of
0.5 Hz) were kept constant throughout the analysis
AWI232-11_SV1011
AWI209-6_AU0086
AWI232-9_AU0086
AWI230-6_AU0085
AWI251-1_AU0231
AWI227-11_SV002
AWI230-7_SV1001
AWI229-9_SV1000
procedure. Overall, 9 marine mammal species were
Recorder ID
found present, although not all species were present
MARU
at all sites. The marine mammal species that were
acoustically identified in the recordings comprised 4
pinniped species (Weddell seal Leptonychotes wed-
dellii, leopard seal Hydrurga leptonyx, crabeater seal
Lobodon carcinophaga and Ross seal Ommatophoca
000° 06.51’ W
027° 07.31’ W
055° 58.53’ W
000° 02.65’ W
000° 00.18’ E
000° 04.77’ E
000° 03.25’ E
000° 00.17’ E
000° 06.63’ E
rossii) and 5 cetacean species (Antarctic blue whale
Longitude
Balaenoptera musculus intermedia, fin whale Balae-
noptera physalus, Antarctic minke whale Balae-
noptera bonaerensis, killer whale Orcinus orca and
humpback whale Megaptera novaeangliae).
Acoustic signatures were identified to species based
61° 00.88’ S
68° 59.74’ S
68° 59.86’ S
66° 36.70’ S
66° 01.13’ S
66° 01.90’ S
59° 10.03’ S
59° 03.02’ S
63° 59.56’ S
Latitude
on previous work (e.g. Širović et al. 2004, Rankin et
al. 2005, Van Opzeeland 2010, Risch et al. 2014,
Schall & Van Opzeeland 2017).
Given that the data were collected with different
recorders and recording parameters (Table 1), we
Site 4-II
Site 3-II
Site 1-II
Site 5-I
Site 6-I
Site 4-I
Site 2-I
Site 3-I
Site 1-I
Recor-
site ID
used a subset of the data that was recorded at the
ding
same site during the same period, but with 2 different
recorder types to assess the effect of recorder type
194                                      Mar Ecol Prog Ser 638: 191–206, 2020

and recording duty cycle on the daily acoustic pres-         of 6.25 × 6.25 km from the Advanced Microwave
ence assessments. On the level of daily acoustic pres-       Scanning Radiometer for EOS (AMSR-E) satellite
ence, both recorders produced identical data for Ant-        sensor (Spreen et al. 2008). Monthly sea-ice concen-
arctic blue, fin and Antarctic minke whales and Ross         tration values were calculated in a radius of 30 km
seals. For the other species, accordance between both        around each mooring. A 30 km radius was chosen
data sets was > 77% (see Text A1 in the Appendix).           based on a previous conservative detection range es-
                                                             timate for the Weddell Sea for a RAFOS sound source
                                                             (emitting at 260 Hz), an oceanographic instrument
            2.1. Pseudo-abundance data                       (see Spiesecke 2017 for details). Antarctic pinnipeds,
                                                             humpback whales and Antarctic minke whales all
   Our data recorded daily presence and absence for          produce sound in the same frequency range. For
each of the 9 target species, without information on         killer whales, producing sounds at higher frequen-
abundance. However, we were able to calculate a              cies, maximum detection ranges were reported to be
relative abundance using the sum of days in a month          30 km based on studies from other areas (e.g. Burham
on which a species was recorded. A larger population         et al. 2016). For the large baleen whales, detection
size is assumed to lead to more consistent recording,        ranges are known to be larger (i.e. 100 km; Thomisch
hence more days during which the species is rec-             et al. 2016). However, comparison between data from
orded, whereas small populations are more likely to          both radii revealed ice concentration for 30 and
produce lower acoustic presences per month. We               100 km to be highly similar for all 6 sites (Fig. A1). A
used this to calculate the monthly effective number          30 km radius was therefore selected to best fit the
of species (ENS), which has been shown to be the             range over which all species included in the analyses
most robust diversity measure in relation to sampling        were acoustically detected.
effort and rank-abundance distributions (Chase &
Knight 2013). ENS refers to the true species diversity
entailing the number of species in a community if all                     2.3. Species co-occurrences
were equally common. In contrast to raw species
richness, it is mainly influenced by dominant species          The co-occurrence analysis was performed using
and does not reflect the fluctuation of rare species         the R package co-occur (Griffith et al. 2016), which is
around detection limits, which makes it less sensitive       based on the probabilistic model by Veech (2013).
to detection probabilities.                                  This method does not require randomizations, but
   To assess how species richness develops over time,        compares the observed number of co-occurrences of
we used the species exchange ratio (SER; see Hille-          any species pair to the prediction based on the occu-
brand et al. 2018b for equations), which measures the        pancy of each single species.
proportional exchange of species between an earlier
and a later sample in a time series. The richness-based
species exchange ratio SERr is the Jaccard index,                                 3. RESULTS
which is based on presence−absence only and quanti-
fies changes in species identity. The abundance-               All sites showed clear seasonal variation in relative
based SERa is a measure of turnover that also takes          abundance (i.e. the proportion of days a species was
into account changes in species proportional abun-           acoustically present per month) of marine mammal
dances . It is derived from Wishart’s dissimilarity ratio    species (Fig. 2). Furthermore, all sites where record-
(Hillebrand et al. 2018b), which, like ENS, is based on      ing time was >1 yr showed clear seasonal variation in
Simpson’s index of dominance. Both SERr and SERa             the ENS (Fig. 3a). Diversity peaked in austral late
approach 0 if species identity and dominance struc-          spring and early summer, shortly before seasonal
ture do not change, and approach 1 if all species are        sea-ice break-up for sites 3, 4 and 5. ENS was lowest
replaced or shifted in their dominance. SERa reduces         during austral summer, when ice cover was low at
to SERr when all species are equally common.                 these locations. At site 6, ice cover was substantially
                                                             lower throughout the year, reaching maximum con-
                                                             centrations of 40% during austral winter. Diversity
             2.2. Ice concentration data                     nevertheless followed the same cycle as at the sites
                                                             with more extensive sea-ice cover. In austral winter,
 The sea-ice concentration data used for this study          species relative abundance did not decrease below 1,
were extracted from satellite images with a resolution       supporting all-year presence of at least some of the
Van Opzeeland & Hillebrand: Antarctic marine mammal community composition                              195

Fig. 2. Relative abundance of 9 marine mammal species for the 6 recording sites, given as the proportion of days in a month a
species was recorded (1 = all days, 0 = no days). Grey vertical lines indicate the start of each year, times without data points
equal the times without recording at this site. B: Antarctic blue whale; F: fin whale, M: Antarctic minke whale; O: killer whale;
                     H: humpback whale; W: Weddell seal; C: crabeater seal; R: Ross seal; L: leopard seal

study species (Fig. 2). At site 6, species richness was            creases in species richness often occurring during
generally higher, fluctuating between 6 and 3 during               low ice cover periods and prior to sea-ice formation.
austral summer and winter, respectively. At site 4,                   Comparing each pair of time points within a site,
after resuming measurements in 2013 after a 2-yr                   we found clear seasonality in the temporal trends of
pause, we found on average greater species diversity               ENS (Fig. 4a). This seasonal pattern was visible at all
than before.                                                       sites with time series >1 yr, where the change in ENS
  Consequently, the net change in species richness                 was minimal over a time period of 1 yr and maximal
was rather neutral over time (Fig. 3b). The number of              (both increases and decreases) over a time period of
species gained or lost compared to previous sampling               0.5 yr. The longest data sets (sites 3 and 4) showed
points followed a recurring seasonal cycle, with most              accumulating changes in ENS over time, indicating a
increases in species richness occurring when sea-ice               temporal trend, whereas site 6 showed little variation
concentrations started to decline, and peak de-                    over seasons and over years.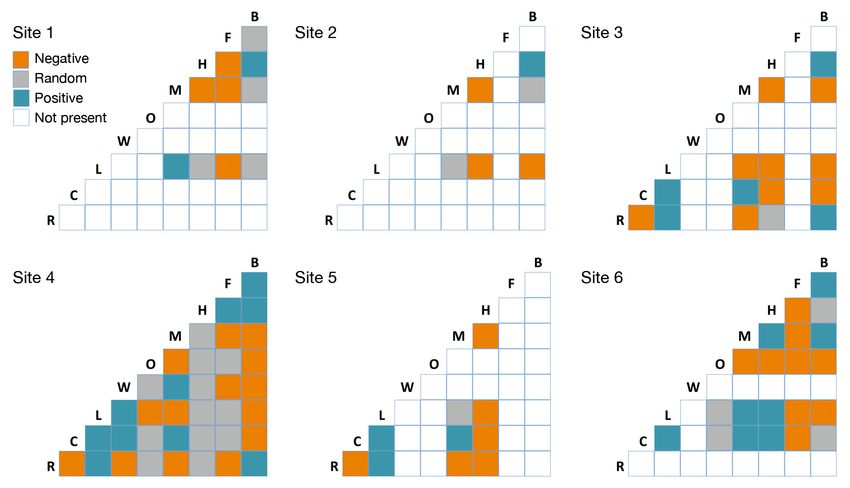
196                                         Mar Ecol Prog Ser 638: 191–206, 2020

Fig. 3. Temporal trends in monthly species diversity for recording sites 1−6 in the Weddell Sea in relation to sea-ice concentra-
tion in a 30 km radius. Light blue shaded areas represent ice concentration in % (right y-axis) and also denote the time frame
of recording at each site. (a) Effective number of species (ENS) over time calculated from relative abundances of all species (as
in Fig. 2) in a given month (black symbols). (b) Changes in species richness for each recording site over time. Data points show
the net change in species richness from any month to the next month (open triangles) and to the same month next year (closed
circles). Net richness change is the difference in species newly recorded in the next month (orange line) or the same month
     next year (red line) and species no longer recorded next month (aquamarine line) or same month next year (blue line)

  Taking species identity into account, the richness-
based species exchange ratio (SER r ; Fig. 4b)                     Fig. 4. Changes in mammal species diversity with increasing
revealed substantial seasonal variability in species               temporal distance. Data points indicate comparison between
                                                                   each time point to each subsequent time point at a site;
composition at all 6 sites and — again for the longest             blue lines indicate a LOESS function (span = 0.25) for visu-
time series — a trend of increasing compositional                  alization. Vertical lines indicate exact yearly distances.
difference over longer time scales (site 4). The pat-              (a) Change in monthly ENS with temporal distance. (b) Rich-
tern became even more evident when relative domi-                  ness-based species exchange ratio (SERr) showing identity
                                                                   turnover with temporal distance. (c) Abundance-based spe-
nance was included in the abundance-based SER a                    cies exchange ratio (SERa) with temporal distance account-
(Fig. 4c). Thus, the change in composition over time               ing for the relative abundances of species, i.e. the pro-
was partly caused by changing dominance in addi-                         portion of days in a month a species was recorded
Van Opzeeland & Hillebrand: Antarctic marine mammal community composition 197
198                                         Mar Ecol Prog Ser 638: 191–206, 2020

tion to changes in species identity, especially at sites          humpback whales as well as humpback whales and
1, 3, 4, and 6. The sites with the longest time series            leopard seals all showed a positive association at the
(sites 3 and 4) exhibited a pattern that is remarkable            Western Antarctic Peninsula (WAP), whereas their
in 3 aspects. First, species turnover between seasons             association was negative or random at the oceanic
is almost complete, i.e. over a time period of 0.5 yr we          recording sites.
observe complete changes in community composi-
tion (dissimilarity = 1). Second, for some years (e.g.
years 1 and 2), the community composition com-                                        4. DISCUSSION
pletely recovers annually, i.e. the same species with
the same dominance structure appeared again (dis-                    The still relatively new research field of ecoa-
similarity = 0). Third, over longer time scales (3 or             coustics (Sueur & Farina 2015), has developed a large
more years), this annual pattern becomes weaker,                  variety of metrics and tools to assess biodiversity
indicating a compositional drift over years, where                from terrestrial acoustic remote sensing data (e.g.
dominance patterns change (Fig. 4c).                              Pijanowski et al. 2011, Sueur et al. 2014). Neverthe-
   Comparing species co-occurrence at each site for               less, successful applications of passive acoustic meth-
all realized pairs (Fig. 5), some of these showed con-            ods to characterize communities and species richness
sistently negative relationships in their acoustic oc-            in aquatic environments have, in some cases, proved
currence: Antarctic minke whales versus Ross seals,               not to be straightforward (e.g. Parks et al. 2014,
killer whales versus Antarctic blue whales, fin versus            Desjonquères et al. 2015, Buxton et al. 2018). Appli-
Antarctic minke whales as well as crabeater vesus                 cation of these metrics to aquatic passive acoustic
Ross seals. Consistently positive relationships existed           data requires re-evaluation of existing metrics and
between leopard and Ross seals as well as between                 potentially developing new approaches before they
leopard and crabeater seals. Some species relation-               can be reliably used for underwater biodiversity as-
ships were reversed when comparing the 5 oceanic                  sessments (see Risch & Parks 2017 for a review, Roca
sites versus site 6: Antarctic minke whales and Ant-              & Van Opzeeland 2019). Here, we applied biodiver-
arctic blue whales, Antarctic minke whales and                    sity metrics normally used for count data to hand-

Fig. 5. Species co-occurrence showing significant negative (orange), positive (blue) and random (grey) associations between
species for each of the 6 sites. White squares indicate that one or both species were not present at this site (hence no inter-
                                     action). For species abbreviations, see legend of Fig. 2
Van Opzeeland & Hillebrand: Antarctic marine mammal community composition 199 browsed audio data to explore spatio-temporal pat- 4.1. Application of biodiversity measures terns in species composition of marine mammals. Although hand-browsing passive acoustic data can Although multi-year passive acoustic data sets be relatively time-consuming, the daily presence from the Southern Ocean are becoming increasingly data used in this study were performed in the context available (see Van Opzeeland et al. 2013b for an of standard data quality checks as part of ongoing overview), information on spatio-temporal patterns work. Hand-browsed data have the advantage that in multi-species acoustic assemblages from this they provide highly reliable information on the pres- region are still relatively rare (Širović et al. 2009, Van ence of vocalizing marine mammals and information Opzeeland et al. 2010). Alongside presenting a first- can be collected for all species simultaneously. Daily time application of biodiversity metrics to marine species presence information suffices to explore mammal passive acoustic monitoring data, the out- large-scale patterns in community composition while comes of the present study represent a unique bird’s still ensuring feasible processing times when using eye perspective on the spatio-temporal dynamics of multi-site and multi-year data. Furthermore, for fu- multi-species acoustic assemblages. At the same ture applications, this combination of methods also time, the analyses of biodiversity change often de- allows inclusion of archived passive acoustic record- pend on active assessments (field observations), ings from which daily presence information can be whereas passive methods add the dimension of col- extracted in retrospect to explore how communities lecting continuous records, which makes the assess- have developed when, for example, composition is ment of species presences much more reliable. compared over even longer time frames. Thereby, the overestimation or underestimation of In this study, we included data from recorders that biodiversity change becomes much less likely. collected data continuously as well as from recorders The assessment of temporal and spatial turnover in that were programmed to record on a duty cycle. De- biodiversity has gained much interest in recent years, pending on vocal behavior of the study species, duty as major synthesis efforts showed that the global cycling recordings can affect the likelihood of detection erosion of biodiversity does not necessarily lead to (Thomisch et al. 2015). Evaluations of a subset of the local species loss, but to accelerated turnover (Dor- data collected by 2 different, but simultaneously recor- nelas et al. 2014, Blowes et al. 2019). Passive acoustic ding devices (see Text A1) showed that duty cycling monitoring data thus open an opportunity for long- affected daily presence for some species, but that ac- term observation, especially as hydrophone net- cordance on daily acoustic presence was still >77% works allow the collection of both spatially and tem- between both devices for all species. Nevertheless, porally highly resolved data. Most time series are care should be taken when using duty cycled record- analysed in isolation, but a recent analysis of plant ings for community studies, as, for example, strong data highlighted that the strongest constraint on tem- diel patterns in vocal activity of a species may strongly poral change in composition can be the lack of spatial affect the detectability and thereby bias acoustic and heterogeneity (Hodapp et al. 2018). species diversity results (Thomisch et al. 2015). A further methodological aspect that may affect the likelihood of detecting calling animals concerns the 4.2. Acoustic presence−absence data underwater ambient noise conditions. Menze et al. (2017) showed for the Weddell Sea that with increasing When using passive acoustic data to derive species sea-ice concentration, area and thickness, sound levels presence information, it is important to keep in mind decreased while the contribution of distant sources in- that the information is restricted to acoustic pres- creased. For future applications, the vocalizations that ences. In the situation where an animal is physically exceed a certain amplitude threshold could be in- present, but not producing sound, it will be logged cluded in analyses, thereby automatically ‘filtering’ to as acoustically absent. The representativeness of include only the calls from animals within a certain ra- acoustic presence for physical presence therefore is dius of the recorder that are less susceptible to mas- strongly dependent on the likelihood of an animal king by fluctuations in environmental sound levels. producing sound, and physical and acoustic pres- This approach would have the additional advantage ence should not, by definition, be assumed equal. that data are more likely to represent ‘actual acoustic Some species are known to produce sound virtually communities’, i.e. species that are likely to acoustically year-round (e.g. Weddell seals: Van Opzeeland et al. interact as they occur within each other’s acoustic 2010; Antarctic blue whales: Thomisch et al. 2016), space (Van Opzeeland & Boebel 2018). whereas for other species, acoustic activity is re-
200                                       Mar Ecol Prog Ser 638: 191–206, 2020

stricted to the breeding season (see Van Parijs 2003          (Rogers 2003). The absence of 3 of the Antarctic mys-
for a review). For these species, patterns in species         ticete species in the recordings is likely explained by
richness, to a large part, reflect the seasonal fluctua-      their distribution, which does not extend as far south
tions in reproductive activity, not excluding that the        as the other species, making acoustic detections of
species remains present (but is silent) in the area           these species less likely at the positions where data
beyond the breeding season (e.g. Ross seals). For             were collected during this study (e.g. Boyd 2002, Gill
other species, acoustic presence or absence reflects          & Evans 2002).
migratory movements, i.e. the absence of sounds re-
flects ‘true’ absences, albeit periodic (e.g. fin whales,
killer whales). Furthermore, the likelihood of a spe-                            4.3.2. Spatial patterns
cies to produce sound may also depend on local fac-
tors such as foraging conditions, habitat type and               Species diversity was largest at sites 4 and 6 (9 and
behavioral state, and may therefore also differ               7 species present, respectively). Of the 6 sites, sites 4
between sites.                                                and 6 are closest to shore. Recordings from PALAOA,
   In spite of the above-mentioned caution that needs         a shelf-ice-based passive acoustic observatory
to be taken when interpreting the acoustic pres-              (70° 31’ S, 8° 13’ W; Boebel et al. 2006), also revealed a
ence−absence data, the current approach allows a              similarly high species richness (10 species; Van Op-
new perspective on the dynamics of acoustic commu-            zeeland 2010). These relatively high local species
nities over time and between localities. This in turn,        diversities at sites in proximity to shore may be
allows addressing ecological and conservation ques-           explained by the regular occurrence of open water or
tions on the community level which hitherto has been          polynyas (i.e. areas with open water within ice cover;
little studied in marine mammals. In the light of             Wendler et al. 1997) caused by catabatic and west-
ongoing environmental changes occurring virtually             erly winds pushing the ice in northern directions.
worldwide, an improved understanding of the shifts            Polynyas provide food resources year-round and per-
and irregularities in the timing of behaviors and com-        sistent open water, where marine mammals can sur-
munity composition can boost interpretation of res-           face to breathe (Malpress et al. 2017). For site 6, off
ponses to changing environmental processes.                   the WAP, ice cover is less persistent and the presence
                                                              of polynyas may therefore not be as significant for
                                                              marine mammals as at other sites. The area off the
         4.3. Species richness and diversity                  WAP is known to be biologically rich due to unique
                                                              physical forcing mechanisms (i.e. local upwelling of
                4.3.1. Overall patterns                       the Upper Circumpolar Deep Water; Prézelin et al.
                                                              2004) enhancing primary production and thereby
   A total number of 9 marine mammal species were             supporting a persistent and large standing stock of
identified in the passive acoustic data sets included         Antarctic krill Euphausia superba (Siegel et al. 1998,
in this study. This comprises 45% of the total species        Lascara et al. 1999). Large populations of marine top
richness known to occur in Antarctic waters (i.e.             predators are known to depend entirely or to a large
Southern Ocean, > 60° S), where 6 pinniped, 7 mys-            extent on Antarctic krill as a food source (Costa &
ticete and 7 odontocete species are known to occur            Crocker 1996, Fraser & Trivelpiece 1996). The rela-
(e.g. Boyd 2002, Gill & Evans 2002). It is important to       tively persistent and reliable local availability of food
acknowledge that the limited bandwidth of the                 sources in this area and other areas off the WAP has
recordings (i.e. 5 and 16 kHz for the SonoVault and           also been related to the occurrence of cetacean
the AURAL, respectively) only allowed inclusion of            super-aggregations (Nowacek et al. 2011, Burkhardt
only one of the odontocete species (killer whale), as         & Lanfredi 2012) and may furthermore explain the
reliable species identification in the higher frequen-        comparably large species diversity, also outside the
cy bands — where many of the odontocetes produce              austral summer season, observed here. It cannot be
sounds — was not possible. Furthermore, of the 6 pin-         excluded that these different ecological conditions
niped species, only the 4 species identified here ex-         off the WAP also result in differences in vocal behav-
hibit an aquatic mating system and produce under-             ior of species, e.g. resulting in greater acoustic pres-
water sounds (see Van Parijs 2003 for a review). The          ence of species than at other sites. However, compar-
other 2 species, southern elephant seals Mirounga             isons of community data over time within this site will
leonina and Antarctic fur seals Arctocephalus gazel-          not suffer from this potential bias, and it may be of
la, breed on land and produce sound in air only               particular interest to monitor trends over time in light
Van Opzeeland & Hillebrand: Antarctic marine mammal community composition 201
of the rapid climate-induced changes in the WAP Species richness dropped substantially at all sites
area (e.g. Gutt et al. 2015). during austral winter, but never dropped below 1.
When species identity and dominance were taken
into account, complete species turnover was ob-
4.3.3. Seasonal patterns served followed by full annual compositional recov-
ery. This full community replacement is remarkable
Community composition dynamics followed a high- and stronger than that observed for other organism
ly similar seasonal cycle, coupled with the sea-ice groups at temperate or even lower latitudes (see e.g.
concentration, virtually independent of the spatial Hillebrand et al. 2018b). We propose that this turn-
distance between recording sites. Despite local dif- over reflects the very strong seasonal fluctuation in
ferences in (acoustic) abundance of species, commu- environmental conditions in polar regions. Antarctic
nity composition was highly similar between even minke whales, for example, exhibited an almost
the most distant site pairs. This observation tenta- opposite seasonal pattern in acoustic presence com-
tively suggests that at the level of top predators, the pared to the other species, producing sounds almost
Weddell Sea may be regarded as one ecoregion, exclusively during austral winter (Dominello & Širo-
comprising similar environmental conditions (e.g. vić 2016). This ice-adapted species has a strong ros-
Bailey 2004) and an assemblage of species that is trum with which it is known to create its own breath-
similar within the ecoregion but different from sur- ing holes in ice-covered areas (Leatherwood et al.
rounding ecoregions. 1981). This adaptation likely enables the species to
Species richness exhibited a strong seasonal pattern exploit under-ice krill resources during winter that
and generally peaked at all sites in late austral spring are not available to other species (Williams et al.
and early summer, shortly before sea-ice break-up. 2015). At some sites, dissimilarities in richness and
This period coincides with the mating period of the 4 composition between seasons were not that extreme,
ice-breeding pinniped species, during which species- e.g. caused by the presence of polynyas, creating
specific peaks in calling activity are known to occur persistent areas with open water throughout winter.
(Van Opzeeland et al. 2010), and hence these species This also supports the findings of previous studies
acoustically dominate the recordings in this period. that certain species are pervasively present in Antarc-
Furthermore, for humpback, fin and Antarctic blue tic waters (e.g. humpback whales: Van Opzeeland et
whales, their spring/summer acoustic presence at the al. 2013a; Antarctic blue whales: Thomisch et al.
recording sites reflects animals migrating southbound 2016).
from their respective breeding areas towards the At site 6, the number of species did not drop below
Antarctic continent in the course of austral summer, 3 for the majority of the time, and Antarctic blue, fin
following the highly productive marginal ice-edge and killer whales remained acoustically present
zone associated with the receding sea-ice edge (Feb− throughout the year. The latter 2 species exhibited
Mar; Bombosch et al. 2014, Thomisch et al. 2016). The atypical seasonal patterns when site 6 was compared
tight connection between the timing of sea-ice break- to the other recording locations. For fin whales, the
up and peak species diversity most likely reflects the area off the WAP close to the recording location, as
increased light availability in the water column, mentioned earlier, is known for its annually reoccur-
which results in a bloom of pelagic phytoplankton, at- ring large fin whale feeding aggregations, most
tracting large grazing populations that are in turn tar- likely due the exceptional productivity of this area
geted by baleen whales and Ross, leopard and (Prézelin et al. 2004, Burkhardt & Lanfredi 2012).
crabeater seals. The purpose of the sounds produced For killer whales, the aberrant pattern in occur-
by marine mammal species on their Antarctic feeding rence at site 6 (Fig. 2) possibly reflects ecological dif-
grounds and during migration is poorly known. Given ferences at this site, such as the fact that sea-ice
that part of the vocalizations is known to play a role in cover is lower here compared to the oceanic sites. In
breeding contexts, calling has been suggested to be killer whales, different ecotypes are known to occur
related to en-route opportunistic mating between in the Southern Ocean (types A, B, C and D: Pitman
(non-dominant) males and females that failed to con- & Ensor 2003, Pitman et al. 2011), each with type-
ceive on the breeding grounds (e.g. Clapham 1996, specific morphology, feeding strategies and distribu-
Thomisch et al. 2016). Other sounds may be produced tion. Type Bs are thought to occur mainly off the
in social contexts or function to coordinate foraging WAP, whereas type Cs have mainly been observed in
behavior among conspecifics (Rekdahl et al. 2015, pack-ice areas and off the Antarctic continent (Pit-
Lewis et al. 2018). man & Ensor 2003). In northern hemisphere killer202 Mar Ecol Prog Ser 638: 191–206, 2020
whale populations, differences in dietary specaliza- the WAP, target the same regions (Siniff & Bengtson
tions between different killer whale ecotypes are 1977, Lowry et al. 1988).
known to have led to behavioral specializations, In this study, fin and Antarctic minke whales were
leading to substantial differences in acoustic behav- consistently negatively associated in occurrence.
ior as well (Deecke et al. 2011, Riesch et al. 2012). Santora et al. (2010) found both species foraging on
Although for Southern Ocean populations, data on Antarctic krill alongside humpback whales off the
ecotype-specific acoustic behavior to date are too WAP in January and showed that all 3 baleen whale
limited for such conclusions (see Schall & Van Op- species co-occurred, targeting different krill sizes,
zeeland 2017), it cannot be excluded that the ob- indicative of resource partitioning between species.
served patterns may be explained by diverging The negative co-occurrence pattern observed here
ecotype-specific behavior between the recording based on the passive acoustic data is likely the conse-
sites. quence of the strong seasonality in Antarctic minke
whale sound production, occurring exclusively be-
tween April and December (Van Opzeeland 2010).
4.4. Species co-occurrence Instead, the negative association between fin and
Antarctic minke whales found in this study possibly
The co-occurrence analysis revealed a number of reflects contrasting habitat preferences during the
consistently positive and consistently negative asso- time both species are vocally active; opposite to
ciations in the occurrence of species across sites. Antarctic minke whales, fin whales are known to
Interestingly, for some species pairs, the relationship avoid ice-covered areas (Širović et al. 2004, Williams
was reversed at the WAP when compared to the et al. 2015).
other sites. Another species pair that was consistently nega-
Part of the association patterns can likely be attrib- tively associated was Antarctic blue whales and kil-
uted to persistent coincidences or discordances in the ler whales. Predatory interactions with killer whales
timing of acoustic behavior. The consistently positive have been documented for blue whales (see Ford &
association between Ross and leopard seals is likely Reeves 2008). Mammal-eating killer whales are the
attributed to the overlap in timing of acoustic behav- only known natural predator of baleen whales. Al-
ior (Van Opzeeland et al. 2010), which persistently though not all killer whale ecotypes occurring in
follows the same pattern across all study sites where Antarctic waters eat mammals, blue whales may
both species are present. Similarly, the consistently nevertheless associate killer whale calls in general
negative association in the occurrence of Antarctic with predation threat and avoid areas where killer
minke whales and Ross seals as well as between whales are present or remain silent in their presence
crabeater and Ross seals is a consequence of the (Tyack et al. 2011).
strong seasonality in the respective acoustic activity Lastly, 3 species pairs exhibited a positive associa-
of these species, precluding the occurrence of tempo- tion in occurrence only at the recording site off the
ral acoustic overlap. WAP. The fact that more species are found to co-
The positive association between leopard and occur off the WAP compared to other sites may also
crabeater seals across sites potentially reflects the reflect that the higher abundance of prey off the
predator−prey relationship between the 2 species. WAP attracts, alongside regular open-water species
Leopard seals are generalist apex predators capable such as humpback whales, ice-adapted species such
of adjusting their foraging behavior to available food as leopard seals and Antarctic minke whales.
sources (Siniff & Stone 1985, Lowry et al. 1988, Ca- Through behavioral plasticity, some of these ice-
saux et al. 2009). Preferred prey differs between sea- associated species may adapt behavior to effectively
sons and regions, but is known to seasonally also exploit food resources in the absence of ice. For
include weaned crabeater seal pups (Gilbert & Erick- example, the leopard seal summer population off the
son 1977). The consistently positive association in WAP is known to seasonally haul out on land (instead
leopard and crabeater seal acoustic occurrence of on ice, as observed for all other leopard seal popu-
across sites suggests that leopard seals may antici- lations) and also differs in aspects of their diving
pate their presence to coincide with the period dur- behavior, thought to reflect their krill foraging spe-
ing which most crabeater seal pups are weaned. A cialization off the WAP (Hall-Aspland & Rogers 2004,
further association between the 2 species may be Krause et al. 2015). Similarly, Antarctic minke and
based on the fact that both forage on the same size of humpback whales exhibited a positive association in
Antarctic krill and may therefore in some areas, e.g. occurrence only at the recording site off the WAP, butVan Opzeeland & Hillebrand: Antarctic marine mammal community composition 203
did not exhibit an association in their distribution LITERATURE CITED
based on acoustic data from the other sites or circum-
Aguirre AA, Tabor GM (2004) Introduction: marine verte-
antarctic sightings data (Kasamatsu et al. 2000). brates as sentinels of marine ecosystem health. Eco-
However, several smaller-scale visual surveys also Health 1:236−238
found both species to occur sympatrically off the Andreassen T, Surlykke A, Hallam J (2014) Semi-automatic
WAP, both foraging on Antarctic krill (Thiele et al. long-term acoustic surveying: A case study with bats.
Ecol Inform 21:13−24
2004, Friedlaender et al. 2006). Possibly to overcome
Bailey RG (2004) Identifying ecoregion boundaries. Environ
interference competition, both species were found to Manage 34:S14−S26
exploit krill layers at different depth regimes, there- Blowes SA, Supp SR, Antão LH, Bates A and others (2019)
by vertically partioning food resources (Friedlaender The geography of biodiversity change in marine and ter-
restrial assemblages. Science 366:339−345
et al. 2009). The fact that the marine mammal assem-
Boebel O, Kindermann L, Klinck H, Bornemann H and oth-
blage off the WAP is comparatively somewhat larger ers (2006) Real-time underwater sounds from the South-
and differently composed compared to the other sites ern Ocean. Eos 87:361
is therefore most likely explained by the higher local Bombosch A, Zitterbart DP, Van Opzeeland I, Frickenhaus
krill abundances at this site. S, Burkhardt E, Wisz MS, Boebel O (2014) Predictive
habitat modelling of humpback (Megaptera novae-
angliae) and Antarctic minke (Balaenoptera bonaeren-
sis) whales in the Southern Ocean as a planning tool for
4.5. Outlook seismic surveys. Deep Sea Res I 91:101−114
Boyd IL (2002) Antarctic marine mammals. In: Perrin WF,
Würsig B, Thewissen JGM (eds) Encyclopedia of marine
The present study has shown how a combination of
mammals. Academic Press, San Diego, CA, p 30−36
methods allows monitoring marine mammal commu- Burham RE, Palm RS, Duffus DA, Mouy X, Riera A (2016)
nities, including information on co-occurrences and The combined use of visual and acoustic data collection
potential implications for their interactions. By ex- techniques for winter killer whale (Orcinus orca) obser-
tending this to more recent and, where available, vations. Glob Ecol Conserv 8:24−30
Burkhardt E, Lanfredi C (2012) Fall feeding aggregations of
archived recordings, long-term trends in marine fin whales off Elephant Island (Antarctica). Paper SC/
mammal seasonal behavior, space use and composi- 64/SH9 presented to the IWC Scientific Committee
tion of multi-species assemblages can be explored. Buxton RT, McKenna MF, Clapp M, Meyer E and others
For many basins, long-term passive acoustic data are (2018) Efficacy of extracting indices from large-scale
acoustic recordings to monitor biodiversity. Conserv Biol
meanwhile available, allowing analyses over time 32:1174−1184
scales of a decade or more. Furthermore, including Casaux R, Baroni A, Ramón A, Carlini A, Bertolin M,
information from other sound-producing species, DiPrinzio CJ (2009) Diet of the leopard seal Hydrurga
such as fish and invertebrates, as well as environ- leptonyx at the Danco Coast, Antarctic Peninsula. Polar
Biol 32:307−310
mental sound (e.g. anthropogenic noise), can provide
Chase JM, Knight TM (2013) Scale-dependent effect sizes of
further (year-round) contextual information on the ecological drivers on biodiversity: why standardised
ecological and acoustic quality of underwater marine sampling is not enough. Ecol Lett 16:17−26
habitats. In light of ongoing environmental changes, Clapham PJ (1996) The social and reproductive biology of
the potential of passive acoustic surveys and acoustic humpback whales: an ecological perspective. Mammal
Rev 26:27−49
indices in the context of biodiversity and habitat Costa DP, Crocker DE (1996) Marine mammals of the South-
quality monitoring is still heavily underexploited ern Ocean. Found Ecol Res West Antarctic Peninsula 70:
(Sueur et al. 2019). Particularly for the marine realm, 287−301
these methods represent a source of untapped and Darras K, Batáry P, Furnas B, Celis-Murillo A, Van Wilgen-
burg SL, Mulyani YA, Tscharntke T (2018) Comparing
hidden potential to become vital players for efficient
the sampling performance of sound recorders versus
large-scale environmental monitoring of the Earth’s point counts in bird surveys: a meta-analysis. J Appl Ecol
natural soundscapes. 55:2575–2586
Deecke VB, Nykänen M, Foote AD, Janik VM (2011) Vocal
Acknowledgements. We thank Olaf Boebel for coordinating behaviour and feeding ecology of killer whales Orcinus
the HAFOS observatory and its maintenance. We also thank orca around Shetland, UK. Aquat Biol 13:79−88
the crews of RV Polarstern expeditions ANT-XXV/2, ANT- Desjonquères C, Rybak F, Depraetere M, Gasc A, Le Viol I,
XXIV/3, ANT-XXVII/2 and ANT-XXIX/2, and the mooring Pavoine S, Sueur J (2015) First description of underwater
team of the AWI’s physical oceanography department for the acoustic diversity in three temperate ponds. PeerJ 3:e1393
deployment and recovery of the acoustic recorders. We Dominello T, Širović A (2016) Seasonality of Antarctic minke
thank Stefanie Spiesecke for managing and cleaning the whale (Balaenoptera bonaerensis) calls off the Western
data, and Karolin Thomisch, Diego Filun, Rike Vooth, Antarctic Peninsula. Mar Mamm Sci 32:826−838
Ramona Matmueller and Malene Meister for manual anno- Dornelas M, Gotelli NJ, McGill B, Shimadzu H, Moyes F,
tation of the passive acoustic data sets included in this study. Sievers C, Magurran AE (2014) Assemblage time series204 Mar Ecol Prog Ser 638: 191–206, 2020 reveal biodiversity change but not systematic loss. others (2018) Context-dependent variability in blue Science 344:296−299 whale acoustic behaviour. R Soc Open Sci 5:180241 Ford JKB, Reeves RR (2008) Fight or flight: antipredator Lotze HK, Lenihan HS, Bourque BJ, Bradbury RH and others strategies of baleen whales. Mammal Rev 38:50−86 (2006) Depletion, degradation, and recovery potential of Fraser WR, Trivelpiece WZ (1996) Factors controlling the estuaries and coastal seas. Science 312:1806−1809 distribution of seabirds: winter−summer heterogeneity in Lowry LF, Testa JW, Calvert W (1988) Notes on winter feed- the distribution of Adélie penguin populations. Found ing of crabeater and leopard seals near the Antarctic Ecol Res West Antarctic Peninsula 70:257−272 Peninsula. Polar Biol 8:475−478 Friedlaender AS, Halpin PN, Qian SS, Lawson GL, Wiebe Malpress V, Bestley S, Corney S, Welsford D, Labrousse S, PH, Thiele D, Read AJ (2006) Whale distribution in re- Sumner M, Hindell M (2017) Bio-physical characterisa- lation to prey abundance and oceanographic processes tion of polynyas as a key foraging habitat for juvenile in shelf waters of the Western Antarctic Peninsula. Mar male southern elephant seals (Mirounga leonina) in Ecol Prog Ser 317:297−310 Prydz Bay, East Antarctica. PLOS ONE 12:e0184536 Friedlaender AS, Lawson GL, Halpin PN (2009) Evidence of Menze S, Zitterbart DP, Van Opzeeland I, Boebel O (2017) resource partitioning between humpback and minke The influence of sea ice, wind speed and marine mam- whales around the Western Antarctic Peninsula. Mar mals on Southern Ocean ambient sound. R Soc Open Sci Mamm Sci 25:402−415 4:160370 Gilbert JR, Erickson AW (1977) Distribution and abundance Milnes MR, Guillette LJ Jr (2008) Alligator tales: new les- of seals in the pack ice of the Pacific Sector of the sons about environmental contaminants from a sentinel Southern Ocean. Adaptations within Antarctic eco- species. Bioscience 58:1027−1036 systems. Smithsonian Institution, Washington, DC, Moore SE (2008) Marine mammals as ecosystem sentinels. p 703–740 J Mammal 89:534−540 Gill A, Evans PGH (2002) Marine mammals of the Antarctic Moore SE, Huntington HP (2008) Arctic marine mammals in relation to hydro-acoustic activities. Study on behalf of and climate change: impacts and resilience. Ecol Appl the German Federal Agency for Nature Conservation 18:S157−S165 (BfN), Oxford Nowacek DP, Friedlaender AS, Halpin PN, Hazen EL and Griffith DM, Veech JA, Marsh CJ (2016) cooccur: Probabilis- others (2011) Super-aggregations of krill and humpback tic Species Co-Occurrence Analysis in R. J Stat Soft 69: whales in Wilhelmina Bay, Antarctic Peninsula. PLOS 1−17 ONE 6:e19173 Gutt J, Bertler N, Bracegirdle TJ, Buschmann A and others Parks SE, Miksis-Olds JL, Denes SL (2014) Assessing marine (2015) The Southern Ocean ecosystem under multiple ecosystem acoustic diversity across ocean basins. Ecol climate change stresses — an integrated circumpolar as- Inform 21:81−88 sessment. Glob Change Biol 21:1434−1453 Pijanowski BC, Farina A, Gage SH, Dumyahn SL, Krause BL Hall-Aspland SA, Rogers TL (2004) Summer diet of leopard (2011) What is soundscape ecology? An introduction and seals (Hydrurga leptonyx) in Prydz Bay, Eastern Ant- overview of an emerging new science. Landsc Ecol 26: arctica. Polar Biol 27:729−734 1213−1232 Halpern BS, Frazier M, Potapenko J, Casey KS and others Pitman RL, Ensor P (2003) Three forms of killer whales (Or- (2015) Spatial and temporal changes in cumulative hu- cinus orca) in Antarctic waters. J Cetacean Res Manag 5: man impacts on the world’s ocean. Nat Commun 6:7615 131−140 Hillebrand H, Brey T, Gutt J, Hagen W, Metfies K, Meyer B, Pitman RL, Durban JW, Greenfelder M, Guinet C and others Lewandowska A (2018a) Climate change: warming im- (2011) Observations of a distinctive morphotype of killer pacts on marine biodiversity. Handbook on Marine Envi- whale (Orcinus orca), type D, from subantarctic waters. ronment Protection. Springer, Cham Polar Biol 34:303−306 Hillebrand H, Blasius B, Borer ET, Chase JM and others Prézelin BB, Hofmann EE, Moline M, Klinck JM (2004) (2018b) Biodiversity change is uncoupled from species Physical forcing of phytoplankton community structure richness trends: consequences for conservation and mon- and primary production in continental shelf waters of the itoring. J Appl Ecol 55:169−184 Western Antarctic Peninsula. J Mar Res 62:419−460 Hodapp D, Borer ET, Harpole WS, Lind ME and others Rankin S, Ljungblad D, Clark C, Kato H (2005) Vocalizations (2018) Spatial heterogeneity in species composition of Antarctic blue whales, Balaenoptera musculus inter- constrains plant community responses to herbivory and media, recorded during the 2001/2002 and 2002/2003 fertilisation. Ecol Lett 21:1364−1371 IWC/SOWER circumpolar cruises, Area V, Antarctica. Kasamatsu F, Matsuoka K, Hakamada T (2000) Interspecific J Cetacean Res Manag 7:13−20 relationship in density among the whale community in Reeve KA, Boebel O, Kanzow T, Strass V, Rohardt G, Fahr- the Antarctic. Polar Biol 23:466−473 bach E (2016) A gridded data set of upper-ocean hydro- Krause DJ, Goebel ME, Marshall GJ, Abernathy K (2015) graphic properties in the Weddell Gyre obtained by Novel foraging strategies observed in a growing leopard objective mapping of Argo float measurements. Earth seal (Hydrurga leptonyx) population at Livingston Is- Syst Sci Data 8:15−40 land, Antarctic Peninsula. Anim Biotelem 3:24 Rekdahl ML, Dunlop RA, Goldizen AW, Garland EC, Bias- Lascara CM, Hofmann EE, Ross RM, Quetin LB (1999) Sea- soni N, Miller P, Noad MJ (2015) Non-song social call sonal variability in the distribution of Antarctic krill, bouts of migrating humpback whales. J Acoust Soc Am Euphausia superba, west of the Antarctic Peninsula. 137:3042−3053 Deep Sea Res I 46:951−984 Riesch R, Barrett-Lennard LG, Ellis GM, Ford JK, Deecke Leatherwood S, Thomas JA, Awbrey FT (1981) Minke VB (2012) Cultural traditions and the evolution of repro- whales off northwestern Ross Island. Antarct J US 16:154 ductive isolation: ecological speciation in killer whales? Lewis LA, Calambokidis J, Stimpert AK, Fahlbusch J and Biol J Linn Soc 106:1−17
Van Opzeeland & Hillebrand: Antarctic marine mammal community composition                          205

Risch D, Parks S (2017) Biodiversity assessment and envi-       Sueur J, Krause B, Farina A (2019) Climate change is break-
   ronmental monitoring in freshwater and marine biomes            ing Earth’s beat. Trends Ecol Evol 34:971−973
   using ecoacoustics. In: Farina A, Gage SH (eds) Eco-         Templeton CN, Zollinger SA, Brumm H (2016) Traffic noise
   acoustics: the ecological role of sounds. John Wiley &          drowns out great tit alarm calls. Curr Biol 26:R1173−
   Sons, Oxford, p 145–168                                         R1174
Risch D, Gales NJ, Gedamke J, Kindermann L and others           Thiele D, Chester ET, Moore SE, Širović A, Hildebrand JA,
   (2014) Mysterious bio-duck sound attributed to the Ant-         Friedlaender AS (2004) Seasonal variability in whale en-
   arctic minke whale (Balaenoptera bonaerensis). Biol Lett        counters in the Western Antarctic Peninsula. Deep Sea
   10:20140175                                                     Res II 51:2311−2325
Roca IT, Van Opzeeland IC (2019) Using acoustic metrics         Thomisch K, Boebel O, Zitterbart DP, Samaran F, Van Parijs
   to characterize underwater acoustic biodiversity in the         S, Van Opzeeland I (2015) Effects of subsampling of pas-
   Southern Ocean. Remote Sens Ecol Conserv, doi:10.1002/          sive acoustic recordings on acoustic metrics. J Acoust Soc
   rse2.129                                                        Am 138:267−278
Rogers TL (2003) Factors influencing the acoustic behaviour     Thomisch K, Boebel O, Clark CW, Hagen W, Spiesecke S,
   of male phocid seals. Aquat Mamm 29:247−260                     Zitterbart DP, Van Opzeeland I (2016) Spatio-temporal
Sala OE, Chapin FS III, Armesto JJ, Berlow E and others            patterns in acoustic presence and distribution of Antarc-
   (2000) Global biodiversity scenarios for the year 2100.         tic blue whales Balaenoptera musculus intermedia in the
   Science 287:1770−1774                                           Weddell Sea. Endang Species Res 30:239−253
Santora JA, Reiss CS, Loeb VJ, Veit RR (2010) Spatial asso-     Tyack PL, Zimmer WMX, Moretti D, Southall BL and others
   ciation between hotspots of baleen whales and demo-             (2011) Beaked whales respond to simulated and actual
   graphic patterns of Antarctic krill Eupahusia superba           navy sonar. PLOS ONE 6:e17009
   suggests size-dependent predation. Mar Ecol Prog Ser         Van Opzeeland IC (2010) Acoustic ecology of marine mam-
   405:255−269                                                     mals in polar oceans. Berichte zur Polar-und Meeres-
Schall E, Van Opzeeland I (2017) Calls produced by Ecotype         forschung (Reports on Polar and Marine Research) 619.
   C killer whales (Orcinus orca) off the Eckström Iceshelf,       Alfred-Wegener Institute, Helmholtz Centre for Polar
   Antarctica. Aquat Mamm 43:117−126                               and Marine Research (AWI), Bremerhaven
Siegel V, Loeb V, Gröger J (1998) Krill (Euphausia superba)     Van Opzeeland I, Boebel O (2018) Marine soundscape
   density, proportional and absolute recruitment and bio-         planning: seeking acoustic niches for anthropogenic
   mass in the Elephant Island region (Antarctic Peninsula)        sound. J Ecoacoustics 2:5GSNT
   during the period 1997 to 1997. Polar Biol 19:393−398        Van Opzeeland I, Kindermann L, Boebel O, Van Parijs SM
Siniff DB, Bengtson JL (1977) Observations and hypotheses          (2008) Insights into the acoustic behaviour of polar pin-
   concerning the interactions among crabeater seals, leop-        nipeds: current knowledge and emerging techniques of
   ard seals and killer whales. J Mammal 58:414−416                study. In: Weber EA, Krause LH (eds) Animal behaviour:
Siniff DB, Stone S (1985) The role of the leopard seal in the      new research. Nova Science Publishers, New York, NY
   tropho-dynamics of the Antarctic marine ecosystem. In:       Van Opzeeland I, Van Parijs S, Bornemann H, Frickenhaus
   Siegfried WR, Condy PR, Laws RM (eds) Antarctic nutri-          S and others (2010) Acoustic ecology of Antarctic pin-
   ent cycles and food webs. Springer, Berlin, p 555–560           nipeds. Mar Ecol Prog Ser 414:267−291
Širović A, Hildebrand JA, Wiggins SM, McDonald MA,             Van Opzeeland I, Van Parijs S, Kindermann L, Burkhardt E,
   Moore SE, Thiele D (2004) Seasonality of blue and fin           Boebel O (2013a) Calling in the cold: pervasive acoustic
   whale calls and the influence of sea ice in the Western         presence of humpback whales (Megaptera novaean-
   Antarctic Peninsula. Deep Sea Res II 51:2327−2344               gliae) in Antarctic coastal waters. PLOS ONE 8:e73007
Širović A, Hildebrand JA, Wiggins SM, Thiele D (2009) Blue     Van Opzeeland IC, Samaran F, Stafford KM, Findlay K,
   and fin whale acoustic presence around Antarctica dur-          Gedamke J, Harris D, Miller BS (2013b) Towards collec-
   ing 2003 and 2004. Mar Mamm Sci 25:125−136                      tive circum-antarctic passive acoustic monitoring: the
Sorte CJB, Davidson VE, Franklin MC, Benes KM and oth-             southern ocean hydrophone network (SOHN). Polar-
   ers (2017) Long-term declines in an intertidal foundation       forschung 83:47−61
   species parallel shifts in community composition. Glob       Van Parijs S (2003) Aquatic mating in pinnipeds — a review.
   Change Biol 23:341−352                                          Aquat Mamm 29:214–226
Spiesecke S (2017) Analysis and modeling of RAFOS signal        Van Parijs SM, Clark CW, Sousa-Lima RS, Parks SE, Rankin
   propagation under the Antarctic sea-ice for positioning         S, Risch D, Van Opzeeland IC (2009) Management and
   Argo floats. MSc thesis, Bremen University of Applied           research applications of real-time and archival passive
   Science                                                         acoustic sensors over varying temporal and spatial
Spreen G, Kaleschke L, Heygster G (2008) Sea ice remote            scales. Mar Ecol Prog Ser 395:21−36
   sensing using AMSR-E 89-GHz channels. J Geophys Res          Veech JA (2013) A probabilistic model for analysing species
   Oceans 113:C2S03                                                co-occurrence. Glob Ecol Biogeogr 22:252−260
Sueur J, Farina A (2015) Ecoacoustics: the ecological inves-    Wendler G, Gilmore D, Curtis J (1997) On the formation of
   tigation and interpretation of environmental sound.             coastal polynyas in the area of Commonwealth Bay, East-
   Biosemiotics 8:493−502                                          ern Antarctica. Atmos Res 45:55−75
Sueur J, Pavoine S, Hamerlynck O, Duvail S (2008) Rapid         Williams R, Kelly N, Boebel O, Friedlaender AS and others
   acoustic survey for biodiversity appraisal. PLOS ONE 3:         (2015) Counting whales in a challenging, changing envi-
   e4065                                                           ronment. Sci Rep 4:4170
Sueur J, Farina A, Gasc A, Pieretti N, Pavoine S (2014)         Worm B, Barbier EB, Beaumont N, Duffy JE and others
   Acoustic indices for biodiversity assessment and land-          (2006) Impacts of biodiversity loss on ocean ecosystem
   scape investigation. Acta Acust 100:772−781                     services. Science 314:787−790
You can also read