You Only Group Once: Efficient Point-Cloud Processing with Token Representation and Relation Inference Module
←
→
Page content transcription
If your browser does not render page correctly, please read the page content below
You Only Group Once: Efficient Point-Cloud
Processing with Token Representation and Relation
                Inference Module

               Bohan Zhai

               Electrical Engineering and Computer Sciences
               University of California, Berkeley

               Technical Report No. UCB/EECS-2021-35
               http://www2.eecs.berkeley.edu/Pubs/TechRpts/2021/EECS-2021-35.html

               May 7, 2021
Copyright © 2021, by the author(s).
                            All rights reserved.

Permission to make digital or hard copies of all or part of this work for
personal or classroom use is granted without fee provided that copies are
not made or distributed for profit or commercial advantage and that copies
bear this notice and the full citation on the first page. To copy otherwise, to
republish, to post on servers or to redistribute to lists, requires prior specific
permission.

                               Acknowledgement

I would like to thank Bichen Wu for their advice on this project
along the way, to my co-workers Chenfeng Xu for their collaboration on the
YOGO paper, and Prof. Masayoshi Tomizuka and Prof. Kurt Keutzer for
their support
and guidance throughout my master’s career.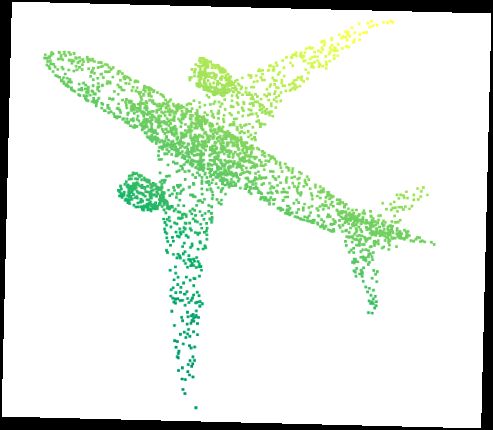
You Only Group Once: Efficient Point-Cloud Processing with Token
           Representation and Relation Inference Module

                                      by Bohan Zhai

                                   Research Project

Submitted to the Department of Electrical Engineering and Computer Sciences,
University of California at Berkeley, in partial satisfaction of the requirements for the
degree of Master of Science, Plan II.

Approval for the Report and Comprehensive Examination:

                                        Committee:

                                  Professor Kurt Keutzer
                                    Research Advisor

                                           (Date)

                                        *******

                              Professor Masayoshi Tomizuka
                                      Second Reader
                                          May 5, 2021

                                           (Date)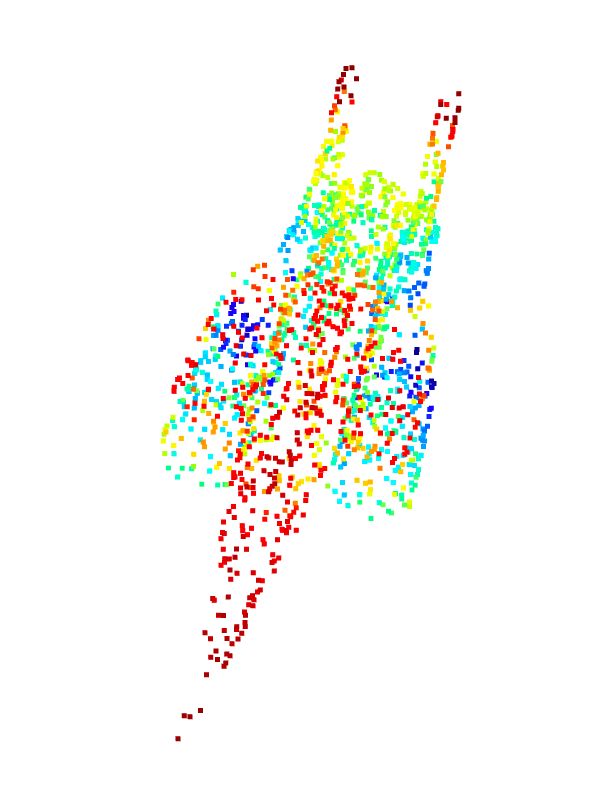
You Only Group Once: Efficient Point-Cloud Processing with Token Representation and
                             Relation Inference Module

                                          by

                                     Bohan Zhai

                A dissertation submitted in partial satisfaction of the

                            requirements for the degree of

                                  Master of Science

                                          in

                                        EECS

                                        in the

                                  Graduate Division

                                        of the

                          University of California, Berkeley

                                Committee in charge:

                           Professor Kurt Keutzer, Chair

                                     Spring 2021
You Only Group Once: Efficient Point-Cloud Processing with Token Representation and
Relation Inference Module
Copyright 2021
by
Bohan Zhai1
Abstract
You Only Group Once: Efficient Point-Cloud Processing with Token Representation and
Relation Inference Module
by
Bohan Zhai
Master of Science in EECS
University of California, Berkeley
Professor Kurt Keutzer, Chair
3D point-cloud-based perception is a challenging but crucial computer vision task. A point-
cloud consists of a sparse, unstructured, and unordered set of points. To understand a
point-cloud, previous point-based methods, such as PointNet++ [22], extract visual features
through hierarchically aggregation of local features. However, such methods have several crit-
ical limitations: 1) Such methods require several sampling and grouping operations, which
slow down the inference speed. 2) Such methods spend an equal amount of computation on
each points in a point-cloud, though many of points have similar semantic meanings. 3) Such
methods aggregate local features together through down-sampling, which leads to informa-
tion loss and hurts the perception performance. To overcome these challenges, we propose
a simple, and elegant deep learning model called YOGO (You Only Group Once). YOGO
divides a point-cloud into a small number of parts and extracts a high-dimensional token
to represent points within each sub-region. Next, we use self-attention to capture token-to-
token relations, and project the token features back to the point features. We formulate the
mentioned series of operation as a relation inference module (RIM). Compared with previ-
ous methods, YOGO only needs to sample and group a point-cloud once, thus it is very
efficient. Instead of operating on points, YOGO operates on a finite and small number of
tokens, each of which summarizes the point features in a sub-region. This allows us to avoid
computing on the redundant points and thus boosts efficiency. Moreover, YOGO preserves
point-wise features by projecting token features to point features although the computation
is performed on tokens. This avoids information loss and can improve point-wise percep-
tion performance. We conduct thorough experiments to demonstrate that YOGO achieves
at least 3.0x speedup over point-based baselines while delivering competitive egmentation
performance on the ShapeNetPart and S3DIS dataset.i
To My Families
For your continued love and support along the way.ii Contents Contents ii List of Figures iii List of Tables v 1 Introduction 1 2 Related work 3 2.1 Point-Cloud Processing . . . . . . . . . . . . . . . . . . . . . . . . . . . . . . 3 2.2 Self-attention for perception . . . . . . . . . . . . . . . . . . . . . . . . . . . 4 3 Method 6 3.1 Overview . . . . . . . . . . . . . . . . . . . . . . . . . . . . . . . . . . . . . . 6 3.2 Sub-region Division . . . . . . . . . . . . . . . . . . . . . . . . . . . . . . . . 6 3.3 Relation Inference Module (RIM) . . . . . . . . . . . . . . . . . . . . . . . . 7 3.4 Training objective . . . . . . . . . . . . . . . . . . . . . . . . . . . . . . . . . 8 4 Experiment 10 4.1 Implementation detail . . . . . . . . . . . . . . . . . . . . . . . . . . . . . . 10 4.2 Comparison experiment . . . . . . . . . . . . . . . . . . . . . . . . . . . . . 11 4.3 Ablation study . . . . . . . . . . . . . . . . . . . . . . . . . . . . . . . . . . 12 5 Discussion and conclusion 16 Bibliography 17
iii

List of Figures

1.1   (a) PointNet [21] directly globally pools a point-cloud into a global feature. (b)
      PointNet++ [22] hierarchically samples amounts of points, groups their nearby
      points, and aggregates the nearby points into one point via pointNet. (c) YOGO
      divides the whole point-cloud into several parts, squeezes it into several tokens
      and models the token-token relations to capture the part structure of the car and
      the token-points relations to project the tokens into the original points. . . . . .     2

2.1   The framework of YOGO. It consists of several stacked relation inference mod-
      ule (RIM). “Locally Squeeze” indicates that we locally squeeze the features into
      several tokens based on the sub-regions, “SA” means self-attention module and
      “CA” means cross-attention module. . . . . . . . . . . . . . . . . . . . . . . . .       4

3.1   Relation Inference Module (RIM). The input point features {fi } are first locally
      squeezed into several tokens, then we can get a stronger token representation TA
      via self-attention module. Next, the tokens TA are projected into the original
      point-wise features in the cross-attention module. The coefficient matrix shown
      in the figure is a sample from a token. . . . . . . . . . . . . . . . . . . . . . . .    7

4.1   Visualization of the coefficient matrix in cross-attention module on the ShapeNet-
      Part dataset [24]. Blue means the response is small and Red means the response
      is large. Taking the rocket point-cloud and the chair point-cloud as examples, as
      for the rocket point-cloud, we choose token 3, token 7, and token 11 that attend
      the head, the tail, and the tail, respectively. As for the chair point-cloud, we
      choose token 2, token 11, and token 14 that attend the sitting board and the legs,
      the back board and the legs, the back board and the stting board, respectively.         11
iv
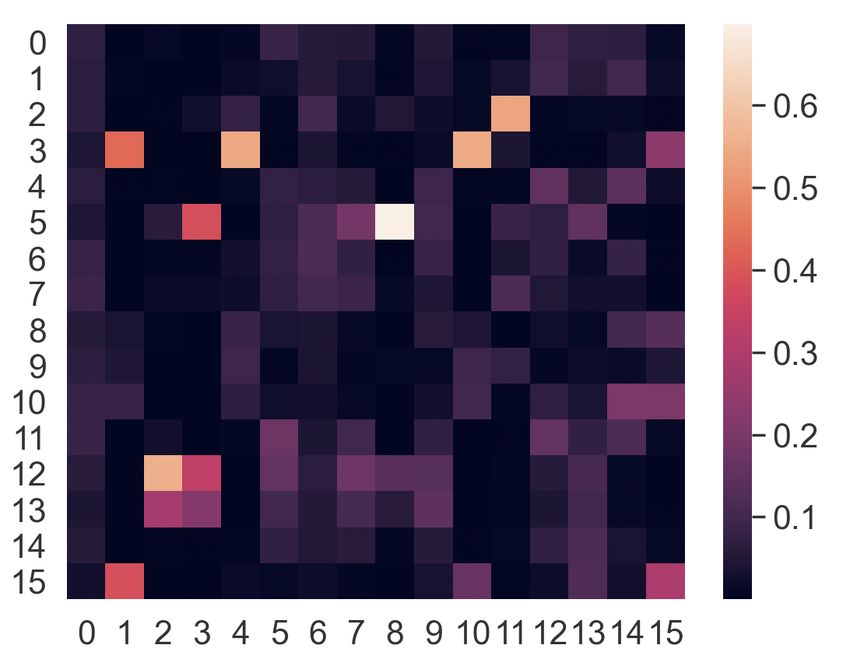
4.2 Visualization of the coefficient matrix (left) in self-attention module and the cor-
responding attentions to di↵erent parts (right). Blue (resp. red) means the
response is small (resp. large). The figure (a), (b), (c), (d) show the token 3
(resp. token 10) attending the body (resp. the wings and tail), the token 7 (resp.
token 14) attending the wings and head (resp. the wings and head), the token 5
(resp. token 8) attending the wings and tail (resp. the wings and head), the token
15 (resp. token 1) and the wings (resp. head to the wings and tail), respectively.
We can observe that the token 3 and the token 10 in figure (a), and token 5 and
token 8 in figure (c) correspond to large coefficient values since their attending
parts have strong structure relation, which can form a airplane. Yet token 7 and
token 14 in figure (b) correspond to small coefficient value since they attend very
similar part thus have less structure relation. . . . . . . . . . . . . . . . . . . . . 14
4.3 The left figure shows the e↵ect of the number of sub-regions regarding the farthest
point sampling and random sampling and the right figure shows the e↵ect of the
number of grouping points regarding the KNN grouping and ball query grouping. 15v
List of Tables
4.1 Quantitative results of semantic segmentation on the ShapeNetPart dataset. The
latency and GPU memory are measured under the batch size of 8 and the point
number of 2048. PointNet++* is a reproduced version from the popular reposi-
tory [39]. . . . . . . . . . . . . . . . . . . . . . . . . . . . . . . . . . . . . . . . 12
4.2 Quantitative results of semantic segmentation on the S3DIS dataset. The latency
and GPU memory are measured under the batch size of 8, the point number of
4096. PointNet++* is a reproduced version from the popular repository [39]. . . 12
4.3 Ablation study for self-attention module and cross-attention module in RIM.
YOGO represents that we are using the full modules, YOGO w/o SA means no
self-attention module, YOGO w/o CA means no cross-attention. . . . . . . . . 14
4.4 Ablation study for di↵erent pooling strategies. . . . . . . . . . . . . . . . . . . . 14vi
Acknowledgments
I would like to thank Bichen Wu for their advice on this project along the way, to my co-
workers Chenfeng Xu for their collaboration on the YOGO paper, and Prof. Masayoshi
Tomizuka and Prof. Kurt Keutzer for their support and guidance throughout my master’s
career.1
Chapter 1
Introduction
Increasing applications, such as autonomous driving, robotics, augmented and virtual reality,
require efficient and accurate 3D perception. As LiDAR and other depth sensors become
popular, 3D visual information is commonly captured, stored, and represented as point-
clouds. A point-cloud is essentially a set of unstructured points. Each point in a point-cloud
consist of its 3D-coordinates and, optionally, features like normal, color, and intensity.
Di↵erent from images, where pixels are arranged as 2D grids, points in a point-cloud
are unstructured. This makes it infeasible to aggregate features by using convolutions,
the de facto operator for image-based vision models. In order to handle the unstructured
point-cloud, popular methods such as PointNet [21] process each point through multi-layer
perceptrons and use a global pooling to aggregate point-wise features to form a global feature.
Then, the global feature is shared with all the point-wise features. This mechanism allows
points within a point-cloud to communicate local features with each other. However, such
pooling mechanism is too coarse as it fails to aggregate and process local information in a
hierarchical way.
Another mainstream approach, PointNet++ [22], extends PointNet [21] by hierarchically
organizing point-cloud. In particularly, they sample center points, group nearby neighbours,
and apply PointNet to aggregate local features. After PointNet++, hierarchical feature ex-
traction [14, 16, 30] has been further developed, but several limitations are not adequately
addressed: 1) Sampling and grouping for point-cloud are handcraft operations, and hierar-
chically operating them is computationally heavy. 2) This feature extraction requires com-
putation on all points, many of which are redundant because adjacent points don’t provide
extra information. 3) As local features are aggregated, point-wise features are discarded,
which leads to information loss.
Based on the aforementioned motivation, instead of directly max-pooling the whole point-
cloud into one single feature (PointNet [21]) or traversing to aggregating the neighbors for
many points (PointNet++ [22]), we propose a better way to aggregate point-cloud features,
as shown in Fig 1.1. We only need to group points into a few sub-regions once, which has
less computation cost than previous point-based methods. Then each sub-region is squeezed
into a token representation [37], which concisely summarizes the point-wise features within aCHAPTER 1. INTRODUCTION 2
PointNet
…
Global pool
Tokens
(a) PointNet (b) PointNet++ (c) YOGO
Figure 1.1: (a) PointNet [21] directly globally pools a point-cloud into a global feature. (b)
PointNet++ [22] hierarchically samples amounts of points, groups their nearby points, and
aggregates the nearby points into one point via pointNet. (c) YOGO divides the whole
point-cloud into several parts, squeezes it into several tokens and models the token-token
relations to capture the part structure of the car and the token-points relations to project
the tokens into the original points.
region and eliminates redundancy. Next, we apply self-attention [31] to capture the relations
between each token (region). While the representations are computed on the token-level, we
also use a cross-attention module to project computed token features to point-wise features,
which preserves full details with minimum computational cost. The series of operations
above is what we call relation inference modules (RIM), and we propose YOGO which is
composed of a stack of relation inference modules.3
Chapter 2
Related work
2.1 Point-Cloud Processing
Recent point-cloud processing methods mainly include volumetric-based methods, projection-
based methods, and point-based methods. We briefly introduce them as follows.
Volumetric-based methods is to rasterize the point-cloud into 3D grids (voxels) [19,
2, 23, 18] thus the convolution operator can be easily applied. However, the number of
voxels is usually limited to no more than 33 = 27 or 55 = 125 due to the constraint of
GPU memory [18]. Thereby many points are grouped into the same voxel, which introduces
information loss. Besides, To structure a regular format, many empty voxels are added for
padding, which causes redundant computation. Using a permutohedral lattice reduces the
kernel to 15 lattices [26], yet the numbers are still limited. Recently, sparse convolutions
[15] are proposed to apply on the non-empty voxels [5, 28, 44, 41], largely improving the
efficiency of 3D convolutions and boosting the scales of voxel numbers and the models.
Projection-base methods attempt to project the 3D point-cloud into a 2D plane and
exploit 2D convolution to extract features [34, 35, 36, 38, 25, 12, 3]. Specifically, the bird-
eye-view projection [42, 11] and the spherical projection [35, 36, 38, 20] made great progress
in outdoor point-cloud segmentation (e.g. autonomous driving). However, it is hard for
them to capture the point-cloud geometry structure especially when the point-cloud becomes
complex, such as indoor scenes [1] and object parsing since the points are collected in an
irregular manner.
Point-based method direct process the point-cloud. The most classic method PointNet
[21] consumes the points by MLP network and squeezes the final high-dimensional features
into a single global feature via global pooling, which significantly improves the performance
of the point-cloud recognition and semantic segmentation. Furthermore, PointNet++ [22]
extends it into a hierarchical form, in each layer the local features are aggregated. Many
works further develop advanced local-feature aggregation operators that mimics the con-
volution with customised method to structure data [14, 8, 16, 17, 32, 13, 10]. However,
the unstructured format of the point-cloud dramatically hinders their efficiency since manyCHAPTER 2. RELATED WORK 4
SA CA
Locally
…
…
Squeeze
…
Tokens Cls
Tokens
MLP RIM … RIM
Seg
Figure 2.1: The framework of YOGO. It consists of several stacked relation inference module
(RIM). “Locally Squeeze” indicates that we locally squeeze the features into several tokens
based on the sub-regions, “SA” means self-attention module and “CA” means cross-attention
module.
point-based methods rely on hierarchical handcraft operations like farthest point sampling,
K nearest neighbors and ball query. Although they gradually downsample the points in each
layer, the sample-group operations are required to be applied in each stage, which makes it
inefficient.
Our proposed YOGO is a new pipeline regarding the point-based method, which only
needs to sample-group the points once and is robust to the various sample-group operations.
2.2 Self-attention for perception
Self-attention was first introduced by Vaswani et al. [31] for the natural language processing
and recently becomes especially popular in the perception field [4, 7, 37, 27, 45]. It has
great advantages to model the relations among per-elements such as tokens (for sequence
data [6, 31]) and pixels (for image data [4]) without complex data rearrangement. This is
very useful for point-cloud data because it avoids structuring the data as previous point-
based method did. Yet, few works explore self-attention on point-cloud, a main challenge
is that the self-attention operation is computationally intensive with the time complexity of
O(N 2 ) and makes the model unscalable. For commonly used point-cloud dataset [1], at least
1024 points are required to recognize the point-cloud, which is a relatively large number for
self-attention. Thus, this motivates us to explore how to efficiently take advantage of the
self-attention mechanism.
In this paper, di↵erent from the previous point-based methods that aim to design a more
advanced local-feature aggregation operator, we propose a new baseline model termed YOGO
that takes advantage of the pooling operation and the self-attention. In particular, instead
of directly applying the self-attention to process the point-cloud, we use pooling operation toCHAPTER 2. RELATED WORK 5 aggregate the features (in a sub-region) so that we only preserve important features and can apply the self-attention in an efficient manner to model the relations between the important features. The details will be introduced in the method section.
6

Chapter 3

Method

3.1      Overview
We propose YOGO, a deep learning model for point-cloud segmentation. YOGO accepts a
set of points as input {pi }, each point pi = (xi , yi , zi ) is parameterized by its 3D coordinates
and optionally, additional features such as normal, color, and so on. At the output, for
semantic segmentation, YOGO generates point-wise labels {yi }.
    YOGO consists of a stack of relation inference modules (RIM), which is an efficient
module to process a point-cloud. For a point-cloud as input {pi } with N points, we first
divide it to L sub-regions by uniform sampling L centers and grouping their neighboring
points. For points within each sub-region, we use pooling operations to extract a few tokens
representing this region. The tokens are then processed by self-attention to capture the
feature interactions within each region. Next, tokens are processed by a cross-attention
module to exchange information among regions and aggregate long-range features. After
this, we project the token features back to point-wise features, to obtain a stronger point-
wise representation.

3.2      Sub-region Division
We divide the point-cloud into L (L ⌧ N ) regions via the commonly used farthest point
sampling (FPS) and K nearest neighbouring search (KNN search) or ball query [22]. Di↵er-
ent from the previous point-based methods [22, 14] that re-sample and re-group the points
in each layer, we only need to sample-group once because the grouped indices can be re-used
for gathering nearby points in each layer. Also note that the point sampling is fast since
L ⌧ N and L is same in each layer. After this step, the point-cloud {pi } is divided into L
                (j)        (j)
sub-regions {pi } where pi denotes the ith point in the j th sub-region.
CHAPTER 3. METHOD 7
Relation Inference Module (RIM)
T Head
Wings
Locally
…
Tail Self-Attention
Squeeze
Body
…
TA
Point feature {fi}
Coefficient matrix
Cross-Attention
Figure 3.1: Relation Inference Module (RIM). The input point features {fi } are first locally
squeezed into several tokens, then we can get a stronger token representation TA via self-
attention module. Next, the tokens TA are projected into the original point-wise features
in the cross-attention module. The coefficient matrix shown in the figure is a sample from a
token.
3.3 Relation Inference Module (RIM)
The relation inference module (RIM) does not require handcrafted grouping and sampling
operations to aggregate point-wise features. Instead, it adopts a simple pooing operation
an self-attention. The pooling operation is used to aggregate features within a sub-region
[21, 17], while self-attention is used to capture relations between sub-regions. Self-attention
has been demonstrated to have a superior ability to capture long-range relations in many
vision and language tasks. However, as self-attention’s computational cost is quadratic with
number of input elements, it is infeasible to be directly used for point-cloud. In our work, our
design is to let self-attention operate on region/tokens, instead of points, this greatly reduces
the computational cost while leveraging the advantages of self-attention. The structure of
RIM is presented in Fig. 3.1.
Specifically, given a set of point features {fi } corresponding to a point-cloud {pi }, we
(j) (j)
divide the points into sub regions {pi } with corresponding features {fi }. RIM computes
a token to represent points within each region as
(j)
T(j) = G(maxpooli ({fi })), (3.1)
(j)
where fi 2 R1⇥C denotes point-i in region-j. maxpooli is the max-pooling operation to
(j)
squeeze points in {fi } to one. G(·) is a linear function that maps the pooled feature to theCHAPTER 3. METHOD 8
output T(j) 2 R1⇥CT . This is similar to PointNet [21], yet PointNet applies a pooling to all
the points, while we focus on di↵erent sub-regions.
Next, to model the relations between di↵erent regions using self-attention as [31]. We
first combine all the tokens {T(j) } to form a tensor T 2 RL⇥CT . Since self-attention is a
permutation-invariant operation, we can choose any order to stack {T(j) } to form T. On
the token, we compute
Mtt = TŴk (TŴq )T ,
SA(T) = sof tmax(Mtt )(T Ŵv ) + T, (3.2)
TA = SA(T)Ŵp .
where TA 2 RL⇥CT is the output of the self-attention module, Mtt 2 RL⇥L is the coefficient
matrix regarding token-token relation in T 2 RL⇥CT , and Ŵp 2 RCT ⇥CT , Ŵv 2 RCT ⇥CT ,
Ŵk 2 RCT ⇥CT , Ŵq 2 RCT ⇥CT are the parameterized matrix, representing the weights for
project, value, key and query [31], respectively.
Next, we project the output tokens back to point-wise features. To do this, we feed
TA 2 RL⇥CT and the original point-wise feature {fi } to a cross-attention module as
T̄A = G0 (TA ),
Mtp = fi Wk (T̄A Wq )T ,
(3.3)
CA(T̄A , fi ) = sof tmax(Mtp )(T̄A Wv ) + fi ,
f̄i = CA(T̄A , fi )Wp ,
where f̄i is the output point-feature of the cross-attention module, which is parametrized by
the matrix Wp 2 RC⇥C , the matrix Wv 2 RC⇥C , the matrix Wk 2 RC⇥C , and the matrix
Wq 2 RC⇥C . G0 is a MLP mapping the TA 2 RL⇥CT into T̄A 2 RL⇥C and Mtp 2 RL⇥1 is a
coefficient matrix between the tokens T̄A and a point feature fi .
Analytically, each token element in TA encodes the most important and representative
components in each corresponding sub-region. The self-attention regarding the TA can help
capture the structure of the point-cloud, e.g., as shown in Fig. 3.1, the head, the wings,
the airplane body, and the tail have strong structure relations between each other. This is
useful to learn semantics since we can recognize the airplane through these representative
elements. After this, the coefficient matrix Mtp is calculated to indicate the relations between
the tokens and each point which helps to project tokens with rich semantic information into
original point-cloud features.
3.4 Training objective
Our proposed network YOGO can handle point-cloud segmentation tasks and can be simply
trained end-to-end. We simply apply the commonly used cross-entropy loss to train the
model, which is given byCHAPTER 3. METHOD 9
P PC
N c=1 yn c · log(pn c )
Lseg = , (3.4)
N
where Lseg is for segmentation, C is the total categories of each point, N is the whole number
of the point-cloud, yn c ) is the ground-truth for nth point, and pn c is the softmax probability
prediction.10
Chapter 4
Experiment
The experiments are conducted on the ShapeNetPart [24] and S3DIS [1] dataset for seg-
mentation task. We conduct both comparison experiments for e↵ectiveness and efficiency
evaluation and ablation study for deep analysis of why YOGO works. The details are illus-
trated as follows.
4.1 Implementation detail
We stack eight relation inference modules on all experiments and set CT equal to 256 and
C equal to 32, 32, 64, 64, 128, 128, 256, 256 respectively for the eight relation inference
modules.
We first conduct the experiment on the ShapeNetPart [24] dataset, which involves 16681
di↵erent objects with 16 categories and 2-6 part labels for each. By utilizing the evaluation
metric mean intersection-over-union (mIoU), we first calculate the part-averaged IoU for
each of the 2874 test models and average the values as the final metrics. We set the L equal
to 32, K equal to 96. All the coordinates of points are normalized into [0, 1]. As for the ball
query grouping, we set the radium to 0.2. During training, we input the data with the size
of 2048 points and the batch size of 128, and use the cosineAnnealing learning rate strategy
with initial learning rate 1e-3 and Adam optimizer to optimize the network. During the
inference, we input the points with the size of 2048 and vote 10 times for each point-cloud.
We then conduct the experiment on the S3DIS [1], which is collected from the real-world
indoor scenes and includes 3D scans of Matterport Scanners from 6 areas. We also use the
mIoU as the evaluation metric. We apply the 1, 2, 3, 4, 6 areas for training and use the 5 area
for the test since it is the only area that does not overlap with any other area. We set the L
equal to 32, K equal to 128. For ball query grouping, the radium is set to 0.3. We train the
networks via feeding the input with the 4096 points and batch size 64, and utilize the same
training strategy as the aforementioned for the ShapeNetPart dataset. During the inference,
we also input the points with the size of 4096 and vote one times for each point-cloud. Note
that all the experiments are conducted on one Titan RTX GPU.CHAPTER 4. EXPERIMENT 11
Token 3 Token 7 Token 11 Token 2 Token 11 Token 14
Token 1 Token 8 Token 12
Token 1 Token 4 Token 11
Figure 4.1: Visualization of the coefficient matrix in cross-attention module on the ShapeNet-
Part dataset [24]. Blue means the response is small and Red means the response is large.
Taking the rocket point-cloud and the chair point-cloud as examples, as for the rocket point-
cloud, we choose token 3, token 7, and token 11 that attend the head, the tail, and the tail,
respectively. As for the chair point-cloud, we choose token 2, token 11, and token 14 that
attend the sitting board and the legs, the back board and the legs, the back board and the
stting board, respectively.
4.2 Comparison experiment
We first perform YOGO on the ShapeNetPart dataset [24] and S3DIS dataset for semantic
segmentation evaluation, as shown in Table. 4.1 and Table. 4.2. We can observe that
YOGO has very competitive performance and speedups at least 3x over point-based baselines
on the ShapeNetPart dataset. Precisely, YOGO slightly outperforms the classic baseline
PointNet++ [22] and performs at least 3x faster. Although the unofficial PointNet++ [39]
slightly outperforms YOGO, YOGO largely speedups it over 9.2x faster. As for the S3DIS
dataset, YOGO also achieves at least 4.0x speedup and delivers competitive performance.
PointCNN [14] outperforms YOGO over 0.9 mIoU (resp. 3.26 mIoU) on the ShapeNetPart
(resp. S3DIS) dataset but is not efficient.
We can also observe that YOGO with two di↵erent grouping method KNN and ball query
have similar performance, which shows that our proposed method is relatively stable with
regard to di↵erent grouping strategies. Note that there remain many excellent methods that
perform better than YOGO, we are not attempting to beat all of them. Instead, we propose
a novel baseline from the perspective of token-token relation and token-point relation.CHAPTER 4. EXPERIMENT 12
Method Mean IoU Latency GPU Memory
PointNet [21] 83.7 21.4 ms 1.5 GB
RSNet [9] 84.9 73.8 ms 0.8 GB
SynSpecCNN [43] 84.7 - -
PointNet++ [22] 85.1 77.7 ms 2.0 GB
PointNet++* [22] 85.4 236.7 ms 0.9 GB
DGCNN [33] 85.1 86.7 ms 2.4 GB
SpiderCNN [40] 85.3 170.1 ms 6.5 GB
SPLATNet [26] 85.4 - -
SO-Net [13] 84.9 - -
PointCNN [14] 86.1 134.2 ms 2.5 GB
Y OGO (KNN) 85.2 25.6 ms 0.9 GB
Y OGO (Ball query) 85.1 21.3 ms 1.0 GB
Table 4.1: Quantitative results of semantic segmentation on the ShapeNetPart dataset. The
latency and GPU memory are measured under the batch size of 8 and the point number of
2048. PointNet++* is a reproduced version from the popular repository [39].
Method Mean IoU Latency GPU Memory
PointNet [21] 42.97 24.8 ms 1.0 GB
DGCNN [33] 47.94 174.3 ms 2.4 GB
RSNet [9] 51.93 111.5 ms 1.1 GB
PointNet++* [22] 50.7 501.5 ms 1.6 GB
TangentConv [29] 52.6 - -
PointCNN [14] 57.26 282.43 ms 4.6 GB
Y OGO (KNN) 54.0 27.7 ms 2.0 GB
Y OGO (Ball query) 53.8 24.0 ms 2.0 GB
Table 4.2: Quantitative results of semantic segmentation on the S3DIS dataset. The la-
tency and GPU memory are measured under the batch size of 8, the point number of 4096.
PointNet++* is a reproduced version from the popular repository [39].
4.3 Ablation study
In this subsection, we do an in-depth study of our proposed YOGO, including the e↵ective-
ness of the Relation Inference Module (RIM) and related techniques on the ShapeNetPart
dataset. More importantly, we analyze what RIM learns, thus explicitly explain why YOGO
works.
The e↵ectiveness of RIM. The self-attention module and the cross-attention module
are the two key components in RIM. We study them by removing them respectively. In
particular, when we remove the self-attention module (SA), we insert several MLP layersCHAPTER 4. EXPERIMENT 13
that have similar FLOPs as the self-attention modules. When we remove the cross-attention
module, we use di↵erent related techniques: 1) Directly squeeze the tokens TA into one global
feature and concatenate it with the point feature FP , which is similar to PointNet [21]; 2)
add or concatenate the tokens TA into the FP corresponding to di↵erent sub-regions. The
results are shown in Table. 4.3.
We can observe that if we coarsely use the tokens by squeezing them into one global fea-
ture, the performance is largely worse than the original YOGO by 1.1 mIoU. A more reason-
able method is to leverage them on the corresponding sub-regions by adding/concatenating
each token with the corresponding point features of sub-regions. It can be seen that the orig-
inal YOGO still outperforms them by at least 0.5 mIoU, which shows the cross-attention
method is more e↵ective. On the other hand, when we substitute the self-attention mod-
ule with several MLP, the performance also drops 0.5 mIoU, which also shows that it is
important to learn the relations between di↵erent sub-regions.
Visualization analysis of RIM. To explore what RIM learns, we visualize some sam-
ples of the coefficient matrix in the cross-attention module, as shown in Fig. 4.1. Note that
the coefficient matrix of the cross-attention module indicates the relation between the tokens
and the original point features, yet there is no explicit supervision to guide the learning co-
efficient matrix. We can observe that di↵erent tokens can automatically attend to di↵erent
parts even without supervision. For example, the tokens regarding the rocket point-cloud
have stronger responses to the head, the tail, and the flank, respectively. Similarly, the to-
kens regarding the chair point-cloud have stronger responses to the back, the sitting board,
and the legs, respectively. These can demonstrate that tokens carry strong semantic infor-
mation, and the cross-attention module helps the tokens with rich semantic information be
projected into point-wise features.
We also visualize the coefficient matrix in the self-attention module, for better visual-
ization, we choose the models with L equal to 16. As shown in Fig. 4.2, the figure (a) in
the right shows the token attending the body has more relations to the token indicating the
flank and the wings, which together form a whole airplane. The figure (c) and (d) on the
right are also similar, they attend di↵erent sub-regions which are connected together and
build the structure of the airplane point-cloud. We find that for the tokens attending the
relatively same parts, their coefficient values are low, which indicates that the self-attention
module does not simply learn the similarity of di↵erent tokens instead capture the relations
of di↵erent sub-regions that build the structure of a point-cloud. This can also be indicated
from the small coefficient values between the same tokens.
Other techniques. We study other techniques related to our proposed YOGO including
the e↵ectiveness of choices of L and K, the sampling and grouping methods, and the di↵erent
pooling strategies.
Regarding the choices of L and K, we conduct experiments by fixing the K equal to
64 and increasing the L under both farthest point sampling (FPS) and random sampling,
as well as fixing the L equal to 32 and increasing the K under both KNN and ball query
[22], as presented in the Fig. 4.3. We find that when using di↵erent sampling methods, the
performance will be better if increasing L. Besides, even for random sampling strategy, itCHAPTER 4. EXPERIMENT 14
Method Mean IoU
YOGO w/o CA (concat global feature) 84.1
YOGO w/o CA (adding tokens) 84.7
YOGO w/o CA (concat tokens) 84.6
YOGO w/o SA 84.7
YOGO 85.2
Table 4.3: Ablation study for self-attention module and cross-attention module in RIM.
YOGO represents that we are using the full modules, YOGO w/o SA means no self-attention
module, YOGO w/o CA means no cross-attention.
Token 3 Token 10 Token 7 Token 14
a b
Token 5 Token 8 Token 15 Token 1
c d
Figure 4.2: Visualization of the coefficient matrix (left) in self-attention module and the
corresponding attentions to di↵erent parts (right). Blue (resp. red) means the response is
small (resp. large). The figure (a), (b), (c), (d) show the token 3 (resp. token 10) attending
the body (resp. the wings and tail), the token 7 (resp. token 14) attending the wings and
head (resp. the wings and head), the token 5 (resp. token 8) attending the wings and tail
(resp. the wings and head), the token 15 (resp. token 1) and the wings (resp. head to the
wings and tail), respectively. We can observe that the token 3 and the token 10 in figure
(a), and token 5 and token 8 in figure (c) correspond to large coefficient values since their
attending parts have strong structure relation, which can form a airplane. Yet token 7 and
token 14 in figure (b) correspond to small coefficient value since they attend very similar
part thus have less structure relation.
Method Mean IoU
YOGO with max-pool 85.2
YOGO with avg-pool 85.0
Table 4.4: Ablation study for di↵erent pooling strategies.
has relatively small margin to farthest point sampling, which may indicate that our proposed
YOGO is robust to di↵erent sampling methods. When using di↵erent grouping method, the
performance also consistently improves when K become larger. Besides, we find there is notCHAPTER 4. EXPERIMENT 15
85.3
85.2 85.23 85.2 85.2
85.1 85.1
84.8 85
84.7
84.6 84.6
84.8 84.8
84.2 84.7
16 32 48 64 48 64 96 128 256
Farthest Point Sampling Random Sampling KNN Ball Query
Figure 4.3: The left figure shows the e↵ect of the number of sub-regions regarding the farthest
point sampling and random sampling and the right figure shows the e↵ect of the number of
grouping points regarding the KNN grouping and ball query grouping.
too much performance gap between ball query and KNN, this indicate our method is robust
to di↵erent grouping methods.
Regarding the choices of di↵erent pooling operations, we study the di↵erences between
average pooling and max pooling, as shown in Table. 4.4. The experiment demonstrates the
max pooling achieves higher performance than the average pooling. The reason is that the
max pooling can better aggregate the most important information in a sub-region, which is
more important for our proposed YOGO since it highly depends on their relations.16 Chapter 5 Discussion and conclusion In this paper, we propose a novel, simple, and elegant framework YOGO (you only group once) for efficient point-cloud processing. In contrast to previous point-based methods, YOGO divides point-cloud into a few sub-regions applying sampling and grouping operation once, leverages efficient token representation, models token relations and projects token to obtain strong point-wise features. YOGO achieves at least 3x speedup over popular point-based baselines. Meanwhile, YOGO delivers competitive performance on semantic segmentation on the ShapeNetPart and S3DIS dataset. Moreover, YOGO is also robust to di↵erent sampling and grouping strategies, even for random sampling. It is noteworthy to mention that YOGO introduced in this paper is a new framework and has huge potentials for point-cloud processing. In particular, it can be improved from the aspects of how to better sample then group out sub-regions, how to obtain better tokens, and how to better combine tokens and point-wise features etc. We hope that it can inspire the research community to further develop this framework.
17

Bibliography

 [1] Iro Armeni et al. “Joint 2d-3d-semantic data for indoor scene understanding”. In: arXiv
     preprint arXiv:1702.01105 (2017).
 [2] Yizhak Ben-Shabat, Michael Lindenbaum, and Anath Fischer. “3dmfv: Three-dimensional
     point cloud classification in real-time using convolutional neural networks”. In: IEEE
     Robotics and Automation Letters 3.4 (2018), pp. 3145–3152.
 [3] Alexandre Boulch, Bertrand Le Saux, and Nicolas Audebert. “Unstructured Point
     Cloud Semantic Labeling Using Deep Segmentation Networks.” In: 3DOR 2 (2017),
     p. 7.
 [4] Nicolas Carion et al. “End-to-end object detection with transformers”. In: European
     Conference on Computer Vision. Springer. 2020, pp. 213–229.
 [5] Christopher Choy, JunYoung Gwak, and Silvio Savarese. “4d spatio-temporal con-
     vnets: Minkowski convolutional neural networks”. In: Proceedings of the IEEE/CVF
     Conference on Computer Vision and Pattern Recognition. 2019, pp. 3075–3084.
 [6] Jacob Devlin et al. “Bert: Pre-training of deep bidirectional transformers for language
     understanding”. In: arXiv preprint arXiv:1810.04805 (2018).
 [7] Alexey Dosovitskiy et al. “An image is worth 16x16 words: Transformers for image
     recognition at scale”. In: arXiv preprint arXiv:2010.11929 (2020).
 [8] Binh-Son Hua, Minh-Khoi Tran, and Sai-Kit Yeung. “Pointwise convolutional neural
     networks”. In: Proceedings of the IEEE Conference on Computer Vision and Pattern
     Recognition. 2018, pp. 984–993.
 [9] Qiangui Huang, Weiyue Wang, and Ulrich Neumann. “Recurrent slice networks for 3d
     segmentation of point clouds”. In: Proceedings of the IEEE Conference on Computer
     Vision and Pattern Recognition. 2018, pp. 2626–2635.
[10] Artem Komarichev, Zichun Zhong, and Jing Hua. “A-cnn: Annularly convolutional
     neural networks on point clouds”. In: Proceedings of the IEEE/CVF Conference on
     Computer Vision and Pattern Recognition. 2019, pp. 7421–7430.
[11] Alex H Lang et al. “Pointpillars: Fast encoders for object detection from point clouds”.
     In: Proceedings of the IEEE/CVF Conference on Computer Vision and Pattern Recog-
     nition. 2019, pp. 12697–12705.
BIBLIOGRAPHY 18
[12] Felix Järemo Lawin et al. “Deep projective 3D semantic segmentation”. In: Inter-
national Conference on Computer Analysis of Images and Patterns. Springer. 2017,
pp. 95–107.
[13] Jiaxin Li, Ben M Chen, and Gim Hee Lee. “So-net: Self-organizing network for point
cloud analysis”. In: Proceedings of the IEEE conference on computer vision and pattern
recognition. 2018, pp. 9397–9406.
[14] Yangyan Li et al. “PointCNN: Convolution on -transformed points”. In: Proceedings
of the 32nd International Conference on Neural Information Processing Systems. 2018,
pp. 828–838.
[15] Baoyuan Liu et al. “Sparse convolutional neural networks”. In: Proceedings of the IEEE
conference on computer vision and pattern recognition. 2015, pp. 806–814.
[16] Yongcheng Liu et al. “Densepoint: Learning densely contextual representation for ef-
ficient point cloud processing”. In: Proceedings of the IEEE/CVF International Con-
ference on Computer Vision. 2019, pp. 5239–5248.
[17] Ze Liu et al. “A closer look at local aggregation operators in point cloud analysis”. In:
European Conference on Computer Vision. Springer. 2020, pp. 326–342.
[18] Zhijian Liu et al. “Point-voxel cnn for efficient 3d deep learning”. In: arXiv preprint
arXiv:1907.03739 (2019).
[19] Daniel Maturana and Sebastian Scherer. “Voxnet: A 3d convolutional neural network
for real-time object recognition”. In: 2015 IEEE/RSJ International Conference on
Intelligent Robots and Systems (IROS). IEEE. 2015, pp. 922–928.
[20] Andres Milioto et al. “Rangenet++: Fast and accurate lidar semantic segmentation”.
In: 2019 IEEE/RSJ International Conference on Intelligent Robots and Systems (IROS).
IEEE. 2019, pp. 4213–4220.
[21] Charles Ruizhongtai Qi et al. “PointNet: Deep Learning on Point Sets for 3D Classi-
fication and Segmentation”. In: CVPR. 2017.
[22] Charles Ruizhongtai Qi et al. “PointNet++: Deep Hierarchical Feature Learning on
Point Sets in a Metric Space”. In: NIPS. 2017.
[23] Xavier Roynard, Jean-Emmanuel Deschaud, and François Goulette. “Classification of
point cloud scenes with multiscale voxel deep network”. In: arXiv preprint arXiv:1804.03583
(2018).
[24] Sketchup. 3D Modeling Online Free—3D Warehouse Models. https://3dwarehouse.
sketchup.com. 2021.
[25] Hang Su et al. “Multi-view convolutional neural networks for 3d shape recognition”. In:
Proceedings of the IEEE international conference on computer vision. 2015, pp. 945–
953.BIBLIOGRAPHY 19
[26] Hang Su et al. “Splatnet: Sparse lattice networks for point cloud processing”. In:
Proceedings of the IEEE conference on computer vision and pattern recognition. 2018,
pp. 2530–2539.
[27] Peize Sun et al. “SparseR-CNN: End-to-End Object Detection with Learnable Propos-
als”. In: arXiv preprint arXiv:2011.12450 (2020).
[28] Haotian Tang et al. “Searching efficient 3d architectures with sparse point-voxel con-
volution”. In: European Conference on Computer Vision. Springer. 2020, pp. 685–702.
[29] Maxim Tatarchenko et al. “Tangent convolutions for dense prediction in 3d”. In: Pro-
ceedings of the IEEE Conference on Computer Vision and Pattern Recognition. 2018,
pp. 3887–3896.
[30] Hugues Thomas et al. “KPConv: Flexible and Deformable Convolution for Point
Clouds”. In: Proceedings of the IEEE International Conference on Computer Vision
(2019).
[31] Ashish Vaswani et al. Attention Is All You Need. 2017. arXiv: 1706.03762 [cs.CL].
[32] Peng-Shuai Wang et al. “O-cnn: Octree-based convolutional neural networks for 3d
shape analysis”. In: ACM Transactions on Graphics (TOG) 36.4 (2017), pp. 1–11.
[33] Yue Wang et al. “Dynamic graph cnn for learning on point clouds”. In: Acm Transac-
tions On Graphics (tog) 38.5 (2019), pp. 1–12.
[34] Zining Wang, Wei Zhan, and Masayoshi Tomizuka. “Fusing bird’s eye view lidar point
cloud and front view camera image for 3d object detection”. In: 2018 IEEE Intelligent
Vehicles Symposium (IV). IEEE. 2018, pp. 1–6.
[35] Bichen Wu et al. “Squeezeseg: Convolutional neural nets with recurrent crf for real-time
road-object segmentation from 3d lidar point cloud”. In: ICRA. 2018.
[36] Bichen Wu et al. “SqueezeSegV2: Improved Model Structure and Unsupervised Domain
Adaptation for Road-Object Segmentation from a LiDAR Point Cloud”. In: ICRA.
2019.
[37] Bichen Wu et al. “Visual transformers: Token-based image representation and process-
ing for computer vision”. In: arXiv preprint arXiv:2006.03677 (2020).
[38] Chenfeng Xu et al. “Squeezesegv3: Spatially-adaptive convolution for efficient point-
cloud segmentation”. In: European Conference on Computer Vision. Springer. 2020,
pp. 1–19.
[39] Yan Xu. Pointnet Pointnet2 pytorch. https : / / github . com / yanx27 / Pointnet _
Pointnet2_pytorch. 2019.
[40] Yifan Xu et al. “Spidercnn: Deep learning on point sets with parameterized con-
volutional filters”. In: Proceedings of the European Conference on Computer Vision
(ECCV). 2018, pp. 87–102.BIBLIOGRAPHY 20
[41] Yan Yan, Yuxing Mao, and Bo Li. “Second: Sparsely embedded convolutional detec-
tion”. In: Sensors 18.10 (2018), p. 3337.
[42] Bin Yang, Wenjie Luo, and Raquel Urtasun. “Pixor: Real-time 3d object detection
from point clouds”. In: Proceedings of the IEEE conference on Computer Vision and
Pattern Recognition. 2018, pp. 7652–7660.
[43] Li Yi et al. “Syncspeccnn: Synchronized spectral cnn for 3d shape segmentation”. In:
Proceedings of the IEEE Conference on Computer Vision and Pattern Recognition.
2017, pp. 2282–2290.
[44] Hui Zhou et al. “Cylinder3d: An e↵ective 3d framework for driving-scene lidar semantic
segmentation”. In: arXiv preprint arXiv:2008.01550 (2020).
[45] Zhen Zhu et al. “Asymmetric non-local neural networks for semantic segmentation”.
In: Proceedings of the IEEE/CVF International Conference on Computer Vision. 2019,
pp. 593–602.You can also read