1Q2016 Results Presentation - EI Towers

Page created by Josephine Ruiz
 
CONTINUE READING
1Q2016 Results Presentation - EI Towers
1Q2016 Results Presentation
1Q2016 Results Presentation - EI Towers
Disclaimer

Forward-looking Statements contained in this document, particularly the ones
regarding any EIT (EI Towers) possible or assumed future performance, are or may
be forward-looking statements and in this respect they involve some risks and
uncertainties.
EIT actual results and developments may differ materially from the ones
expressed or implied by the above statements depending on a variety of factors.
Any reference to past performance of EIT shall not be taken as an indication of
future performance.
This announcement does not constitute an offer to sell or the solicitation of an
offer to buy the securities discussed herein.
The executive responsible for the preparation of the accounts of EI Towers SpA,
Fabio Caccia, declares that, as per art. 2, 154 bis of the Consolidated Finance
Law, the 2015 and 2016 accounting information contained in this release
corresponds to that contained in the company’s formal accounts.

                                                                                   1
Company Snapshot
                      Revenues Profile and Geographical Presence

• Breakdown by activity1                               • Current Tower Portfolio
       — Revenues by mix                                  >3,300 Sites under management
         2015: €241.8m
                 TLC
                 13%

                       Tv Broadcast                      TLC
                           87%                           30%

                                                               Broadcast
       — EBITDA by mix                                            70%

         2015: €113m
                                                                           Legend:
                                                                              >300 sites
                                                                              101-300 sites
                                                                              51-100 sites
                TLC
                                                                              0-50 sites
                16%

                       Tv Broadcast
                           84%

1   Core Revenues FY2015                                                                      2
1Q2016 Highlights

• Core Revenues at €61.5m (+3.5% yoy)
  — Growth driven by volumes (mainly M&A activity)

• First Quarter Adjusted EBITDA at €30.8m (+8.9% yoy)
  — Result, before extraordinary items, in line with FY2016 guidance
  — Adjusted EBITDA margin at 50.1% (+250 bps vs 1Q2015)
  — Reported EBITDA at €30.5m

• Free Cash Flow generation
  — Normalized figure, before small M&A/development capex, deferred payments, at ca €13m
  — ca €3.2m Net Free Cash Flow
  — Net Debt at €127.1m

                                                                                           3
Income Statement

                               Data in €/m *           1Q2015   1Q2016   Var. % YoY

                               Core Revenues            59.4     61.5      3.5%
                                                                                      Growth rate higher than CPI largely thanks to
                                                                                      small M&A
 IQ 2016 Financial Headlines

                               Other revenues            0.0      1.2
                               Total Revenues           59.4     62.7      5.5%

                               Operating costs         (31.2)   (31.9)     2.3%       Increase due to M&A and Cairo project
                               - o/w Opex               20.3     21.1       3.9%
                               - o/w Labour Cost        10.9     10.7      -1.4%
                                                                                                    3
                               Adj. EBITDA              28.3     30.8      8.9%
                               % on Core Revenues      47.6%    50.1%
                               Non recurring items      (1.8)    (0.3)
                                                                                      EBITDA growth and margin, net of other
                               EBITDA                   26.5     30.5      15.1%
                                                                                      revenues, in line with Industrial Plan 2014/18
                               D&A                      (9.3)    (9.0)     -3.4%
                               Provisions                 -        -
                               EBIT                     17.2     21.5      25.1%
                               Net financial charges    (2.0)    (2.3)     15.2%
                               EBT                      15.2     19.2      26.4%
                               Income taxes             (5.3)    (6.5)     22.0%
                               Net income                9.9     12.7      28.9%

                               EPS (€)                  0.35     0.45      28.9%

(*)     Figures restated due to PPA                                                                                               4
1Q2016 Margins

 Data in €/m

                                      30.8

                                                       21.5
% on Core Revenues

                                      50.1%
                                        50.1%          35%
                                      50.1%                        35%

                                  1Q2016 EBITDA(*)   1Q2016 EBIT

 (*)   Adjusted EBITDA                                                   5
Net Debt and Cash Flow Bridge

Data in €/m

                                                                                    11.5

                                                            3.4   1.9   1.8   0.3
                                                      6.5
                                                2.3

                                       (30.8)

                               130.3                                                       127.1

(*)   Including M&A expenses                                                                       6
Recent Events
          First Important steps into the Internet of Things arena

Nettrotter - EI Towers newly incorporated subsidiary - recently signed an exclusive agreement
with Sigfox for the development in Italy of a new network dedicated to LPWA IoT

• Low Power Wide Area (LPWA) technology developed by Sigfox:
   Very low energy consumption (battery life: up to more than 10 years [suited for objects
    not connected to power grids])
   Very high transmission range (BS radius: up to more than 5 km)

   Very low level of complexity
   In order to save power and have long lasting products (up to 10-15 years), focus on objects
    mainly communicating in uplink mode (downlink mode anyhow available).

• Under the exclusive agreement with Sigfox (10 years, renewable) Nettrotter
  will own:
   Network

   Customers

                                                                                                  7
Recent Events
          First Important steps into the Internet of Things arena

About Sigfox:
   Sigfox is the first and, so far, the only player who has developed a truly integrated end to
    end ecosystem to be built around a LPWA network with international coverage
   Technology and network are already operational in several countries
       Sigfox International footprint                       Sigfox Partners in Europe

 Sigfox equity partners are, among others:

                                                                                                   8
Recent Events
                        First Important steps into the Internet of Things arena

       EI Towers role and ambitions in the exclusive partnership with Sigfox:

         Deployment of the first LPWA IoT network in Italy with nationwide coverage:
                • ~ 1,000 BS in 24 ÷ 30 months
                • Initial rollout covering Rome and Milan by 2Q2016
                • Capitalize on time advantage vs other LPWA technologies (not available as of today)

         Thanks to EI Towers footprint, synergies and relationships in the territory, capex related to
          the deployment of the new network will have a negligible impact on EIT’s existing business
          plan capex profile

         Nettrotter will get in full the revenues from the Italian market (according to the number of
          connected objects) and will pay a revenue share to Sigfox.
                         Option to capture a potentially extremely significant value creation   (*)

(*)   Total IoT global market in 2025: 4 to 11 $ trillion, according to McKinsey                        9
2016 Outlook (1/2)

• Based on 1Q figures, adjusted(*) FY EBITDA confirmed

• New small M&A target portfolios on track
        — Up to pro-forma €4-5m EBITDA to be acquired

• International investment opportunities under scrutiny
        — Mid size portfolios on the radar

(*)   Before non-recurring items (e.g. M&A expenses)      10
2016 Outlook (2/2)

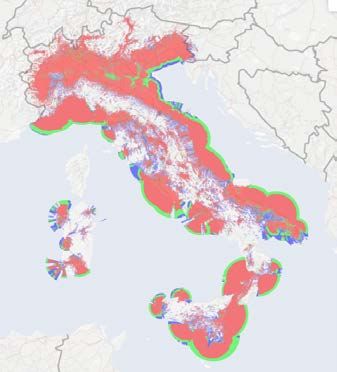
• Nettrotter (Internet of Things)                  Current coverage

  — More than 370 base stations already
    installed
  — Network already available for outdoor and
    indoor use cases
  — ~60% of the Italian population already
    covered
  — 85% of the Italian population will be
    covered by the end of 2016                  1Q2017 target coverage
  — First clients already engaged. Main use
    cases ready to be activated:
    »   Power monitor
    »   Water Metering
    »   Environmental Monitoring                                         Legend:

    »   Physical Asset management                                           1 Base station

                                                                            2 Base stations

                                                                            3 Base stations

                                                                                              11
Analysis of the Reference Markets:
        Broadcast Segment

                                     12
Broadcast Segment
  Market Players

                   Network     Tower
Publishers
                   Operators    Cos

                                       13
Publishers
                         Italian TV Market

   • Audience Share 15-641                                                                      • Pay TV: Market Share (subscribers)
• Eurosport
• US Majors:
    - Disney
    - Universal                     Discovery       MTV
                                      Group         1.2%
    - Turner                           6.8%
    - Sony (AXN)
    <
• BBC
• Italian Publishers3
                                       Others
                                       11.4%                                  RAI
                                                                             32.1%

                                 Sky + Fox
                                   8.6%

                         La 7
                         3.2%

                                                       Mediaset2
                                                        36.7%

   1   Source: Company elaborations on Auditel data, January-December 2014           3   De Agostini/LT Multimedia/L’Espresso Group/Feltrinelli/Class
   2   Including MS Pay TV                                                                                                                              14
Network Operators
                      TV Frequencies Landscape

     Mediaset 1                            Rai Mux 1               Persidera 1
                                                                    Ex TIMB 1

     Mediaset 2                            Rai Mux 2               Persidera 2
                                                                    Ex TIMB 2

                                           Rai Mux 3               Persidera 3
     Mediaset 3                 5                        5          Ex TIMB 3     5
     Mediaset 4                            Rai Mux 4               Persidera 4
                                                                    Ex Rete A 1

     Mediaset 5                            Rai Mux 5               Persidera 5
                                                                    Ex Rete A 2

                                                                    Cairo
           H3G                  D Free     Europa 7    Retecapri
                                                                   Network1

                                                 20
1   At regime after 2016/2017                                                     15
TV Channels Distribution
                       Allocation within Multiplexes

                                   Others Sat   Others DTT              Mediaset 1           H3G
    Other Publishers                                                    Mediaset 2
      on Mediaset
       Premium
                              Others                                    Mediaset 3    5
                                                  RAI Generalist
                                                   (R1+R2+R3)
                                                                        Mediaset 4
             Sky DTT
                                                                        Mediaset 5          D Free
                       Sky Bouquet Sat
                                                     RAI Multichannel

                                                                        Rai Mux 1
                   La 7

                                          MS Generalist                 Rai Mux 2 1
            MS Multichannel                (C5+I1+R4)
                                                                        Rai Mux 3     5    Europa 7

                                                                        Rai Mux 4

                                                                        Rai Mux 5

                                                                        Persidera 1        Retecapri
                                                  Mediaset
                                                  Premium               Persidera 2
                                                    28%
                                                                        Persidera 3   5
                                       Sky                              Persidera 4
                                       72%
                                                                                            Cairo
                                                                        Persidera 5        Network

                                                                                      20
1   TV 2000 (Other DTT)                                                                                16
Satellite Offer
                   Almost Entirely Pay TV-Driven

                               Others Sat   Others DTT

Other Publishers
  on Mediaset
   Premium                                                           Sky Italia ~4.7m HH
                          Others
                                               RAI Generalist        Tivusat ~2.2m HH
                                                (R1+R2+R3)
         Sky DTT                                                              ~6.9m HH
                   Sky Bouquet Sat
                                                  RAI Multichannel

               La 7

                                       MS Generalist
        MS Multichannel                 (C5+I1+R4)

                                               Mediaset
                                               Premium
                                                 28%

                                     Sky
                                     72%

                                                                                           17
Regional Offer
                   A Patchwork

                               Others Sat   Others DTT

Other Publishers
  on Mediaset
   Premium
                          Others
                                               RAI Generalist
                                                (R1+R2+R3)
         Sky DTT

                   Sky Bouquet Sat
                                                  RAI Multichannel

               La 7

                                       MS Generalist
        MS Multichannel                 (C5+I1+R4)

                                               Mediaset
                                               Premium
                                                 28%

                                     Sky
                                     72%

                                                                     18
Efficient Management of Existing
                       Agreements with National TV Players

• Contracts long term visibility                                          • Supported by:

                                           Interm. Term      Final Term     — Stability of distribution patterns

- Mediaset 7+71                                       2018     2025         — Long term predictable technological
                                                                              evolution
- TIMB 12+6                                           2023     2029
- L’Espresso 12+6                                     2024     2030         — Long term regulatory stability and
                                                                              visibility
- Cairo 32+7+10                                       2024     2034

1   Including 5 MS Muxes + 2 Muxes of third parties
2   Transitional Phase                                                                                              19
Efficient Management of Existing
                      Agreements with National TV Players

Distribution platforms penetration

                                            Italian TV Households                                                 ~24.5

                                                           1
                                            DTT HH                                                                ~23.3m
                                            Penetration %                                                           ~95%

                                            Satellite HH
                                                                  2
                                                                                                                    ~6.9m                 of which
                                                                                                                                        ~4.7m (68%)
                                            Penetration %                                                             28%
                                                                                                                                         is Pay TV

                                            Broadband TV HH                                                           0.7m
                                            Penetration %                                                               3%

1   Data referred to potential penetration; 2014E data sourced by IT Media Consulting
2   Company’s estimates; according to IT Media Consulting, DTT “First access” penetration represents around 70% of total population (17.1m HH)        20
Efficient Management of Existing
         Agreements with National TV Players

• Going forward, it is extremely unlikely to have competition between platforms for
the same service. There will rather be specialization and complementarity

             LINEAR                             NON LINEAR

       DTT/Satellite                 Fixed/Mobile broadband

                                                                                      21
Efficient Management of Existing
         Agreements with National TV Players

• Analogue switch off was completed on July 4th, 2012

• Current standard for Digital Terrestrial Broadcasting: DVB-T
  — Adopted standard for Video of SD programs → MPEG-2/HD programs → MPEG-4
  — Perspective standard for Video of HD programs → HEVC

• Transition to DVB-T2 already on the way
  — Since 2012 newly installed TV transmitters are “DVB-T2 ready” (they can broadcast with
    both standards) → Network evolution to DVBT-2 can smoothly follow substitution for
    obsolescence (~7÷10 years)

• It is unlikely to see full transition to DVB-T2 before 2022÷2024

                        N.B. No Capex for Tower Cos (e.g. EI Towers)…
            …and not even significant Capex for network operators (Mediaset is upgrading in
  parallel with substitution/new network operators are already deploying T2 ready networks)

                                                                                         22
Radio Broadcast

      NATIONAL RADIO OPERATORS                                                          LOCAL RADIO OPERATORS
                      Operators                                Brands
          1. RAI                                                                       1,400
          2. MONRADIO
                                                                                       1,200
          3. ASS. RADIO MARIA
                                                                                       1,000
          4. FINELCO - RADIO STUDIO 105

          5. FINELCO - VIRGIN RADIO                                                      800

          6. FINELCO - RMC ITALIA                                                        600                                              1,194
                                                                                                               1,143
          7. RTL 102,500 HIT RADIO                                                                    958                         955
                                                                                         400
          8. RADIO ITALIA
                                                                                         200
          9. RADIO KISS KISS

          10. ELEMEDIA                                                                    -
                                                                                                          2012                       2014
          11. CENTRO DI PRODUZIONE

          12. RADIO DIMENSIONE SUONO                                                      N. Local Radio Operators   N. Brands Local Radio Operators

          13. IL SOLE 24 ORE

          14. RADIO PADANIA LIBERA
                                                                                    • Stable number of operators
• Stable number of operators                                                        • The number of commercial brands is rising:
                                                                                      +51 brands equal to +4% (2014 vs. 2012)
 Source: Ministry of Economic Development Communication Department (DB operators)                                                                      23
Radio Broadcast

• Radio audience is still, and will likely be for many years to come, terrestrial through
  herzian waves

• Internet radio is widely available for in-house and fixed reception, but most of the
  audience is in cars → current infrastructure is not replaceable

• Radio transmission is still mainly analogue: DAB is being deployed, but no switch
  over is foreseen

                                                                                         24
Analysis of the Reference Markets:
       Mobile TLC Segment

                                     25
Mobile TLC Segment
                                                            Market Overview

                                       • TLC sector in Italy (fixed and mobile)                                                                                                  • Number of mobile lines
                                         Voice traffic volume

                                     500                                                                          70%    70%
                                                                                                           65%
                                                                                                    62%
                                     450
                                                                                      57%                                60%
                                     400                                    53%
Voice traffic (minutes in billion)

                                                                49%

                                                                                                                               Percentage of mobile traffic
                                                                                                                                                                                 120
                                     350              45%                                                                50%
                                                                                                                                                                                                                                                   +3%          +1%          -0.3%
                                                                                                                                                                                 100                        +2%          -1%          +4%
                                     300    38%                                                                                                                                               +12%
                                                                                                                         40%
                                     250                                                                                                                                          80

                                                                                                                                                              Lines in million
                                            219       218       221         219       219           220    223    222
                                                                                                                         30%
                                     200
                                                                                                                                                                                  60
                                             83       98        109         115       124
                                     150                                                             136   145    155    20%                                                                                      91.7                      93.6         96.0         97.2            96.9
                                                                                                                                                                                                     89.8                      90.4
                                                                                                                                                                                  40   80.4
                                     100
                                            136                                                                          10%
                                      50              120       112         104
                                                                                                                                                                                  20
                                                                                       95            84     78     67
                                       0                                                                                 0%                                                        0
                                            2006     2007      2008         2009      2010          2011   2012   2013                                                                 2006          2007         2008         2009         2010         2011         2012           2013

                                                                      Fix    Mobile    Mobile % on Total

                                           Traffic on fixed lines strongly reduced to                                                                                            Total number of lines is relatively stable
                                           the benefit of mobile lines (now >70% of                                                                                              — increase in usage
                                           the total)

                                       Source: Agcom Annual Reports                                                                                                                                                                                                                  26
Mobile TLC Segment
                                              Market Overview

• In the mobile segment, the only service                                                                                  • The overall data traffic shows strong
  with decreasing volumes is Sms                                                                                             increases

                                 120
                                                                                                                          400
                                 100
 Sms traffic (Sms in billions)

                                               +3%          +12%
                                                                          -19%                                            350
                                  80                                                                                                                                                           +33%

                                                                                                Data traffic (Petabyte)
                                                                                                                          300
                                  60
                                                                                                                          250
                                                                   97                                                                                                            +34%
                                  40   84            86
                                                                                 79                                       200
                                                                                                                                                                   +55%                               343
                                  20                                                                                      150
                                                                                                                                                                                        258
                                   0                                                                                      100                        +82%                 192
                                       2010          2011          2012          2013
                                                                                                                           50         +183%                 124
                                                                                                                                               68
                                                                                                                            0    24
                                                                                                                                2008          2009          2010          2011          2012          2013

Source: elaboration of Osservatori Digital Innovation Politecnico di Milano on corporate data; Annual Agcom Reports                                                                                      27
Mobile TLC Segment
                                                               Market Overview

                                      • Despite volume growth, Revenues in both fixed and, to an even greater extent,
                                          mobile segments have been decreasing due to:
                                                 — General economic downturn

                                                 — Strong price competition

                                                                                                                                                                                                                      -1%             -2%
                                                                                                                                                                                                               23.8          23.6                    -4%
                                                                                                                                                                                                                                             23.2                  -3%
                                                                                                                                                                                                          25                                                                    -3%
                                                                                                                                                                                                                                                            22.3                                 -4%
                                                                                                                                                                                                                      +62%                                               21.7                                 -14%
                                                                                                                                                                                                               2.1                   -15%                                             21.1
                                     70    51%          52%          52%           52%          52%          52%           53%           50%                                                                                 3.4              2.9 -24%                                                 20.2
                                                                                                                                                                                                                                                             2.2 -14% 1.9 +21%
TLC Operators Revenues (€ billion)

                                                                                                                                                50%                                                       20                                                                           2.3 +30%

                                                                                                                                                                            Mobile Revenues (€ billion)
                                     60                                                                                                                                                                        6.0 -17%               -8%                                                              3.0           17.4
                                                                                                                                                                                                                             5.0              4.6    -7%     4.3   +7%
                                                  -3%                                                                                                                                                                                                                     4.6 -15%
                                                               -2%           -3%                                                                40%                                                                                                                                3.9                        +13%

                                                                                                                                                      Mobile Revenues (%)
                                     50    46.7                                           -3%          -3%                                                                                                                                                                                   -21% 3.1                3.4
                                                        45.8         44.8                                            -5%                                                                                  15
                                                                                   43.2         41.9                              -10%                                                                         3.8
                                                                                                             40.4                                                                                                     0%     3.8 +21% 4.6            +4% 4.8       +2% 4.9 +10%                               -42% 1.8
                                     40           -1%          -2%           -4%                                           38.4                 30%                                                                                                                             5.4              +4%
                                                                                          -3%          -3%                               34.5                                                                                                                                                          5.6
                                           23.8         23.6         23.2                                            -4%
                                                                                   22.3         21.7                              -14%                                                                    10                                                                                                  -4% 5.4
                                     30                                                                      21.1          20.2
                                                                                                                                         17.4   20%
                                                                                                                                                                                                                      -4%             -3%
                                     20                                                                                                                                                                        11.9          11.4                    -1%
                                                  -3%          -3%           -3%          -3%                                                                                                              5                                 11.1           11.0 -6% 10.3       -8%
                                                                                                       -4%           -6%                                                                                                                                                               9.5 -11% 8.5
                                           22.9         22.2                                                                      -6%           10%
                                     10                              21.6          20.9         20.2         19.3          18.2                                                                                                                                                                               -20% 6.8
                                                                                                                                         17.1

                                      0                                                                                                         0%                                                         0
                                           2006         2007         2008          2009         2010         2011          2012          2013                                                                  2006          2007            2008          2009          2010         2011             2012          2013
                                                                           Fix      Mobile       Mobile % on Total                                                                                                                 Retail voice     Retail Data    Wholesale    Other revenues

                                      Source: elaboration of Osservatori Digital Innovation Politecnico di Milano on corporate data                                                                                                                                                                                  28
Mobile TLC Segment
                                               Market Overview (fix+mobile)

                     • In order to compensate pressure on Revenues, both fixed line operators and MNOs:
                                 — Are looking for efficiency on Opex (pressure to renegotiate agreements)

                                 — Are carefully monitoring Capex

                    12    16%           16%                       15%          15%           15%          16%           16%     16%
                                                      14%                                                                                                                         30%
                                                                                                                                14%                                                                                        26%
                    10                                                                                                                                                                                              25%
                                                                                                                                                                                  25%                                             24%
                                                                                                                                                                                                             23%                         23%
                                  -1%                                                                                           12%
                                               -11%                                                                                                                                     21%    21%    21%

                                                                                                                                      Capex/Revenues (%)
                                                             0%

                                                                                                                                                           (EBITDA-Capex)/Sales
                     8                                                   -5%
Capex (€ billion)

                                                                                      -3%    3.9
                                                                                                    +5%                         10%                                               20%
                                                                                                                 -10%
                     6                                                                                                          8%
                                                                                                                                                                                  15%
                                                                                                                                6%
                     4                                                                                                                                                            10%
                           7.3           7.2
                                                      6.4         6.4          6.1           5.9          6.2                   4%
                                                                                                                        5.6
                     2                                                                                                                                                            5%
                                                                                                                                2%

                     0                                                                                                          0%                                                0%
                          2006          2007          2008        2009         2010         2011          2012          2013                                                            2006   2007   2008   2009   2010   2011   2012   2013
                                 Capex excluding licenses         Licenses           Capex % on Revenues (excluding licenses)

                     Source: elaboration of Osservatori Digital Innovation Politecnico di Milano on corporate data                                                                                                                        29
Mobile TLC Segment
                      Wi-Fi and Wi-Max Operators

WI-FI AND WI-MAX OPERATORS                                    MARKET KEY ELEMENTS
                                                               • Auctions on regional/provincial basis, for
                             ~1,000           operators1         the creation and activation of internet
                                                                 access networks
                                                               • Development of LTE technology

                                                              COMMERCIAL ACTIVITY RATIONALE
                                                               • Development of the offer of hosting and
                                                                 fiber integrated services
                                                               • Identification of local operators with
                                                                 growth opportunities
                                                                                                                     “Long-List”

                                                                   Step 1                                 Creation DB Wi-Fi and Wi-Max operators

                3 Relevant EI Towers Clients                                                               (~ 1,000 operators Ministry Database)                                     Preliminary
                                                                                                                                                                                       analysis

               (EIT FY2013 Revenues: €2.1m; FY2014E: €2.2m)                 Step 2                         Pre-analysis (geographic collocation)

                                                                                                                                                                 Assessment and
                                                                                     Step 3                     Assessment with Sales Dept.                      identification of
                                                                                                                                                                  operators with
                                                                                                                                                                     growth
                                                                                              Step 4              Integration DB Operators                        opportunities

                                                                                                                      Hp Development
                                                                                                       Step 5           commercial                 Detailed analysis
                                                                                                                          proposal

                                                                                                                     “Short-List”
1   Ministry of Economic Development, April 2014                                                                                                                                         30
Business Plan Financials

                           31
Business Plan Financials
           Key Assumptions & Perimeter

• EI Towers Revenue contracts are CPI-linked and almost entirely adjusted to Year-End CPI

• Italian CPI Assumptions:
  —   YE2014E   (FY2015E   Revenues): 0%
  —   YE2015E   (FY2016E   Revenues): 0.75%
  —   YE2016E   (FY2017E   Revenues): 1.0%
  —   YE2017E   (FY2018E   Revenues): 1.0%

• Business Plan Activity Perimeter:
  — Including:
    » Cairo Mux contract
    » Development of 100 new mobile TLC sites by Towertel
    » 3 “Mom and Pop” tower portfolios acquisitions (Hightel, 1 mobile, 1 broadcast)

  — Excluding:
    » 4 “Mom and Pop” tower portfolios in the radar screen (3 mobile, 1 broadcast)
    » Development of new mobile TLC sites under the Hightel frame agreement
    » Transformational M&A in mobile/broadcasting segments

                                                                                            32
Business Plan Financials
                       Revenues Segment Projected Growth

• Revenues 2014/18E CAGR1 by segment:

       — National TV Broadcasters: ~+2%2

       — National Radio: flat
                                                                                                                                                Total Revenues
       — Mobile Network Operators: ~+7%3                                                                                                        2014/18E CAGR
                                                                                                                                                     ~+3%
       — Other TLC Technologies (Wi-Fi, Wi-Max): ~+5%

       — Local TV & Radio, Others: ~-1%

1   CAGR based on FY2013 actual figures                                                           3 Hightel acquisition consolidated, excluding the contract for the development of new sites
2   Under the hypothesis that current contract with main TV national client (Mediaset Group) will be renewed at same terms and conditions                                                       33
Business Plan Financials
                      Profit & Loss Headlines

• Steady margin accretion, notwithstanding the low CPI assumptions

                                                                                                1
    Data in €/m
                                          2013   2014E 2015E 2016E 2017E 2018E      CAGR 2014-18E

    Revenues                              233    234    241   244     253    264         3%

    EBITDA                                106    110    114   116     127    136         5%
    margin%                               45%     47%   47%   48%     50%    52%

    EBIT                                   58     67    73     76     89     101         12%

    CPI Assumptions                                      -    0.75%   1.0%   1.0%

1   CAGR based on FY2013 actual figures                                                             34
Business Plan Financials
                                            EBITDA Bridge1

• Total Net Efficiencies: ~€13, of which:
       — €4m in 2014E (31% of Total)
       — €9m cumulated in 2015E-18E (69% of Total)
                                                                                                                                                                                                                                                 7.0              2.5
       Data in €/m
                                                                                                                                                                                                             3.5
                                                                                                                                                                                            6.8
                                                                                                          3.0                                     1.9                0.5
                         4.0                 0.4                                       1.1                                       0.1

                                                                     (0.3)

                                                                                                                                                                                                                                                                  134                136
                                                                                                                                                                                                                                127              127
                                                    110              110                                        114              114                                       116              116
        106                                 109.6
                                             M&A

                                                                                                          M&A

                                                                                                                                                                     M&A
                                                                      Organic Growth

                                                                                                                                 Organic Growth

                                                                                                                                                                                            Organic Growth

                                                                                                                                                                                                                                                 Organic Growth
                         Net Efficiencies

                                                                                       Net Efficiencies

                                                                                                                                                  Net Efficiencies

                                                                                                                                                                                                             Net Efficiencies

                                                                                                                                                                                                                                                                  Net Efficiencies
                                                    FY2014E EBITDA

                                                                                                                FY2015E EBITDA

                                                                                                                                                                           FY2016E EBITDA

                                                                                                                                                                                                                                FY2017E EBITDA

                                                                                                                                                                                                                                                                                     FY2018E EBITDA
         FY2013 EBITDA

1   EBITDA absolute values are rounded figures                                                                                                                                                                                                                                                        35
Business Plan Financials
                      EBITDA Growth Breakdown

•        EBITDA will grow by ~€30m over the Business Plan period (FY2014-18E), driven by:

       — Organic Growth1: ~€13.6m

            »      In a very low CPI scenario, EBITDA organic growth will be mainly concentrated in the last two years

       — Visible “Mom and Pop” M&A transactions, contributing almost ~€4m

       — Net Cost Efficiencies: ~€13m

•        Search for new efficiencies will be a continuous effort in order to enhance the cash flow
         profile of the Company

1   Including Cairo contract under a base case scenario (penalty of €2m) and the development of 100 new TLC sites by Towertel   36
Business Plan Financials
         More Colour on Efficiencies

• In the first two years of activity, EI Towers was able to deliver 2012-16E old
  Business Plan efficiency targets three years ahead on schedule:
  — €15m of P&L Net Efficiencies
  — Strong Ordinary Capex Reduction
    » Old target 2012-16E: €20m per annum
    » FY2013: €10.2m

• FY2014 will show the continuous focus on G&A/Opex/Ordinary Capex
  — EBITDA guidance: ~€110m (benefitting from €4m of additional efficiencies vs FY2013)
  — New Ordinary Capex Guidance: €11m

• Current and future actions over the new Business Plan time horizon will be more
  surgical and will keep on addressing Opex/Ordinary Capex
  — Fine tuning on Opex (supply of Goods and Services) and Ordinary Capex
  — Analysis focused on other cost categories (e.g. technology)

                                                                                          37
Business Plan Financials
                      Cash Flow Profile

• “EBITDA-Ordinary Capex”, one of the most important metrics, will grow up to
  €125m with a 6% CAGR

                                                                                                       1
     Data in €/m                          2013   2014E 2015E 2016E 2017E 2018E            CAGR 2014E-18E

    EBITDA                                106    110     114      116       127    136          5%

    ORDINARY CAPEX                        (10)   (11)    (12)     (12)      (12)   (11)
DEVELOPMENT CAPEX                                   -     (7)         (1)    -      -
M&A CAPEX                                         (22)   (11)          -     -      -

    TOTAL CAPEX                           (10)    (34)   (30)     (13)      (12)   (11)

    EBITDA - CAPEX                         95     76      84          103   115    125

    EBITDA - ORDINARY CAPEX               95      99     101      104       115    125          6%

                                                               +32%

1   CAGR based on FY2013 actual figures                                                                    38
For more information please contact:

Vincenzo Mangiaracina
Head of Investor Relations
Tel: +39 039 24321
e-mail: investor.relations@eitowers.it

                                         39
You can also read