The use of statistics by Pôle emploi for purposes of cyclical analysis and forecasting of future needs in the labour market - March 2018 - St ...
←
→
Page content transcription
If your browser does not render page correctly, please read the page content below
The use of statistics by Pôle emploi
              for purposes of cyclical analysis and forecasting of
                       future needs in the labour market

                             March 2018 – St Petersbourg

                            François Aventur – Pôle emploi
                     Department of Statistics, Studies and Evaluation

1   03/2018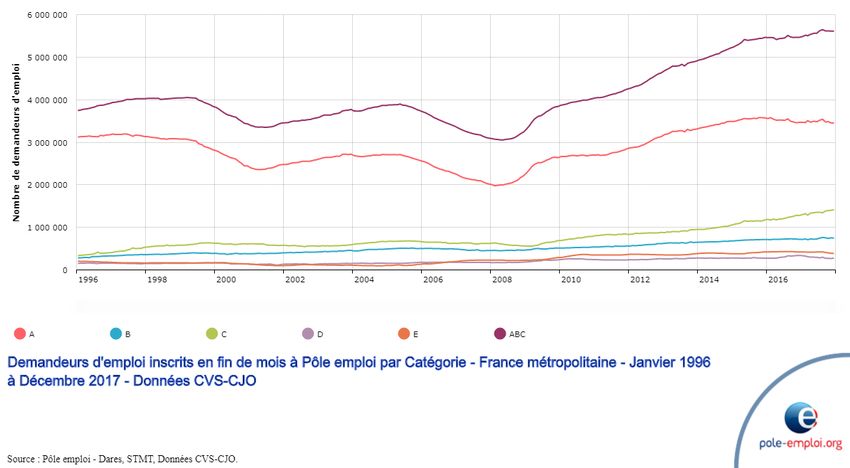
Statisticians and economists at Pôle emploi

    - Directorate General: approximately 60 staff in the Department of Statistics, Studies
        and Evaluation
    - Regional Offices: approximately one hundred employees.

    Two tasks:
      1) Helping to improve efficiency in Pôle emploi's activity:
            - Providing Pôle emploi employees, jobseekers and employers with accurate and
              relevant job-market information: local assessments, changes in occupations and
              qualifications, labour needs etc.
            - Equipping those employees in charge of managing Pôle emploi's operations;
            - Evaluating the measures employed by Pôle emploi.
      2) Improving awareness of the labour market by using the information gathered by
      Pôle emploi : Project management of the business intelligence information system,
      publication of statistics and studies, provision of data for researchers and other
      organisations etc.
2    03/2018
Plan of intervention
Statistical sources for the labour market
Cyclical labour market analysis indicators produced by Pôle
emploi
Projected labour needs by occupation
3 03/2018Information held in the Pôle emploi information system:
administrative data on jobseekers
• In-house sources: data collected as part of the administration of the jobseekers'
list:
– Jobseeker characteristics (sex, age, qualifications, location, part-time, occupation sought
etc.)
– Trajectory of registered jobseekers (seniority, recurrence etc.)
– Support, services, training, aid measures
– Unemployement benefits
• Outside sources:
– Declarations prior to hiring – DPAE : declarations which employers must make to Social
Security before hiring (since 2012): recruitment in private sector jobs, excluding private
individual employers (possibility of matching jobseekers' files)
– Information on payment of Active Solidarity Income (RSA – minimum income)
4 03/2018Information held in the Pôle emploi information system:
administrative data on employers
• In-house sources: data collected as part of the administration of offers registered
with Pôle emploi
– Job offers registered with Pôle emploi (characteristics of the employment contract,
occupation, activity sector, geographical location etc.)
– Offer outcome (completion time etc.)
In recent years, Pôle emploi has been receiving and giving out job offers from partner
sites (job boards etc.): a new information source.
• Outside sources:
– Monthly statements from temporary employment agencies: all temporary jobs (employee
and job characteristics: activity sector, duration etc.)
– Under implementation: electronic payroll reporting (DSN). Based on employees' pay, this
single statement replaces a variety of social security declarations. A rich source of information
on job characteristics and trajectories (employer, occupation, salary, contract type etc.)
5 03/2018Administrative sources are complemented by surveys
• Position of jobseekers after leaving unemployment lists, and more broadly,
their trajectories:
– Survey of those leaving the Pôle emploi unemployment lists (with the Ministry of Labour): job-
finding rates, characteristics of jobs found;
– Survey of those leaving training (returning to work etc.);
– "Newcomers" panel (a cohort every two years).
• An annual survey of employers' "labour needs" (BMO)
• Special surveys mainly for the evaluation of Pole emploi’ services:
– Mobility assistance;
– Support of jobseekers;
– Jobs that are difficult to fill;
– etc.
6 03/2018Plan of intervention
Statistical sources
Cyclical labour market analysis indicators produced by Pôle
emploi
Projected labour needs by occupation
7 03/2018Cyclical indicators: number of jobseekers registered with
Pôle emploi
Until 2017 : Monthly publication, jointly with the statistical service of the Ministry of
Labour (Dares), of the number of jobseekers registered with Pôle emploi:
- earliest information on the latest situation in the labour market;
- Comprehensive data: no confidence interval related to sampling.
Limitations:
- the information available, and especially the quality thereof, depends on the
value of variables for operational management (e.g.: reason for registration);
- the series are subject to changes in operating rules (e.g. cancellations due to
sanctions), or other impacts (SFR bug).
- Very (too) important media coverage.
Since 2018 : quarterly publication on average stocks and flows, favouring a trend
analysis over several months
8 03/2018Cyclical indicators: number of jobseekers registered with
Pôle emploi
Source: STMT, Pôle emploi – Dares. CVS-CJO data (seasonally adjusted and working day adjusted data),
Metropolitan France
9 03/2018Jobseekers registered with Pôle emploi and unemployment
according to the ILO
The French National Institute for Statistics and Economic Research (INSEE)
publishes quarterly unemployment levels according to the International Labour Office.
Survey assessment.
An unemployed person is someone who:
- has not worked a single hour during the reference week;
- is available to work within two weeks;
- has actively searched for work in the previous month (or has found a
job that starts within three months).
10 03/2018ILO jobseekers and unemployed (thousands,
Metropolitan France)
Sources: DEFM (job seekers at the end of each month) A: STMT, Pôle emploi – Dares; cvs-cjo data
(seasonally adjusted and working day adjusted data)
11 04/05/2015 ILO unemployed: Emploi survey, Insee, cvs data (seasonally adjusted data)Level of return to work
In order to remain on the Pôle emploi lists, jobseekers are required to give monthly
status updates (and confirm that they are still seeking employment).
A significant number of jobseekers leave the lists simply by failing to update their
status and without giving any reason to Pôle emploi: some 40% of leavers.
Since 2002, Pôle emploi and the Ministry of Labour have carried out a quarterly survey
(annually since 2018), based on a sample of those leaving the lists, to establish the
real reason for leaving and, where appropriate, the characteristics of the job obtained:
-> approximately half of all terminations due to failure to update and between
a quarter and a third of administrative cancellations (most often due to jobseekers not
turning up for an interview) are actually due to job-finding.
12 03/2018Level of return to work
Since 2012, Pôle emploi has had access to "Declarations Prior to hiring" (DPAE - declarations
which employers must make to Social Security before hiring): when matched to Pôle emploi
files, this gives them a source of administrative information on returns to work.
Return to work indicators combine the DPAE declarations with other information held in Pôle
emploi administrative files (jobs declared by jobseekers).
These indicators are increasingly used by Pôle emploi:
- Management by results;
- Analysis of trajectories following Pôle emploi training or services (assessments).
Compared with the survey of Leavers, the use of the DPAE declarations has two advantages:
- lower cost (data collected elsewhere);
- thoroughness allows for a more detailed range (agency, jobseeker category,
occupation sought etc.).
13 03/2018Level of return to work
Quarterly number of jobseekers returning to work registered with Pôle emploi (job
duration at least 1 month)
1.086.600
1.049.200
1.033.100
1.000.500
987.700 988.700
972.900 970.400
954.600 951.900
903.300 899.100
882.800 888.400
869.000
853.800 853.500
842.300
14 03/2018Duration of unemployment
It is difficult to interpret the changes in average length of time jobseekers
remain on the lists as this depends not only on current circumstances but also
on the past.
Example: In times of sudden economic downturn, many jobseekers register on
the lists, and average duration decreases. Average duration only increases as a
second step.
Consequently, we introduced the cyclical indicator of unemployment
duration (ICDC): the ICDC aims to measure the opportunities for leaving the lists
on a given date. This is a matter of assessing the average duration of
unemployment of a hypothetical cohort of jobseekers who, throughout the period
of their unemployment, would experience the same labour market conditions
(level of leaving the lists) as those of the current quarter.
15 03/2018Duration of unemployment (ICDC)
Duration of registration with Pôle emploi, measured by the cyclical indicator of
unemployment duration (days)
16 03/2018Plan of intervention
Statistical sources
Cyclical labour market analysis indicators produced by Pôle
emploi
Projected labour needs by occupation
17 03/201810 year job plan: the PMQ project
Project coordinated by France Stratégie (an expert consultation body
reporting to the Prime Minister) and Dares (the Ministry of Labour's statistical
service), and involving many partners
Regularly renewed project (restarting in 2018, with horizon 2030)
Latest report (2015): Jobs in 2022
Estimate of "vacancies" by occupation over a period of ten years:
Retirements per occupation;
Net creation / elimination of jobs per occupation:
- Model of job changes by activity sector, based on various macroeconomic
scenarios;
- Job forecasts are calculated by occupation, based on past occupational trends
within each sector and as determined by experts
18 03/201810 year job plan: the PMQ project
In thousands
Cleaners
Home helps
Teachers
Executives in administrative, accounting and financial services
Health care aides
Sales staff
Drivers
Nurses
Administrative staff in the public service (category C and
equivalent)
Commercial and technical sales executives
Shop managers and middle-managers in sales
Childminders
Public service executives (category A and equivalent)
Skilled workers in building and finishing trades
Administrative, accounting and financial services technicians
Research and study staff
Sales representatives and agents
Arts and entertainment professionals Retirements
Maintenance technicians and assistant managers
Computer engineers Net job creation
19 03/201810 year job plan: the PMQ project
Some lessons learned from PMQ:
The majority of the vacancies correspond to retirement replacements;
A relative polarisation of employment qualifications;
Continued tertiarisation and feminisation;
Territorial disparities.
20 03/2018Pôle emploi's annual survey of labour needs (BMO)
An annual survey by Pôle emploi covering 2.3 million establishments:
Private sector establishments;
Establishments with 0 employees who have made a declaration of hiring during
the previous 12 months;
Agricultural sector establishments;
The institutions of the public sector under the juridiction of the local authorities,
public administration employers (hospitals, local authority associations etc.).
In total: all employers apart from government departments, public enterprises and
households.
It identifies employer hiring intentions and questions them about
recruitment difficulties they might foresee.
It shows the needs of businesses by detailed occupations (200
occupations) and, at a detailed geographical level, by employment
zones (412 zones).
21 03/2018Why have a BMO survey?
BMO (labour needs) is a rich and detailed source of information on business
labour needs.
The results, with a fine level of geographical detail, are a useful addition to the
territorial diagnostic studies conducted by Pôle emploi teams and its associates.
The data gathered helps to identify short-staffed sectors.
The survey helps to define the training procurement policy.
The survey helps to improve the understanding of recruitment difficulties
which employers face and, thus, helps Pôle emploi to adapt the services which it
offers.
22 03/2018The BMO survey : 2 components
"Main BMO":
- The questionnaire is held every October, and is focused on recruitment
projects for the following year.
- For each occupation, the employer is questioned about:
- the number of recruitment projects;
- if these projects are thought to be difficult;
- what proportion of these projects is of a seasonal nature.
Paper questionnaire (web experiment for the last two years).
"Supplementary BMO": applied to a subsample by means of a telephone
questionnaire.
As well as the main BMO questions, employers are asked about:
- details of recruitment difficulties encountered;
- types of contracts;
- recruitment procedures.
23 03/2018The BMO survey: sampling and adjustment
The draw of establishments to be surveyed is made in two stages:
Approximately 70,000 establishments are drawn for the supplementary
BMO survey;
Among the establishments not selected for supplementary BMO, the main
BMO sampling is determined:
- all establishments with 10 or more employees;
- a sample of establishments with fewer than 10 employees.
The establishments are contacted again by telephone, using the quota
method (size x activity sector x employment sector x public/private sector).
2017 edition: 1.6 million companies surveyed; 436,000 responses (20 000 for
supplementary BMO).
Data corrected: size x activity sector x employment zone x public/private
sector.
24 03/2018Main results of the 2017 BMO survey
Growth in the number of recruitment projects Distribution of the number of recruitment projects by
establishment size (as a %)
Rise in recruitment Strongly increasing recruitment
projects: + 8,2% projects in companies with fewer
(+ 149 200) than 5 employees (+ 14%)
39% of seasonal projects
25
03/2018Intended recruitment is concentrated in services
Company services Personal services
Real estate activities (+4%) Industry
Construction Public administration,
Financial activity (+4,7%) (+8,7%)
(+22.5%) Agriculture teaching (-0,9%)
(+6,4%)
Transportation and Trade 4 8
storage (+15,1%) (+10,2%) 11
12 Other service activities
(+4,2)
IT and communication
(+9,7%)
24
Health and social work
(+10,0%)
41
Scientific services,
admin. & support (+8,4%) Focus on
Focus on
services to
personal services
businesses
(+5,7%)
(+9,3%) Accommodation and
restaurant sector
(+6,3%)
03/2018Rise in foreseen recruitment difficulties
Changes in difficult projects (as a %)
Rise in recruitment difficulties in 2017,
after a downward trend during the
previous years
Difficulties are more frequent in
establishments with fewer than 50
employees
27
03/2018The 15 occupations most sought after by employers
1st quadrant 4th quadrant
80% (Not very seasonal Home helps, (strong seasonality and difficult)
Extremely difficult) household
assistants
70% Engineers,
research Sales assistants in clothes,
accessories and luxury
items, Sport, leisure and
culture
& IT R&D managers, Cooks
60% IT manager Café and
restaurant
% of difficult recruitments
Nursing assistants Kitchen helps, waiting staff Agricultural
(medical & social, child apprentices and employees, farm
50% carers, medical assistants, staff workers
etc.) Hotel
staff
40%
Cleaning
30% staff
Vineyard
Professionals
of social and workers, fruit
cultural growers,
Each bubble size
20% Artists Self-service activities pickers
is proportional
(in music, dance, employees
entertainment, to the number of
including art recruitment
teachers)
projects. Jobs
10% 2nd quadrant Unskilled workers 3rd quadrant:
with a growing
(low seasonality, not very difficult) In packaging and handling staff (strong seasonality, not very difficult)
number of
projects
0% compared to
% of seasonal recruitments 2016, are in
yellow, and
reductions in the
number of
projects are
shown in red.
28 average
03/2018Recruitment difficulties anticipated by companies
REASONS
Establishments (as a %)
Unsuitability of candidate 81
profiles
Candidate shortage 80
Working conditions
proposed
53
Financial resources 26
Poor image 18
Access to the
workplace
16
29
03/2018Operational use of BMO
By Pôle emploi:
can target prospective companies based on their recruitment
prospects and on Pôle emploi's capacity to respond by utilising jobseekers'
portfolios (unless the companies have replied to say they do not wish to be
contacted);
can guide training procurement policies;
can give insights into recruitment difficulties and can adapt to the
offer of services.
By web users (both jobseekers and companies):
the survey results are available online and it is possible to see the most
sought-after occupations in each employment zone, the occupations which
present the greatest difficulties for recruitment etc.
30 03/2018www.pole-emploi.org
Statistics and analysis section
31 03/2018You can also read