2 018 PHILADELPHIA STATE OF CENTER CITY - Center City District
←
→
Page content transcription
If your browser does not render page correctly, please read the page content below
2 018
STATE OF CENTER CITY
PHILADELPHIA
2 018
STATE OF CENTER CITY
PHILADELPHIA

660 CHESTNUT STREET PHILADELPHIA, PA 19106 | 215.440.5500 | CENTERCITYPHILA.ORG
CONTENTS
                                                                                            INTRODUCTION & OVERVIEW         1

                                                                                            OFFICE                          8

                                                                                            HEALTHCARE & HIGHER EDUCATION   15

                                                                                            CONVENTIONS, TOURISM & HOTELS   21

                                                                                            ARTS, CULTURE & ENTERTAINMENT   27

                                                                                            RETAIL                          31

                                                                                            EMPLOYMENT                      37

                                                                                            TRANSPORTATION & ACCESS         46

                                                                                            DOWNTOWN LIVING                 51

                                                                                            DEVELOPMENTS                    61

                                                                                            CENTER CITY DISTRICT            66

                                                                                            ACKNOWLEDGEMENTS                75

CENTER CITY DISTRICT & CENTRAL PHILADELPHIA DEVELOPMENT CORPORATION | CENTERCITYPHILA.ORG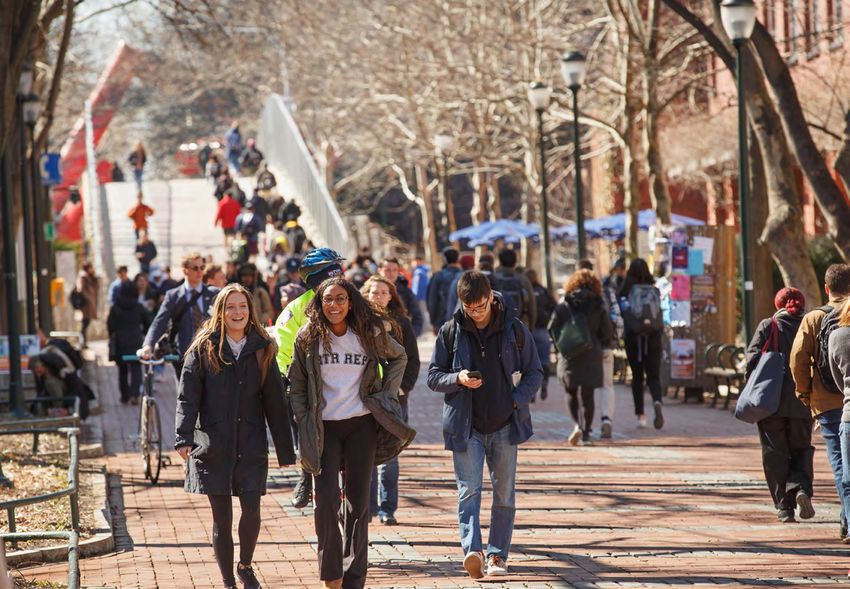
INTRODUCTION
Philadelphia Skyline | We Film Philly

                                        ACCELERATING GROWTH DOWNTOWN: Philadelphia is enjoying
                                                                                                                   & OVERVIEW       square feet of space. Education and health services, the largest
                                        the longest period of economic expansion in the last 50 years,                              sector citywide, is the second largest downtown with jobs
                                        adding 55,100 jobs since 2010 and showing positive growth in all                            provided by 15 colleges and universities and five hospitals,
                                        but one year since 2005. In 2016, Philadelphia added a record                               accounting for 20% of Center City employment. Entertainment,
                                        13,600 jobs; in 2017, the city added another 10,700 jobs. Growth                            leisure, hospitality and retail provide 16% of downtown jobs in
                                        has been driven entirely by private-sector gains, with public-                              243 arts and cultural institutions, 11,675 hotel rooms, 992 retail
                                        sector employment continuing a 25-year trend of contraction.                                premises and 453 full-service restaurants. Federal, state and
                                        By local standards, this is very good news. By national, urban                              local government employment provides 12% of Center City jobs.
                                        standards, things should be significantly better.
                                                                                                                                    Located at the center of the region’s transit and highway
                                        Center City is the largest place of employment in the city                                  network, 48% of downtown jobs are held by commuters from
                                        and region, holding 42% of Philadelphia’s jobs with 298,612                                 outside the city who pay the city wage tax and also patronize
                                        wage and salaried positions and another 9,000 self-employed                                 downtown restaurants, retailers and cultural institutions; 53%
                                        individuals, freelancers and those compensated as partners.                                 of jobs are held by Philadelphia residents, with the city’s share
                                        Other growth areas include University City, with 11% of city jobs,                          of jobs steadily increasing as the downtown population has
                                        and the fast growing Navy Yard, with 1% of the city’s jobs. Since                           grown. This vibrant live-work core is just 6% of the city’s land
                                        2005, the balance of Philadelphia has continued to lose jobs at                             area, but generates 32% of all property tax revenue for the city
                                        the rate of 0.4% per year.                                                                  and the Philadelphia School District, and accounts for close to
                                                                                                                                    50% of the wage tax generated by jobs in Philadelphia.
                                        Diversification is the defining strength of the downtown
                                        economy. Professional, business and financial services, real                                Public transportation makes possible a level of density and
                                        estate and information — prime office-using industries —                                    accessibility unmatched in the region, concentrating jobs at
                                        account for 40% of downtown jobs, occupying 41.2 million                                    59 per acre in Center City and at 38 per acre in University City,

                                        CENTER CITY DISTRICT & CENTRAL PHILADELPHIA DEVELOPMENT CORPORATION | CENTERCITYPHILA.ORG                                                                       1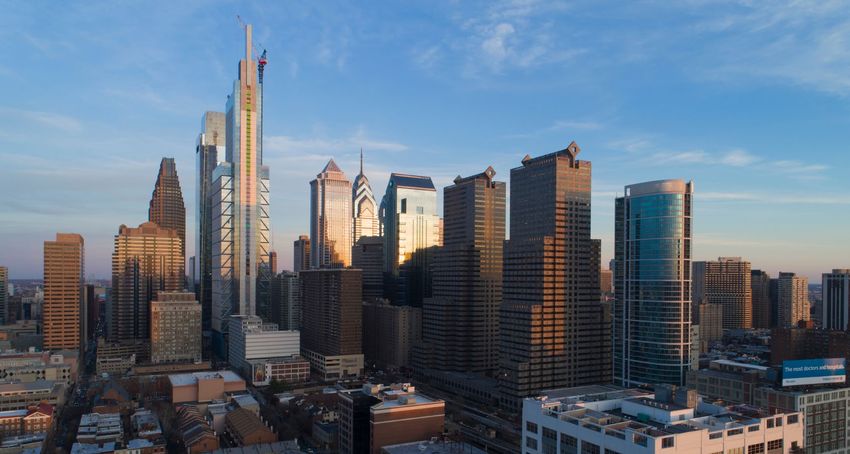
INTRODUCTION

    NUMBER OF NEIGHBORHOOD AND REGIONAL RESIDENTS
    WHO WORK DOWNTOWN
                                                                                                                                                         DOWNTOWN JOBS
                                                                                                                                                         BY EDUCATION LEVEL

                                                                                                                                                                    37.1%                32.9%
                                                                                                   27,800
                                          29,400
                                                                                                   WORKERS
                                                                                                                                                                                 30.0%
                                          WORKERS

    78,000                                                                                                                                               32.9%           HIGH SCHOOL OR LESS
    WORKERS FROM
    SUBURBAN
    PENNSYLVANIA                                                          25,800                                                                         30.0%           SOME COLLEGE/ASSOCIATE
                                                                          WORKERS                                                                        37.1%           BACHELOR’S DEGREE OR MORE

                                                                                                                                                         WHERE DOWNTOWN WORKERS LIVE
                                                      GREATER

                        26,200                       CENTER CITY
                                                                                         32,100
                        WORKERS                   298,612                                WORKERS FROM                                                                               11.1%
                                                        JOBS                             SUBURBAN NEW JERSEY

                                                                                         33,200                                                                     47.5%
                                                                                                                                                                                         41.4%
                                                                                         RESIDENTS OF GREATER CENTER

                                           14,500                                        CITY WORK DOWNTOWN
                                                                                         +9,000 partners, freelancers
                                           WORKERS                                       & self-employed

                                                                                                                                                         11.1%
                                                                    3,200                                                                                41.4%
                                                                                                                                                                         GREATER CENTER CITY
                                                                                                                                                                         ELSEWHERE IN PHILADELPHIA
                                                                    WORKERS FROM SUBURBAN
                                                                    DELAWARE/MARYLAND
                                                                                                                                                         47.5%           OUTSIDE PHILADELPHIA
         Source: U.S. Census Bureau, Local Employment-Household Dynamics, 2015,
         Bureau of Labor Statistics, Current Employment Statistics 2017, CCD Estimates                                               Source: U.S. Census Bureau, Local Employment-Household Dynamics, 2015

    compared to 4 per acre in the rest of Philadelphia and less than                                       the new jobs, while Philadelphia shed 4,400 jobs in financial
    1 per acre in the suburbs. Transit accessibility also enables                                          activities and information services, the city’s highest wage jobs.
    25% of the workers living in city neighborhoods outside Greater
                                                                                                           While private sector growth was particularly strong in 2016
    Center City to commute to jobs downtown; another 6% work
                                                                                                           and 2017, with the city’s rate surpassing that of the region and
    in University City. In all of these neighborhoods, more people
                                                                                                           nearly catching up with the nation as a whole, Philadelphia has
    work downtown than in the area where they live. While 37% of
                                                                                                           not kept pace with the rate of employment growth in America’s
    Center City jobs require at least a bachelor’s degree, 30% are
                                                                                                           26 largest cities, with size determined by the number of jobs.
    accessible to those with an associate’s degree, and another 33%
                                                                                                           Since 2009, the largest cities have been outperforming the
    require no more than a high school diploma.
                                                                                                           national economy and adding private sector jobs at an average
    But job growth in Philadelphia is uneven. Education and health                                         of 2.3% per year, compared to only 1.4% in Philadelphia. The
    services, largely exempt from real estate and business taxes,                                          recent positive trends were sufficient to lift Philadelphia above
    accounted for 56% of the jobs added since the recession; lower                                         Baltimore’s and Memphis’s rates of growth, but still behind
    wage, leisure, hospitality and retail employment — important                                           23 other cities, including Boston, Detroit, New York City,
    entry level positions — accounted for 37% of the growth;                                               Washington D.C., as well as the national rate of growth of 1.7%
    professional and business services accounted for 20% of                                                per year. As a result, in nearly every category of employment,

    2                                                                                                              CENTER CITY DISTRICT & CENTRAL PHILADELPHIA DEVELOPMENT CORPORATION | CENTERCITYPHILA.ORG
INTRODUCTION

AVERAGE ANNUAL GROWTH BY INDUSTRY, 2009–2017

                                                                                   PHILADELPHIA     PHILADELPHIA MSA        LARGE US CITIES AVERAGE*                          US NATIONAL AVERAGE
 Total Private                                                                              1.4%                1.1%                                          2.3%                                      1.7%
  Mining, Logging, and Construction                                                         2.2%                1.5%                                          2.5%                                      1.6%
  Manufacturing                                                                          -3.0%                 -1.0%                                          0.5%                                      0.6%
 Transportation, Utilities, and Wholesale Trade                                             1.0%                0.6%                                          2.0%                                      1.4%
  Retail Trade                                                                              0.9%                0.4%                                          1.7%                                      1.1%
  Financial Activities and Information                                                   -1.0%                  0.0%                                          1.5%                                      0.7%
  Professional and Business Services                                                        2.3%                1.7%                                          3.2%                                      2.7%
  Education and Health Services                                                             1.8%                2.1%                                          2.7%                                      2.1%
  Leisure and Hospitality                                                                   3.2%                2.4%                                          3.4%                                      2.6%
  Other Services                                                                            0.6%                0.2%                                          1.3%                                      0.9%
This includes the 26 largest cities, with size determined by the number of jobs.                                                                 Source: Bureau of Labor Statistics, Current Employment Statistics

except construction and hospitality, the nation’s top cities                                       further. This would have expanded the tax base, increased
outperformed rates of growth in Philadelphia. Looking in the                                       demand for neighborhood housing and generated additional tax
rear-view mirror, we have come very far. Glancing out of the                                       revenue for the city and schools without raising rates. But not
side windows, we see peers passing us by.                                                          counting people who have ceased looking for work, an average
                                                                                                   of 43,600 Philadelphians remained on the unemployment rolls
Our past dependency on industrial jobs can no longer
                                                                                                   throughout 2017 and population continued to decline in many
suffice to explain slow growth. Other Northeast cities that
                                                                                                   older neighborhoods. Those with jobs often follow them to the
hemorrhaged manufacturing rebounded through more robust,
                                                                                                   suburbs. Despite success downtown, 62,000 more residents
post-industrial growth. Using 1970 as the baseline, New York’s
                                                                                                   of city neighborhoods since 2010 decamped for homes in the
total employment is up 11% and Boston and Washington, D.C.
                                                                                                   suburbs than moved in and Philadelphia's 25.7% poverty rate
are both up 23%. By contrast, Philadelphia has 26% fewer jobs
                                                                                                   is the highest of the 10 largest U.S. cities.
than it did in 1970. Philadelphia’s tax structure, with its unique
dependency of taxing what easily moves — employee wages
and business revenues — is out of sync with hyper-mobile,
21st century, post-industrial realities.                                                           GREATER CENTER CITY WAGE & SALARY
                                                                                                   EMPLOYMENT
This is a prime reason for Philadelphia’s high poverty and
unemployment rates and why 40% of working residents from
                                                                                                   23.4%   PROFESSIONAL/
each City Council District outside of the downtown (211,000                                                BUSINESS SERVICES
                                                                                                                                   OFFICE JOBS

workers) are reverse commuting to the suburbs each day.
                                                                                                   16.3%   FINANCIAL ACTIVITIES/
Educational levels required for jobs in the suburbs are not                                                REAL ESTATE/
significantly different than those in the city. The suburbs simply                                         INFORMATION
have more jobs and, until recently, continued to add them                                          20.0%
                                                                                                                                                            298,612
                                                                                                           EDUCATION AND
faster. Despite recent growth, we are digging out of a deep                                                HEALTH SERVICES
hole: Philadelphia still has 5% fewer jobs than in 1990, while                                     12.1%   PUBLIC ADMINISTRATION
our suburbs are up 26%.                                                                                                                                                 TOTAL JOBS
                                                                                                   11.6%   ENTERTAINMENT/
                                                                                                           LEISURE/HOSPITALITY
If local growth since 2009 had been robust enough just to
make us average, attaining the 2.3% per year rate of growth                                         5.7%   TRANSPORTATION/
                                                                                                           UTILITIES/WHOLESALE TRADE
of America’s largest cities, Philadelphia would have added an
extra 45,400 jobs on top of existing growth of 55,100 for a total                                   4.3%   RETAIL
of 100,500 new job opportunities. The city’s unemployment                                           1.8%   CONSTRUCTION                                               +9,000
rate, which dropped from above 10% in the depths of the Great                                       0.5%   MANUFACTURING                          PARTNERS, FREELANCERS & SELF-EMPLOYED
Recession to 6.2% in 2017 — still two percentage points higher
                                                                                                    4.5%   OTHER SERVICES
                                                                                                                                                        Source: U.S. Census Bureau, Local Employment-Household
                                                                                                                                                                        Dynamics, 2015; Bureau of Labor Statistics,
than regional and national averages — could have dropped                                                                                                             Current Employment Statistics; CCD Estimates

CENTER CITY DISTRICT & CENTRAL PHILADELPHIA DEVELOPMENT CORPORATION | CENTERCITYPHILA.ORG                                                                                                                       3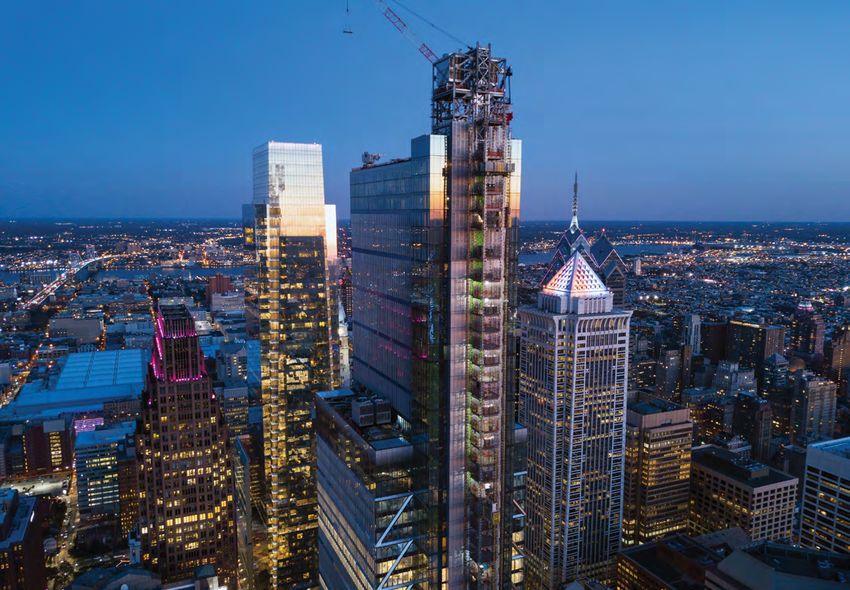
INTRODUCTION

    EDUCATIONAL ATTAINMENT, POPULATION
    25 AND OVER, 2016

                                                                                                   61%
                                                                                                   OF GREATER CENTER CITY RESIDENTS HAVE A
                                                    HIGH SCHOOL OR LESS

                                                    SOME COLLEGE
                                                                                                   BACHELOR’S DEGREE OR HIGHER, A POWERFUL
                                                    BACHELOR'S DEGREE                              ATTRACTOR FOR BUSINESSES SEEKING TALENT,
                                                    ADVANCED DEGREE
                                                                                                   BUT A MARKED CONTRAST WITH SURROUNDING
                                                                                                   NEIGHBORHOODS
                               Source: U.S. Census Bureau, American Community Survey 2012—2016

                                                                                                 PHILADELPHIA POPULATION CHANGE, 2000–2016
    ENHANCING POSITIVE TRENDS, LOCALLY: The opening of the
    new Comcast Technology Center, the retention of Aramark’s
    corporate headquarters, the rapid growth of startups, investments
    in innovation made by major employers and local institutions
    and the eagerness of suburban firms to connect with Center
    City’s educated, skilled workforce are all positive trends upon
    which to capitalize. So too is the dynamic growth in University
    City and the collaborative work and positive messaging that
    emerged from the pursuit of Amazon. Philadelphia’s decline in
    the early- to mid-20th century resulted from overreliance on
    contracting manufacturing employers, complacency and failure
    to capture the growth of post-industrial and emerging innovation
    industries. Our success in the 21st century must be built upon a
    relentless impatience with the status quo.

    The success in Center City, University City and at the Navy
                                                                                                                                                           Increase more than 25%
    Yard is substantial — but simply not large enough to offset
                                                                                                                                                           Increase 5% to 25%
    declines elsewhere in the city. The disparities between the                                                                                            Increase less than 5%
    thriving and declining sections of the city are enormous and                                                                                           Decrease less than 5%
    the temptation is strong to fall into a politics of resentment                                                                                         Decrease more than 5%
    with anti-growth rhetoric. Our national politics are already                                                                                           Non-residential (Navy Yard)

    consumed by extremes — a tendency to pit one group against                                                                               Source: U.S. Census Bureau, Decennial Census
                                                                                                                                              2000, American Community Survey 2012-2016

    4                                                                                               CENTER CITY DISTRICT & CENTRAL PHILADELPHIA DEVELOPMENT CORPORATION | CENTERCITYPHILA.ORG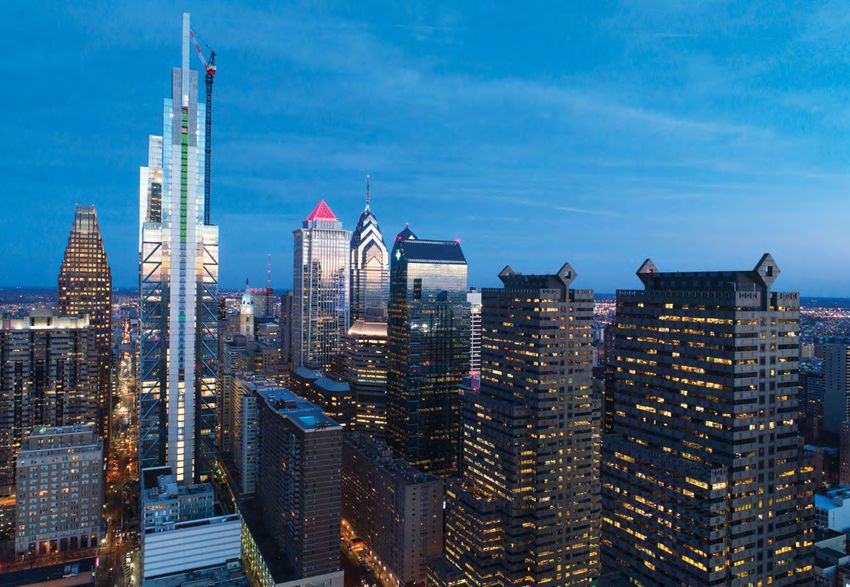
INTRODUCTION

   DEFINING THE DOWNTOWN

                                                                                                                         GREATER CENTER CITY
                                                                                                                                  (CORE + EXTENDED)
                                                                                                                                                                   GIRARD AVENUE

                                                                                                                        19130                                      19123

                                                                                                                                EXTENDED CENTER CITY

                                                                                                                                                                            VINE ST

                                               PHILADELPHIA
                                                                                                         UNIVERSITY
                                                                                                                                           City Hall

                                                                                                               CITY             CORE CENTER CITY

                                                                                                                                       19102
                                                                                                                        19103                          19107            19106
                                                                                                                                                                            PINE ST

                                           GREATER                                                                              EXTENDED CENTER CITY
                                          CENTER CITY
                                                                                                                       19146                                    19147
                                                                                                                                                                    TASKER STREET

                                                                                             DEFINING THE RESIDENTIAL DOWNTOWN:
                                                                                            The four ZIP codes between Vine and Pine streets are referred to in this report
                                                                                             as “Core Center City” and the surrounding neighborhoods in the four adjacent ZIP
                                                                                             codes are termed “Extended Center City.” Together they form “Greater Center City”
                                                                                            — where 40% of residents live and work within the same area, while another 12%
                                                                                             work in University City.

another. Philadelphia needs to avoid that trap and to seek far
more pragmatic solutions that work locally. Instead of pitting the
                                                                                            GREATER CENTER CITY POPULATION
interests of market rate development against the needs of lower
income residents, elected officials should focus on aligning both
around a strategy of job growth for all.                                                    POPULATION         CORE             EXTENDED                       GREATER CENTER CITY
                                                                                            250,000
The federal government is steadily reducing the social safety
net. State resources are constrained as well. If Philadelphia is
going to make any impact on its 25.7% poverty rate, the highest                             200,000
                                                                                                                                                                                190,416
of America’s 10 largest cities, it simply has to create the type                                                                       173,284
                                                                                                             157,812
of competitive environment that grows private-sector jobs at a
faster rate, as other cities have done.                                                     150,000

Philadelphia needs to commit not only to its public schools, but
also to comprehensive tax reform. We can grow jobs citywide                                 100,000

if we reduce local government’s dependency on highly mobile                                                                                                                     124,594
                                                                                                                                       114,402
wages and business revenues and rely more on an expanding                                                    107,927
                                                                                             50,000
base of the local property tax to fund municipal services and
improve public schools. Otherwise, educated residents of many
neighborhoods will continue to leave for greater opportunities in                                            49,885                     58,882                                  65,822
                                                                                                  0
the suburbs.                                                                                                  2000                        2010                                    2017

                                                                                                                                                                  Source: U.S. Census Bureau, 2000 and
                                                                                                                                                                 2010 Decennial Census; CCD Estimates

CENTER CITY DISTRICT & CENTRAL PHILADELPHIA DEVELOPMENT CORPORATION | CENTERCITYPHILA.ORG                                                                                                       5
INTRODUCTION

               FASTEST GROWING PLACE TO LIVE: Greater Center City — defined as       Sixty-one percent of Greater Center City residents have
               Girard Avenue to Tasker Street, river to river — has capitalized      a bachelor’s degree or higher; in the downtown core the
               on growing national preferences for diverse, walkable, live-work      percentage rises to 79%. This critical mass of talent, combined
               places. It is the fastest growing residential area of Philadelphia,   with the steady stream of graduates from 15 colleges and
               with an estimated 190,000 residents in 2017, 40% of whom work         universities in and around Greater Center City, is exercising a
               downtown; another 11% work in University City. In the last five       powerful draw on employers. Suburban firms are announcing
               years, 26% of all in-movers to Philadelphia have moved into           new downtown locations or putting employees into co-working
               downtown, including a sizable share of the largest demographic        space to test the waters.
               group nationally, 20- to 34-year olds. Millennials now constitute
                                                                                     Greater Center City currently has a lower percentage of
               40% of the downtown population, followed closely by empty
                                                                                     households with children (14%) than the rest of Philadelphia
               nesters and growing numbers of families with children.
                                                                                     (27%), although 35,738 children have been born to downtown
               Greater Center City experienced another record-setting year           parents since 2000. Parents can enjoy the convenience of
               in 2017 with the construction of 2,680 new apartments, single-        walking their children to one of the 19 Greater Center City
               family homes and condominiums. Seventy-one percent of the             elementary schools, where 8,253 students were enrolled in
               units were rentals, single-family housing constituted 18%, and        2017. School district data show that 81% of students in public
               condominiums jumped to 10% of new units from just 5% one              classrooms in Greater Center City come from the downtown, a
               year before. Major developments were widely dispersed in 2017,        significant increase from a decade ago; 67% of children attend
               across both the core and extended neighborhoods of Center City.
               Philadelphia has expanded from a 3% share of regional housing
               permits in the early 1990s to a 25% share from 2010 to 2017           AFFORDABLE HOUSING IN AND AROUND
               with Greater Center City counting for more than half of all new       GREATER CENTER CITY
               units in the city. Since 2000, 23,385 new residential units have
               been added in Greater Center City. The extraordinary diversity
               of housing types available downtown allows households to stay                                     GIRARD AVE
               in Center City as their needs change over time, with housing                                       GIRARD AVE
               values appreciating at 11% per year since 2000.

               At the same time, Greater Center City has 5,938 units of

                                                                                                                                           ST ST
               subsidized housing intermixed with market-rate apartments,

                                                                                                                                         BROAD
               row homes and condominium buildings. Within a half-mile of                                            VINE ST

                                                                                                                                     BROAD
               the outer edges of the expanding downtown are another another                                          VINE ST

               4,766 subsidized units, providing a total of 10,704 units and               MARKET ST                                 City Hall

D AROUND       an opportunity for local government to stabilize lower-income                MARKET ST                                 City Hall

N AND AROUND   residents near Philadelphia’s prime employment center as
                                                                                                                     PINE ST
               market conditions continue to improve.                                                                PINE ST

               While 81% of suburban residents travel by car from home to
               work, 70% of core Center City residents commute without a car.
               The compact, intimately-scaled street grid that Philadelphia
               inherits from the 17th century promotes walkability and
               reinforces density, concentrating 60 residents per acre in                                         TASKER ST
                                                                                                                   TASKER ST
               the core downtown area and 47 per acre in the extended
               neighborhoods — compared with 37 per acre in the rest of
               Philadelphia and just 15 people per acre in the suburbs. Single-
               use, suburban zoning separates residents from commercial                 UNIT COUNT:        1-5         6 - 25        26 - 50               51 - 100
                                                                                         UNIT COUNT:       1-5         6 - 25        26 - 50               51 - 100
               districts. Downtown land-use diversity comingles living,
                                                                                                             101 - 250           251 - 500                   501 - 506
               working, retail, dining, cultural, entertainment and educational                               101 - 250          251 - 500                   501 - 506
               offerings, and density allows for ease of travel by public transit,
                                                                                                            GCC BOUNDARY          1/4 MILE BUFFER                      1/2 MILE BUFFER
               cab and ride- and bike-sharing services. For success to be
               ensured, the growing challenge of congestion must be managed           Properties                            70                            88                             118
               and rules of the road enforced for all.                                TOTAL UNITS                       5,938                         7,694                           10,704
                                                                                                                                                   Source: National Housing Preservation Database

               6                                                                           CENTER CITY DISTRICT & CENTRAL PHILADELPHIA DEVELOPMENT CORPORATION | CENTERCITYPHILA.ORG
INTRODUCTION
school in the catchment area in which they live. An equally CENTER CITY KEY FACTS
important metric: while Center City has three high quality,
independent schools, 75% of children in Greater Center City
attend public school, comparable to the citywide average of 80%. CENTER CITY KEY FACTS
Total Wage & Salary Jobs 298,612
More robust job growth will not only provide expanded
opportunities for Philadelphia residents, it will ensure that Partners & Self-Employed Workers 9,000
developers can fill new apartments now under construction. Office Square Feet 41.2 million
More certainty about long-term school funding will also help Office Occupancy 86.6%
retain millennials as they form families. A greater attention to Co-working Square Feet 502,000
quality of life issues downtown will encourage both workers
Hotel Rooms 11,675
and residents to stay, while supporting the burgeoning
hospitality industry. Hotel Room Occupancy 78.2%
Average Daily Room Rate $185
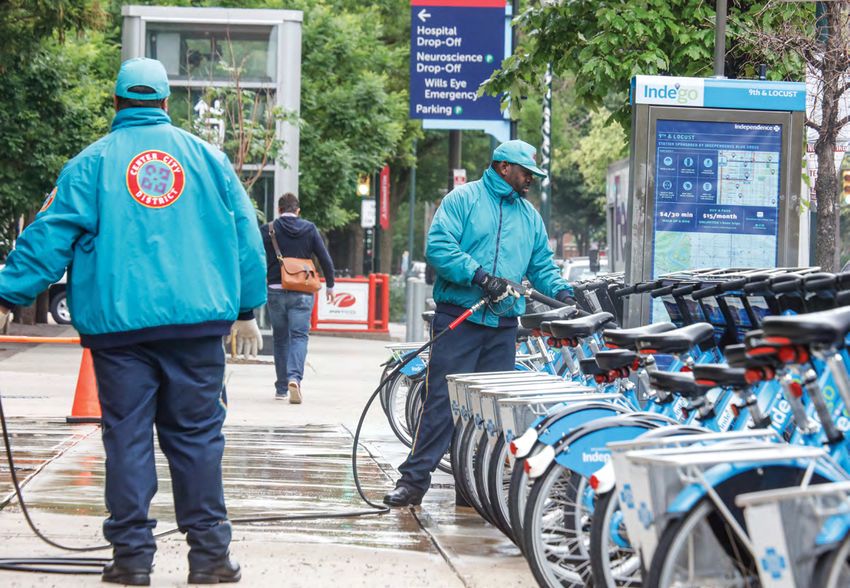
A MANAGED PLACE, PLANNING FOR THE FUTURE: For 27 years,
Retailers 992
Center City District (CCD) has enhanced public spaces,
reinforcing private-sector investment and supplementing city Full-Service Restaurants 453
services. In partnership with Central Philadelphia Development Cafes/Bakeries/Quick-Service Restaurants 447
Corporation (CPDC), research, planning and advocacy have Hospitals 5
guided investments and shaped policies that enhance downtown
Arts & Cultural Institutions 243
competitiveness. Today, sidewalks, filled with pedestrians
and outdoor cafés, are cleaned seven days a week and graffiti Colleges & Universities 15
is removed from the ground floor of building façades and Total Enrollment in Higher Education 34,812
from street furniture. CCD’s uniformed Community Service Annual Philadelphia International Airport Passengers 29,585,754
Representatives work in partnership with the Philadelphia Police
Annual Amtrak 30th Street Station Passengers 4,391,966
Department, providing a welcoming presence for pedestrians
Average Weekday Center City Transit Ridership
and helping to reduce the number of serious crimes by 44% (All Modes)
308,527
since 1993, while retail theft has been cut by 42% and thefts
Housing Units Completed in 2017 2,680
from autos by 86%.
Average Home Sale Price $369,234
CCD maintains nearly all of the $146 million streetscape and Apartment Median Asking Rent $1,930
public space improvements it has made in the last 20 years,
Greater Center City Population 190,416
routinely cleaning, updating and refurbishing pedestrian, transit
and vehicular directional signs, disk and bus shelter maps and Percent of Residents with Bachelor's or More 61%
interpretive panels along the Benjamin Franklin Parkway. CCD
has installed 2,189 pedestrian-scale light fixtures since 1996,
doubling or tripling nighttime illumination, while supporting Today, Center City is more vibrant than at any time since the late
the evening economy. CCD programs color-changing lights on 1940s, before suburbanization and de-industrialization started
building façades along the Avenue of the Arts and maintains draining life and jobs out of the city. But changes at the national
the illumination on public sculptures on the Benjamin Franklin and state levels are challenging Philadelphia more than at any
Parkway. CCD manages and programs four parks it has time in recent memory. We must be far more self-reliant and
renovated and is transforming part of the defunct Reading inventive, making better use of the assets we have. It’s time to
Railroad viaduct into the first phase of the new Rail Park that manage more effectively our narrow streets and intimate-scaled
opens in 2018. sidewalks and create a competitive platform for broader, more
inclusive growth.
CPDC was formed 62 years ago as the private-sector leadership
group that partnered with local government at the inception
of the downtown revival. CCD was formed 27 years ago, after
a decade of federal disengagement and a major recession
rendered Center City’s public domain a dirty and dangerous
place to be avoided.
CENTER CITY DISTRICT & CENTRAL PHILADELPHIA DEVELOPMENT CORPORATION | CENTERCITYPHILA.ORG 7Cozen O'Connor | Matt Stanley
OFFICE
Center City’s 41.2 million square feet (sf) of commercial office ($56.64) and Washington, D.C. ($54.83). In Center City, the
space is the backbone of the downtown economy. Well-served West Market Street submarket commands the highest rents at
by transit, office buildings hold the densest concentration an average of $31.78/sf, with Independence Square following
of employment opportunities in the region, providing 40% of closely behind at $31.27/sf. The submarkets east of Broad saw
downtown jobs and the most diverse opportunities: high-skilled the highest rate appreciations in 2017, as older office buildings
positions requiring at least a college degree, technical, support have been repositioned and the historic westward migration of
and clerical jobs, as well as building engineers and managers, tenants has been counter-balanced by a broader resurgence of
security personnel and custodians. Every time tenants turn the east side of downtown.
over, construction trades are called on to renovate space.
Co-working spaces are continuing to grow in Center City, but
Office workers spend time and money in downtown shops,
at a slower rate than previous years, accounting for 2.8% of
restaurants, and entertainment venues, creating $230 million in
all leasing activity in 2017. A total of 24 co-working locations
annual retail demand. Business travelers accounted for almost
occupy 502,000 sf of space with an additional 209,000 sf under
one-third of all hotel room nights in 2017.
construction. Despite the perception that co-working spaces
Center City’s office occupancy rate slightly decreased from are filled with young entrepreneurs and startups, many large
87.8% in 2016 to 86.6% in 2017, though still surpassing companies are using co-working spaces downtown to test
suburban occupancy levels of 85.3%. Trophy occupancy was the market.
highest at 95%, followed by Class A and B at 89% and 88%,
But most leasing activity in 2017 followed Center City’s historic
respectively. Though average asking rents rose to $30.59/sf
pattern of renewals and in-market movement. The largest
from $29.60/sf, this is still far lower than the leading markets
leasing transaction came from Thomas Jefferson University.
nationally — almost a third less of asking rents in Midtown
Capitalizing on the large block of space being vacated by
Manhattan ($80.15), and nearly half of asking rates in Boston
Aramark’s impending move to 2400 Market, the medical
8 CENTER CITY DISTRICT & CENTRAL PHILADELPHIA DEVELOPMENT CORPORATION | CENTERCITYPHILA.ORGOFFICE
institution signed a 230,000 sf lease on East Market Street. With the repositioning of recently acquired buildings, developers
Their move reinforces the redevelopment of The Gallery into are looking to differentiate their product within the marketplace
Fashion District Philadelphia and the development of the by investing heavily in amenities, including state-of-the-art
former Girard Estate parcel across the street into a mixed-use meeting space, as well as new ground floor retail tenants that
residential, office and retail center. The First Judicial District of younger office workers like to patronize.
Pennsylvania, Philadelphia’s local court system, also secured
Center City’s largest development, Liberty Property Trust’s
120,000 sf of space in the Sovereign Building at 714 Market St.,
Comcast Technology Center, will add 1.3 million sf of trophy
placing its offices adjacent to the federal courthouse complex
space to Center City upon completion in 2018. PMC Property
on Market Street.
Group’s 2400 Market will house Aramark’s relocated
Inbound office tenants accounted for 16% of all leasing activity headquarters and several other tenants, adding 485,000 sf of
between 2015 and 2017, as 1.2 million sf of space was taken office space and narrowing the gap between Center City and
by tenants migrating downtown from outside the city limits, University City. Still on the drawing boards is Oliver Tyrone
according to JLL. While some relocations have been large, Pulver Corp.’s proposed 1301 Market that will add 840,000 sf of
most newcomers into the Philadelphia market leased small or office along East Market, if constructed.
gateway spaces to attract young, educated workers who live in
Despite these positive trends, Center City’s office sector
Greater Center City and who may be reluctant to commute to
continues to lag compared to other peer markets. A simple
the suburbs for a job. A prime example was the announcement
measure of success is the premium that businesses are willing
in 2017 that Malvern-based Vanguard Group is opening a
to pay to be in the employee- and amenity-rich CBD, as opposed
16,000-sf innovation center at 2300 Chestnut St.
to the suburbs. A sampling of major CBD markets nationwide
Investor demand for office buildings continues to grow in by Newmark Grubb Knight Frank showed an average CBD
Philadelphia’s relatively affordable market, especially from premium of 25% in 2017 — rising to 112% in Boston and 74%
national and global firms. A total of 4.7 million sf of office space, in Washington, D.C. In Philadelphia, the premium on downtown
representing $830 million in transactions, exchanged hands in space was just 10%, comparable to many sprawling Sun Belt
2017. Notable sales included: Oaktree Capital Management’s metros. These lower rent premiums are a result of the impact
purchase of United Plaza from CBRE Global Investors; on occupancy costs of Philadelphia’s wage, business and
Rubenstein’s partial acquisition of the Wanamaker Building use and occupancy taxes, which can easily add a 20% to 30%
from TIER REIT; Washington, D.C.-based MRP Realty’s purchase premium on downtown costs. More robust growth will occur
of Three Parkway also from TIER REIT; New York-based only when Philadelphia updates its tax structure to 21st
Nightingale Properties’ acquisition of Centre Square from century realities.
Equity Commonwealth; and Alterra Property Group’s purchase
of One City Plaza, with the likely conversion to residential.
MAJOR CENTER CITY OFFICE SUBMARKETS
TOTAL INVENTORY (SF) VACANT (SF) OCCUPANCY RATE 2017 ABSORPTION (SF) AVERAGE ASKING RENT (PSF)
West Market 25,782,472 3,300,156 87.2% -287,400 $31.78
East Market 6,502,780 559,239 91.4% 196,022 $27.51
Independence Square 4,852,963 1,014,269 79.1% -211,086 $31.27
Walnut/South Broad 4,065,524 662,680 83.7% 10,316 $26.98
TOTAL 41,203,739 5,536,344 86.6% -292,148 $30.59
Source: Newmark Grubb Knight Frank
CENTER CITY DISTRICT & CENTRAL PHILADELPHIA DEVELOPMENT CORPORATION | CENTERCITYPHILA.ORG 9OFFICE
CENTRAL BUSINESS DISTRICT OCCUPANCY, 2017
NEW YORK CITY - MIDTOWN SOUTH 94.5%
SAN FRANCISCO 93.6%
NEW YORK CITY - MIDTOWN 92.5%
NEW YORK CITY - DOWNTOWN 90.9%
PORTLAND, OR 90.5%
MIAMI 88.8%
WASHINGTON, D.C. 88.8%
BOSTON 88.4%
NEW YORK CITY - BROOKLYN 88.0%
SAN DIEGO 87.8%
JACKSONVILLE 87.4%
CHICAGO 86.7%
PHILADELPHIA - CENTER CITY 86.6%
BALTIMORE 85.3%
ATLANTA 84.3%
DENVER 83.9%
FAIRFIELD COUNTY, CT 82.6%
DALLAS 80.6%
LOS ANGELES 80.5%
HOUSTON 79.0%
PHOENIX 77.7%
20% 40% 60% 80% 100%
Source: Newmark Grubb Knight Frank
CENTER CITY HAS THE SAME AMOUNT OF OCCUPIED OFFICE SPACE
IN 2017 AS IT DID IN 1990
CENTER CITY PHILADELPHIA OFFICE MARKET, 1985–2017
OCCUPIED (SF) VACANT (SF) OCCUPANCY RATE
SF (MILLIONS) OCCUPANCY RATE
50 95%
40 91%
30 87%
20 83%
10 79%
0
75%
1985 1986 1987 1988 1989 1990 1991 1992 1993 1994 1995 1996 1997 1998 1999 2000 2001 2002 2003 2004 2005 2006 2007 2008 2009 2010 2011 2012 2013 2014 2015 2016 2017
Source: Newmark Grubb Knight Frank
10 CENTER CITY DISTRICT & CENTRAL PHILADELPHIA DEVELOPMENT CORPORATION | CENTERCITYPHILA.ORGOFFICE
COMPARATIVE CENTRAL BUSINESS DISTRICT ASKING RENTS, 2017
NEW YORK CITY - MIDTOWN $80.15
SAN FRANCISCO $74.80
NEW YORK CITY - MIDTOWN SOUTH $74.09
NEW YORK CITY - DOWNTOWN $64.91
BOSTON $56.64
FAIRFIELD COUNTY, CT $54.98
WASHINGTON, D.C. $54.83
NEW YORK CITY - BROOKLYN $43.97
MIAMI $42.03
LOS ANGELES $41.67
HOUSTON $38.82
CHICAGO $35.44
DENVER $33.92
PORTLAND, OR $30.81
PHILADELPHIA - CENTER CITY $30.59
ATLANTA $27.91
SAN DIEGO $27.42
PHOENIX $25.50
DALLAS $25.23
BALTIMORE $23.18
JACKSONVILLE $20.52
Source: Newmark Grubb Knight Frank
DOWNTOWN PREMIUM: CENTRAL BUSINESS DISTRICT CLASS A RENTS
COMPARED TO REGIONAL RENTS, 2017
BOSTON 112%
WASHINGTON, D.C. 74%
FAIRFIELD COUNTY, CT 66%
CHICAGO 61%
OAKLAND 50%
SACRAMENTO 44%
DENVER 39%
MIAMI 39%
HOUSTON 33%
PORTLAND, OR 26%
NATIONAL AVERAGE 25%
ORLANDO 10%
PHILADELPHIA - CENTER CITY 10%
ORANGE COUNTY, CA 6%
ATLANTA 6%
SAN FRANCISCO 4%
BALTIMORE 3%
LOS ANGELES 2%
PHOENIX 2%
JACKSONVILLE -5%
DALLAS -10%
-20% 0% 20% 40% 60% 80% 100% 120%
Source: Newmark Grubb Knight Frank
CENTER CITY DISTRICT & CENTRAL PHILADELPHIA DEVELOPMENT CORPORATION | CENTERCITYPHILA.ORG 11OFFICE
WEWORK
LOCALHOST NORTHERN LIBERTIES
30,000
CENTER CITY AVERAGE ASKING RENT CENTER CITY OCCUPANCY RATE BY CLASS
BENJAMIN'S DESK
3,000
17,000
DOLLARS PER SQUARE FOOT TROPHY CLASS A CLASS B OCCUPANCY RATE TROPHY CLASS A CLASS B
$40 100%
$37.41
VENTUREF0RTH
10,000 95%
$35 95%
$31.27 91%
BOND STATION HOUSE $30.85
THE EXCHANGE WEWORK
21,526 7,500 (1601 MARKET) 89%
$30 BENJAMIN'S DESK MAKEOFFICE 40,000
90%
$26.77 (30 NORTH 41ST ST) 67,000 $27.43 87%
12,400 PIPELINE
21,000
IC@340 MAKEOFFICE INDY HALL 88%
$25 11,7500 24,000 85% THE YARD 10,000
$22.49 24,000
WEWORK
85%
CITY COHO (1900 MARKET) BENJAMIN'S DESK
13,000 56,000 80% WASHINGTON SQUARE
$20
9,850
2010 2011 2012 2013 2014 2015 DESK 2016
BENJAMIN'S 2017 CULTUREWORKS
2010 2011 2012 2013 2014 2015 2016 2017
6,100 INDUSTRIOUS GREATER PHILADELPHIA
Source: JLL 21,000
Research Source: JLL Research
5,000
BENJAMIN'S DESK
11,700 WEWORK
(WALNUT STREET) JOYNTURE
502,000 SF OF CO-WORKING SPACE IS
30,000 23,000
PROVIDING NATIONAL AND REGIONAL FIRMS AN
OPPORTUNITY TO TEST THE CENTER CITY MARKET
GIRARD AVE
LOCALHOST
3,000 CO-WORKING
DIVINE WORKS – WEWORK
1776 BENJAMIN’S DESK NORTHERN LIBERTIES OFFICE SPACE
17,000 30,000
SQUARE FEET:
BROAD ST
5,000 or less
VENTUREF0RTH 5,001–10,000
KISMET 10,000
BOND THRIVE PHILLY
STATION HOUSE 6,400
VINE ST 11,000 10,001–15,000
21,526
CAMBRIDGE THE EXCHANGE
INNOVATION CENTER PHL NEXT 15,001–25,000
STAGE MED WEWORK MAKEOFFICE 7,500
127,000
20,856 56,050 56,776 WEWORK PIPELINE SPACES
39,846 21,000 37,735
MAKEOFFICE MARKET ST
INDY HALL
24,000
City Hall
THE YARD 10,000 25,001–35,000
1776
BENJAMIN’S DESK 23,500
IC@3401
12,380 17,500 1776 BENJAMIN’S DESK 1776 BENJAMIN'S DESK
CULTUREWORKS
6,100 5,000 19,400 35,001 or more
CITY COHO 1776 BENJAMIN’S DESK
13,000 11,693 INDUSTRIOUS WEWORK
21,000 21,000 PINE ST
Coming Soon
JOYNTURE
23,000 Open
Source: Center City District,
JLL Research
PENNOVATION
CENTER
38,000
12 CENTER CITY DISTRICT & CENTRAL PHILADELPHIA DEVELOPMENT CORPORATION | CENTERCITYPHILA.ORGOFFICE
SIGNIFICANT OFFICE LEASING TRANSACTIONS IN CENTER CITY, 2017
MARKET WEST
Tenant Building Class Size (SF)
Morgan Lewis & Bockius Ten Penn Center A 97,198
Reed Elsevier Four Penn Center A 75,000
Comcast Three Logan Square A 70,000
Post & Schell Four Penn Center A 60,000
Pennoni 1900 Market Street A 55,000
McCormick Taylor Beneficial Bank Building A 50,000
Braskem BNY Mellon Center Trophy 44,000
Pennsylvania Office of Attorney General The Phoenix B 33,000
Tierney 1700 Market Street A 31,214
Jenkins Law Library Ten Penn Center A 30,000
LEAF Financial One Commerce Square A 30,000
Coalition of Cancer Cooperative Groups Beneficial Bank Building A 30,000
Simon & Simon Beneficial Bank Building A 25,000
JPMorgan Chase One Liberty Place Trophy 25,000
Market Resource Partners Beneficial Bank Building A 23,500
Bond Station House One Penn Center at Suburban Station B 21,526
Cozen O'Connor One Liberty Place A 20,000
Kleinbard One Liberty Place A 20,000
Brandywine Global BNY Mellon Center A 88,713
Bond Station House21,526
Hussian College 1500 Spring Garden Street A 32,771
The Exch
Pennsylvania Office of Attorney General Centre Square A 23,453
Magee Rehabilitation 1617 John F Kennedy Blvd MakeOffice24000 B 21,883
WeWork 1601 Market40000
MARKET EAST
Tenant Building Class Size (SF)
ic@340117500
Thomas Jefferson University Aramark Building A 230,000
First Judicial District of Pennsylvania (GSA) Sovereign Building B 120,000
Philadelphia Water Department Aramark Building A 22,000
EEOC 801 Market Street B 20,588
Benjamin's Desk12400 Source: JLL Research
City CoHo13000
Benjamin's Desk6100
16% OF ALL LEASING
Benjamin's Des
WeWork 1900 Market56000
ACTIVITY FROM 2015 TO 2017 (1.2 MILLION SQUARE FEET)
WAS BY FIRMS MOVING IN FROM OUTSIDE THE CITY Pennovation Center
58000
CENTER CITY DISTRICT & CENTRAL PHILADELPHIA DEVELOPMENT CORPORATION | CENTERCITYPHILA.ORG 13OFFICE
CENTRAL BUSINESS DISTRICT COMPLETIONS, 2017
CBD COMPLETIONS COMPLETIONS AS PERCENT OF EXISTING CBD COMPLETIONS AS PERCENT OF NATIONAL COMPLETIONS
Seattle-Downtown 3,557,841 6.4% 20.4%
Chicago 3,473,854 2.4% 19.9%
Washington DC 1,979,552 1.6% 11.4%
Nashville 1,387,000 10.9% 8.0%
Dallas 292,237 0.8% 1.7%
Cincinnati 290,000 1.7% 1.7%
Portland-Central City 265,551 1.0% 1.5%
New York-Midtown South 178,504 0.3% 1.0%
Boston 0 0.0% 0.0%
New York-Midtown 0 0.0% 0.0%
Philadelphia - Center City 0 0.0% 0.0%
All Other Cities 5,990,646 0.8% 34.4%
UNITED STATES CBD TOTALS 17,415,185 1.1% 100.0%
Source: JLL Research
CENTER CITY OFFICE
BUILDING ACQUISITIONS,
2017
SQUARE FEET:
150,000 or less VINE ST
BROAD ST
150,001–350,000
350,001–1,000,000
THREE PARKWAY
RIVER
557,440 SF
1926 ARCH* ONE CITY PLAZA
1,000,000 or more 52,104 SF
SCHUYLKILL
220,300 SF
K
MARKET ST
City Hall 801 MARKET
S
312,000 SF
STATUS: CENTRE SQUARE WANAMAKER BUILDING*
Acquired by a 2300 CHESTNUT 1,770,000 SF 973,610 SF
National Investor 103,905 SF UNITED PLAZA
Acquired by a 617,476 SF
Local Investor
1533 LOCUST
*Purchased by Philadelphia-based 1624 LOCUST 12,720 SF
national investment company. 49,000 SF
Source: JLL Research
PINE ST
14 14 CENTER CITY DISTRICT & CENTRAL PHILADELPHIA DEVELOPMENT CORPORATION | CENTERCITYPHILA.ORGHEALTHCARE &
University of Pennsylvania | Matt Stanley
HIGHER EDUCATION
Higher education and healthcare institutions are the prime 3,090 people. In addition to placing office and administrative
engines of Philadelphia’s economy, accounting for 32% of all jobs in Center City office buildings, CHOP and the University of
jobs in the city and 20% of all jobs downtown. Since 2009, “eds Pennsylvania have been migrating east into new glass towers
and meds” jobs account for 30,800 of the 55,100 jobs added in lining the Schuylkill River, further narrowing the gap between
the city since the recession. Center City and University City.
Thomas Jefferson University accounts for more than half In fall 2016, Center City’s 15 colleges and universities reported
of Center City’s educational, medical and health services a total enrollment of 34,812 students. Adjacent to Center
employment and has steadily been increasing both its City, Drexel, Penn, Temple, and the University of the Sciences
regional reach and downtown impact. In July 2017, Jefferson enrolled an additional 76,980 students. Well-connected to the
completed a merger with Philadelphia University, putting one downtown by public transit, thousands of these students live,
of Philadelphia’s largest medical institutions and one of its shop and socialize in Center City. Of students who graduated
major design institutions under the same leadership, facilitating in 2016, 60% of the degrees were in health, business or STEM
further cross-disciplinary study. The merger has resulted in (science, technology, engineering, and math). As graduates
programs such as JeffDESIGN, which teaches students to apply transition to employees, 67% of students reported to Campus
design thinking to solve healthcare challenges. At the end of Philly that they are likely to stay in Philadelphia.
2017, Jefferson also announced plans to expand its Center
Philadelphia’s research institutions are driving innovation in
City campus by leasing space being vacated by Aramark on
the healthcare sector as well as other areas. According to the
East Market.
National Science Foundation’s Higher Education Research and
Penn Medicine, Drexel University and Children’s Hospital of Development Survey, combined research spending at Drexel,
Philadelphia (CHOP) increased their combined number of Temple, Jefferson, and Penn totaled $1.79 billion in 2016, up
jobs in Center City to 9,357, leasing both office and medical from $1.34 billion in 2015. Those four institutions launched
space, while eight smaller institutions employed more than a total of 29 startups in 2016, applied for 316 patents, and
CENTER CITY DISTRICT & CENTRAL PHILADELPHIA DEVELOPMENT CORPORATION | CENTERCITYPHILA.ORG 15HEALTHCARE & HIGHER EDUCATION
generated income from active licenses totaling $51.8 million. In 2018, the Cambridge Innovation Center, which has played a
Penn’s research and development expenditures ranked third in significant role in turning ideas into successful entrepreneurial
the nation in 2016, after increasing by 50% since 2015. Overall, ventures in the Boston area, will open in the new University City
Philadelphia’s $924 million in National Institutes of Health Science Center space at 3675 Market St. Establishing stronger
grants in 2017 puts the city in fourth place nationally behind connections between Philadelphia's research institutions
Boston, New York, and Seattle. and industry, capital, and local suppliers has the potential to
significantly boost job growth.
While the University City Science Center, Pennovation Center
and the Drexel Innovation District are all part of strategic
initiatives to foster Philadelphia’s ability to transfer academic
research into economic development, Philadelphia has a lot
of catching up to do. In the Boston area, for example, the
Massachusetts Institute of Technology alone launched 25 THE HEALTHCARE AND EDUCATION
startups, applied for 470 patents and generated $49.4 million in
active licenses. Nine of the top 30 pharmaceutical companies SECTOR PROVIDES 33% OF ALL
nationally are physically clustered around MIT’s Cambridge
campus. By contrast, the Greater Philadelphia area ranks sixth JOBS IN THE CITY AND 20% OF ALL
among the nation’s biopharma clusters, behind Boston, San
Francisco, New York, San Diego and Washington, D.C.
DOWNTOWN JOBS
PHILADELPHIA EDUCATION AND HEALTH SERVICES EMPLOYMENT
WAGE & SALARY EMPLOYMENT HEALTHCARE AND SOCIAL ASSISTANCE HIGHER EDUCATION
160,000
128,602 150,957
120,000
80,000
50,389
44,889
40,000
0
2007 2008 2009 2010 2011 2012 2013 2014 2015 2016
Source: U.S. Bureau of Labor Statistics, Quarterly Census of Employment & Wages
16 CENTER CITY DISTRICT & CENTRAL PHILADELPHIA DEVELOPMENT CORPORATION | CENTERCITYPHILA.ORGGIRARD
A AVE
E
CENTER CITY HIGHER
EDUCATION AND MEDICAL
INSTITUTION EMPLOYMENT
EMPLOYEES:
< 50
51–100
101–250
251–500
> 500
VINE ST
Smaller Institutions
Jefferson
U Penn
CHOP
City Hall
Drexel MARKET ST
Temple
BROAD ST
Source: Children's Hospital of Philadelphia;
Drexel University; Penn Medicine; Temple University;
Thomas Jefferson University; Individual Institutions
PINE ST
THOMAS JEFFERSON UNIVERSITY IS THE LARGEST PRIVATE EMPLOYER IN CENTER
CITY WITH MOST OF ITS EMPLOYMENT CONCENTRATED EAST OF BROAD STREET.
DREXEL UNIVERSITY IS EXPANDING ITS DOWNTOWN PRESENCE JUST NORTHWEST
OF CITY HALL, WHILE TEMPLE, PENN AND CHILDREN’S HOSPITAL ARE EXPANDING
THEIR DOWNTOWN FOOTPRINTS
TASKER ST
CENTER CITY DISTRICT & CENTRAL PHILADELPHIA DEVELOPMENT CORPORATION | CENTERCITYPHILA.ORG 17HEALTHCARE & HIGHER EDUCATION
NATIONAL INSTITUTES OF HEALTH FUNDING, 2017
BOSTON $1,967,853,177
NEW YORK $1,569,784,052
SEATTLE $936,729,526
PHILADELPHIA $923,746,747
BALTIMORE $891,334,610
LOS ANGELES $766,906,932
LA JOLLA $756,174,735
SAN FRANCISCO $701,523,630
CHICAGO $646,233,064
PITTSBURGH $571,995,518
ANN ARBOR $537,149,233
0 500,000,000 1,000,000,000 1,500,000,000 2,000,000,000
TOTAL NIH FUNDING
Source: U.S. Department of Health & Human Services, National Institutes of Health
PHILADELPHIA RANKS 4TH NATIONALLY, SECURING
$924 MILLION IN NIH GRANTS IN 2017
DEGREES CONFERRED BY PHILADELPHIA DEGREES CONFERRED BY TYPE
COLLEGES AND UNIVERSITIES, 2016
15,000
25% HEALTH
12,000
18% STEM
17% BUSINESS
28,568
9,000 7% LIBERAL ARTS
LEGAL, PUBLIC ADMIN,
6% SOCIAL SERVICES
6,000
GRADUATES
6% VISUAL AND
PERFORMING ARTS
5% EDUCATION
3,000
9% ASSOCIATES
2,134 14,361 8,372 3,701 7% OTHER
0
Source: U.S. Department of Education,
ASSOCIATE BACHELOR’S MASTER’S DOCTORAL National Center for Education Statistics
Source: U.S. Department of Education, National Center for Education Statistics
18 CENTER CITY DISTRICT & CENTRAL PHILADELPHIA DEVELOPMENT CORPORATION | CENTERCITYPHILA.ORGTEMPLE UNIVERSITY,
MAIN CAMPUS
34,034
COMMUNITY COLLEGE
OF PHILADELPHIA
18,126
BROAD ST
VINE ST
DREXEL UNIVERSITY,
CC CAMPUS
MOORE COLLEGE 2,159
OF ART & DESIGN PENNSYLVANIA ACADEMY
401 OF THE FINE ARTS TEMPLE UNIVERSITY,
287 SCHOOL OF
PODIATRIC MEDICINE
374
TEMPLE UNIVERSITY,
MARKET ST CC CAMPUS City Hall
1,004 HUSSIAN COLLEGE
DREXEL 73
UNIVERSITY
15,445 JNA INSTITUTE OF THOMAS JEFFERSON
THE ART INSTITUTE CULINARY ARTS UNIVERSITY
UNIVERSITY OF OF PHILADELPHIA 59
PENNSYLVANIA 7,577
1,071
24,960
ACADEMY OF CURTIS INSTITUTE
VOCAL ARTS OF MUSIC UNIVERSITY OF
28 173 THE ARTS
UNIVERSITY OF PINE ST
PEIRCE 1,917
THE SCIENCES COLLEGE
2,541 1,563
HIGHER EDUCATION ENROLLMENT, FALL 2016
FALL 2016 ATTENDANCE:
Source: National Center for Education Statistics, Integrated Postsecondary Education Data System;
Temple University Fact Book 2016-2017; Drexel University, Office of Institutional Research, Assessment
& Effectiveness; Pennsylvania Academy of the Fine Arts Annual Report; Thomas Jefferson University;
< 500 501–2,000 2,001–10,000 > 10,000 University of Pennsylvania; University of the Sciences
112,000 STUDENTS
TASKER ST
ARE ENROLLED IN COLLEGES AND UNIVERSITIES
IN AND ADJACENT TO CENTER CITY
CENTER CITY DISTRICT & CENTRAL PHILADELPHIA DEVELOPMENT CORPORATION | CENTERCITYPHILA.ORG 19HEALTHCARE & HIGHER EDUCATION
RESEARCH EXPENDITURES AT CENTER CITY AND ADJACENT UNIVERSITIES
EXPENDITURES (MILLIONS) 2014 2015 2016
1,500
1,200
900
600
300
0 $131.2 $128.0 $127.9 $224.1 $227.5 $246.4 $118.4 $119.6 $122.4 $828.4 $864.1 $1296.4
DREXEL UNIVERSITY TEMPLE UNIVERSITY THOMAS JEFFERSON UNIVERSITY UNIVERSITY OF PENNSYLVANIA
Source: National Science Foundation, National Center for Science & Engineering Statistics, Higher Education R&D Survey
TOTAL SPENDING ON RESEARCH INCREASED FROM
$1.34 BILLION IN 2015 TO $1.79 BILLION IN 2016
NEW PATENT APPLICATIONS AT CENTER CITY AND ADJACENT UNIVERSITIES
NEW PATENT APPLICATIONS 2014 2015 2016
200
150
100
50
0 78 64 68 20 38 53 18 53 24 123 175 171
DREXEL UNIVERSITY TEMPLE UNIVERSITY THOMAS JEFFERSON UNIVERSITY UNIVERSITY OF PENNSYLVANIA
Source: Association of Technology Managers, Licensing Activity Survey 2016
20 CENTER CITY DISTRICT & CENTRAL PHILADELPHIA DEVELOPMENT CORPORATION | CENTERCITYPHILA.ORGCONVENTIONS,
Aloft Hotel Lobby | Matt Stanley
TOURISM & HOTELS
Major public and private investments in the hospitality sector, for 33% of the downtown’s occupied hotel room nights, surpassing
including the Pennsylvania Convention Center, the Museum of commercial (31%) and group and convention business (32%). In
the American Revolution, hotels and cultural institutions, as 2018, Visit Philadelphia is planning on highlighting Philadelphia’s
well as advertising and marketing efforts, have repositioned best-in-class food scene, as data from Bon Appétit shows 81%
Philadelphia as a national meeting and tourist destination. This of leisure travelers now travel for food.
in turn has paid dividends with record-breaking visitation num-
Combined, leisure and group travel demand pushed Center
bers and expanded employment opportunities for city residents
City’s 2017 hotel occupancy rate to a modern-day record of
with the addition of more than 16,400 jobs in the leisure and
78.2%, with a total of 3.3 million occupied hotel room nights.
hospitality sector since 2009.
The average daily room rate (ADR) for Center City was $185,
In 2017, the Pennsylvania Convention Center hosted 21 conven- slightly below levels in 2016, when the city hosted the DNC.
tions and trade shows and three gate shows of 1,500 attendees While Center City’s ADR has surpassed pre-recession highs,
or more, pushing attendance to 1,055,464. Of note was the NFL when adjusting for inflation, rates actually declined. This was
Draft, which brought 250,000 people and generated an overall largely due to limited demand from business travelers, the
economic impact of $94.9 million. Twenty-one conventions and highest rate payers, reflecting the limited number of major
trade shows of 4,000 or more are slated for 2018 with anticipated corporate headquarters in the city and only modest office sector
attendance of 1,155,000. job growth.
Leisure room nights, driven by Visit Philadelphia’s marketing in In 2016, 644,200 overseas visitors came to the Philadelphia region,
North America and the Philadelphia Convention and Visitors generating an economic impact of $979 million. While the U.K.
Bureau’s focus on overseas travel, totaled 1,092,000 in 2017, an remained the No. 1 feeder market to the region, visitation from
increase of 61% from 2008 levels. Leisure travel now accounts China increased 12.4% over 2015 levels, making it the second
CENTER CITY DISTRICT & CENTRAL PHILADELPHIA DEVELOPMENT CORPORATION | CENTERCITYPHILA.ORG 21CONVENTIONS, TOURISM & HOTELS
largest market for overseas travelers and the fastest growing that better position the hotel to a millennial audience. Addi-
overseas market for the region. While overseas visitation declined tionally, the former Omni Hotel, now known as The Franklin by
by nearly 2% nationally, it grew by almost 1% in Philadelphia and Marriott, is undergoing a multimillion-dollar renovation after its
is projected to grow 9.4% over the next five years. These growth acquisition by Buccini/Pollin. The Independence Visitor Center
projections are helped by the recent addition of new nonstop is also investing $15 million to enlarge its gift shop and terrace
international flights from Reykjavik, Dublin, Zurich, Budapest, overlooking Independence Mall, to be completed by 2019.
Prague and Mexico City to Philadelphia International Airport.
Increasing demand in Center City is driving 11 hotel projects
that will increase downtown supply to more than 13,000 rooms
by 2021. As of December 2017, the W Hotel, Element by Westin,
Cambria Hotel & Suites (completed in early 2018), Four Seasons,
Hyatt Centric, and Fairfield Inn and Suites were all under con-
struction, with the Kimpton, SLS LUX, Marriott AC and Comfort
Inn still in the planning phases. These will join the recently
opened Aloft Hotel, located on North Broad Street next to the
Convention Center.
THE NUMBER OF HOTEL ROOMS
Older hotels are responding with rebranding and renovations. OCCUPIED BY LEISURE TOURISTS
After the completion of an $8 million renovation, Hyatt will
be repositioning The Bellevue as part of their newly launched
HAS INCREASED 61% SINCE 2008
Unbound Collection, while the Hilton Philadelphia at Penn’s
Landing is undergoing a two-year, $15 million, property-wide
AND NOW MAKES UP 33% OF HOTEL
redesign, and Le Meridien is investing $1 million in upgrades ROOM DEMAND IN CENTER CITY
OCCUPIED CENTER CITY HOTEL ROOMS BY PURPOSE OF TRIP
ROOM NIGHTS GOVERNMENT AIRLINE GROUP AND CONVENTION COMMERCIAL INDIVIDUAL LEISURE
3,500,000 62,000
86,000
3,000,000
75,358
2,500,000 97,207
1,063,000
2,000,000
1,500,000
987,894
1,029,000
1,000,000
696,940
500,000
677,215 1,092,000
0
2008 2009 2010 2011 2012 2013 2014 2015 2016 2017
Source: CBRE Hotels - Provided by Philadelphia Convention & Visitors Bureau
3.33 MILLION TOTAL OCCUPIED ROOM NIGHTS IN 2017
22 CENTER CITY DISTRICT & CENTRAL PHILADELPHIA DEVELOPMENT CORPORATION | CENTERCITYPHILA.ORGCONVENTIONS, TOURISM & HOTELS
AVERAGE DAILY ROOM RATE FOR CENTER CITY HOTELS
AVERAGE DAILY ROOM RATE COMMERCIAL GROUP AND CONVENTION AVERAGE DAILY RATE INDIVIDUAL LEISURE
$220
$192 $200
$193
$181 $185
$174 $169
$160
$155
$100
2008 2009 2010 2011 2012 2013 2014 2015 2016 2017
Source: CBRE Hotels - Provided by Philadelphia Convention & Visitors Bureau
OCCUPANCY AT CENTER CITY HOTELS HIT
78.2% IN 2017, A MODERN-DAY RECORD
AVAILABILITY AND OCCUPANCY OF CENTER CITY HOTEL ROOMS
ROOM SUPPLY OCCUPANCY RATE
HOTEL ROOMS OCCUPANCY
11,500 80%
78.2%
11,000 76%
10,500 70.8% 72%
10,000 68%
9,500 64%
9,000
10,045 10,262 10,580 10,586 10,813 11,199 11,210 11,119 11,139 11,675
60%
2008 2009 2010 2011 2012 2013 2014 2015 2016 2017
Source: STR, Inc. - Provided by Philadelphia Convention & Visitors Bureau
CENTER CITY DISTRICT & CENTRAL PHILADELPHIA DEVELOPMENT CORPORATION | CENTERCITYPHILA.ORG 23HOTEL DEVELOPMENTS
IN CENTER CITY, 2017
ROOMS:
BROAD ST
8–100
VINE ST
KIMPTON HOTEL BEST WESTERN PLUS
101–250 199 ROOMS 107 ROOMS
COMFORT INN
MARRIOTT AC 150 ROOMS
150 ROOMS
251–450
451–800 FOUR SEASONS ALOFT HOTEL
219 ROOMS 179 ROOMS
801–1,408 MARKET ST City Hall
W HOTEL
295 ROOMS
POD PHILLY ELEMENT
252 ROOMS BY WESTIN
Proposed 460 ROOMS
Under Construction CAMBRIA HOTEL & SUITES
223 ROOMS
Opened in 2017 HYATT CENTRIC FAIRFIELD INN AND SUITES BY MARRIOTT
322 ROOMS 118 ROOMS
Existing Hotels SLS LUX
152 ROOMS
PINE ST
Source: Visit Philadelphia; Center City District
CENTER CITY HOTEL OCCUPANCY WEEKDAY VS. WEEKEND
OCCUPANCY RATE WEEKDAY (MON–THURS) WEEKEND (FRI–SAT) SUNDAY
100%
80%
TASKER ST
60%
40%
20%
56.1%
73.2%
74.9%
54.1%
69.8%
75.9%
51.3%
74.3%
76.3%
51.7%
74.0%
75.5%
54.4%
74.7%
80.3%
56.6%
73.6%
81.2%
57.3%
76.1%
84.4%
77.2%
84.0%
59.4%
79.9%
84.0%
57.6%
78.7%
86.1%
60.5%
0%
2008 2009 2010 2011 2012 2013 2014 2015 2016 2017
Source: STR, Inc. - Provided by Philadelphia Convention & Visitors Bureau
24 CENTER CITY DISTRICT & CENTRAL PHILADELPHIA DEVELOPMENT CORPORATION | CENTERCITYPHILA.ORGCONVENTIONS, TOURISM & HOTELS
OVERSEAS VISITORS TO THE PHILADELPHIA
FIVE-COUNTY REGION BY COUNTRY, 2016
17% UNITED KINGDOM
10% CHINA
9% GERMANY
OVERSEAS TRAVELERS TO THE
8% INDIA PHILADELPHIA REGION ACCOUNTED
5%
3%
FRANCE
ITALY 644,200 OVERSEAS VISITORS
FOR $594 MILLION IN TOTAL
DIRECT SPENDING, GENERATING
3% SOUTH KOREA
2% SPAIN AN ECONOMIC IMPACT OF
2% NETHERLANDS
2% IRELAND $979 MILLION IN 2016
36% ALL OTHER
Source: Tourism Economics Global Cities Travel - Provided
by the Philadelphia Convention & Visitors Bureau
ATTENDANCE AT ATTRACTIONS ON INDEPENDENCE MALL, 2016-2017
VISITORS (MILLIONS) 2016 2017
6
5
4
3
2
752,658
637,752
651,719
565,917
1
214,021
209,674
191,985
197,979
5,067,511
4,765,974
2,472,357
2,725,650
2,309,247
2,243,441
0
INDEPENDENCE NATIONAL INDEPENDENCE LIBERTY BELL CENTER* INDEPENDENCE HALL* NATIONAL CHRIST CHURCH AND BETSY ROSS HOUSE
HISTORICAL PARK VISITOR CENTER* CONSTITUTION CENTER* BURIAL GROUNDS
(ALL ATTRACTIONS)*
*Note: Attendance for Independence National Historical Park is an estimate of the number of unique visitors
to the Park and does not represent the sum of all visits to individual Park attractions.
Source: CBRE Hotels - Provided by Independence Visitor Center Corporation
CENTER CITY DISTRICT & CENTRAL PHILADELPHIA DEVELOPMENT CORPORATION | CENTERCITYPHILA.ORG 25CONVENTIONS, TOURISM & HOTELS
LARGEST CONVENTIONS, TRADE AND GATE SHOWS; LARGEST CONVENTIONS AND TRADE SHOWS;
OTHER MAJOR PUBLIC EVENTS, 2017 OTHER MAJOR PUBLIC EVENTS, ANTICIPATED, 2018
CONVENTION & TRADE SHOWS ATTENDANCE CONVENTION & TRADE SHOWS ATTENDANCE
National Football League 250,000 Army-Navy Game 69,600
Army-Navy Game 69,600 Philadelphia Marathon 30,000
Philadelphia Marathon 30,000 American Association for Cancer Research
21,000
Rock & Roll Half Marathon
LIGHTFAIR International 23,000
IEEE 15,000
American Association for Cancer Research
23,000 American Economic Association 14,000
Rock & Roll Half Marathon
Under Armour Northeast Qualifier 17,000 United Soccer Coaches 11,000
International Association of Chiefs of Police 14,000 Under Armour Northeast Qualifier 10,100
The Risk Management Society 12,000 Leading Age 10,000
American Water Works Association, Inc. 12,000 Rockwell Automation 10,000
American Occupational Therapy Association 10,000 NAFSA Association of International Educators 9,500
National Black MBA Association, Inc. 9,000 Public Library Association 8,000
The American Society for Cell Biology 9,000 National Electrical Contractors Association 7,000
EDUCAUSE 8,000 National Association of Student
6,000
Personnel Administrators
American Association of Nurse Practitioners 7,250
American Industrial Hygiene Association 6,000
Modern Language Association 7,200
American Sociological Association 6,000
American Osteopathic Association 6,000
Association for Iron & Steel Technology 6,000
PMMI - The Association for Packaging and
5,000 Society of Nuclear Medicine and Molecular Imaging 5,500
Processing Technologies
National Association of Elementary School Principals 3,000 UBM, LLC 5,000
Out and Equal 3,000 American Society of Landscape Architects 5,000
Bayada Home Health Care 2,130 American College of Gastroenterology 4,000
NeighborWorks America 1,800 National Title I Association 4,000
LARGE GATE SHOW ATTENDANCE (20,000+) 603,000 Source: Philadelphia Convention & Visitors Bureau
Source: Philadelphia Convention & Visitors Bureau,
Pennsylvania Convention Center
2017 TOTAL CONVENTION 2018 ANTICIPATED CONVENTION
CENTER ATTENDANCE: CENTER ATTENDANCE:
1,055,464 1,155,000
Source: Pennsylvania Convention Center
26 CENTER CITY DISTRICT & CENTRAL PHILADELPHIA DEVELOPMENT CORPORATION | CENTERCITYPHILA.ORGYou can also read