Electricity and Gas Networks in the ACT - Current State Assessment Report
←
→
Page content transcription
If your browser does not render page correctly, please read the page content below
Assessment of the Current State of        Commercial-in-Confidence
                                                    Electricity and Gas Networks
                                                    ACT Government - Environment, Planning
                                                    and Sustainable Development Directorate
                                                    08-Oct-2020

Electricity and Gas
Networks in the ACT
Current State Assessment Report

08-Oct-2020
Prepared for – ACT Government - Environment, Planning and Sustainable Development Directorate – ABN: 31 432 729 493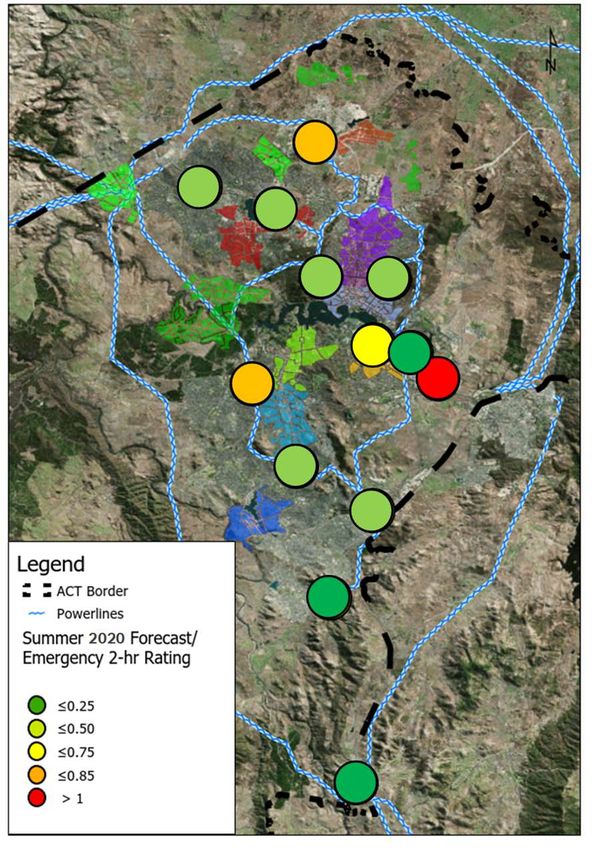
AECOM                                                  Assessment of the Current State of Electricity and Gas Networks
                                                       Electricity and Gas Networks in the ACT
                                                       Commercial-in-Confidence

Electricity and Gas Networks in the ACT
Current State Assessment Report

Client: ACT Government - Environment, Planning and Sustainable Development Directorate
           ABN: 31 432 729 493

Prepared by
AECOM Australia Pty Ltd
Civic Quarter, Level 4, 68 Northbourne Avenue, GPO Box 1942 ACT 2601, Canberra ACT 2601, Australia
T +61 2 6100 0551 www.aecom.com
ABN 20 093 846 925

08-Oct-2020

Job No.: 60635230

AECOM in Australia and New Zealand is certified to ISO9001, ISO14001 AS/NZS4801 and OHSAS18001.

© AECOM Australia Pty Ltd (AECOM). All rights reserved.

AECOM has prepared this document for the sole use of the Client and for a specific purpose, each as expressly stated in the document. No other
party should rely on this document without the prior written consent of AECOM. AECOM undertakes no duty, nor accepts any responsibility, to any
third party who may rely upon or use this document. This document has been prepared based on the Client’s description of its requirements and
AECOM’s experience, having regard to assumptions that AECOM can reasonably be expected to make in accordance with sound professional
principles. AECOM may also have relied upon information provided by the Client and other third parties to prepare this document, some of which
may not have been verified. Subject to the above conditions, this document may be transmitted, reproduced or disseminated only in its entirety.

08-Oct-2020
Prepared for – ACT Government - Environment, Planning and Sustainable Development Directorate – ABN: 31 432 729 493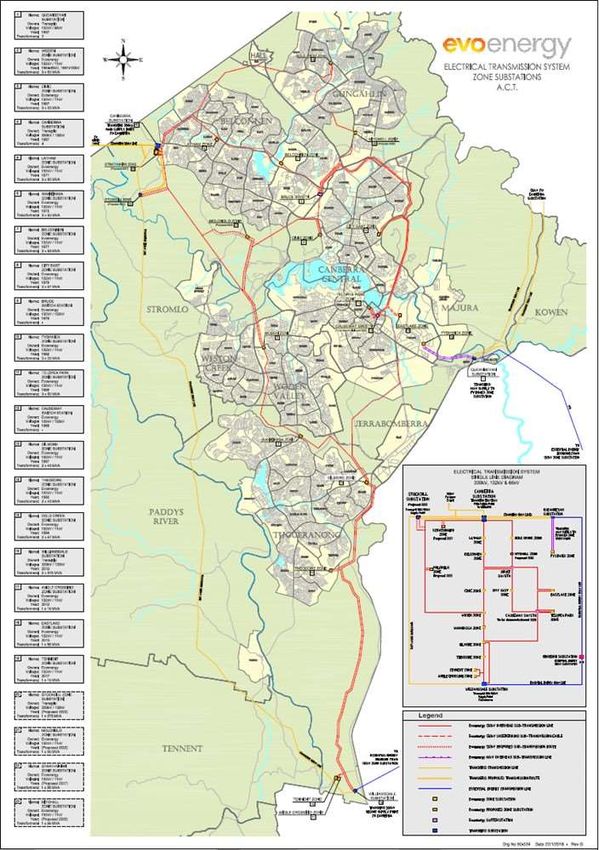
AECOM                                               Assessment of the Current State of Electricity and Gas Networks
                                                    Electricity and Gas Networks in the ACT
                                                    Commercial-in-Confidence

Quality Information
 Document             Electricity and Gas Networks in the ACT

                      60635230

 Ref                  https://aecom.sharepoint.com/sites/60635230actgasandelectricitynetwork
                      assessment/shared documents/general/6. report/act network
                      infrastructure assessment v2.docx

 Date                 08-Oct-2020

 Prepared by          Lucy Harrington, Jonathon Grzegrzolka, Jennifer Huynh

 Reviewed by          Mike Stoke

Revision History

                                                                                                     Authorised
 Rev         Revision Date           Details
                                                                              Name/Position                   Signature

 B           08-Oct-2020             Final Report                             Jason Gillard
                                                                              Project Director

08-Oct-2020
Prepared for – ACT Government - Environment, Planning and Sustainable Development Directorate – ABN: 31 432 729 493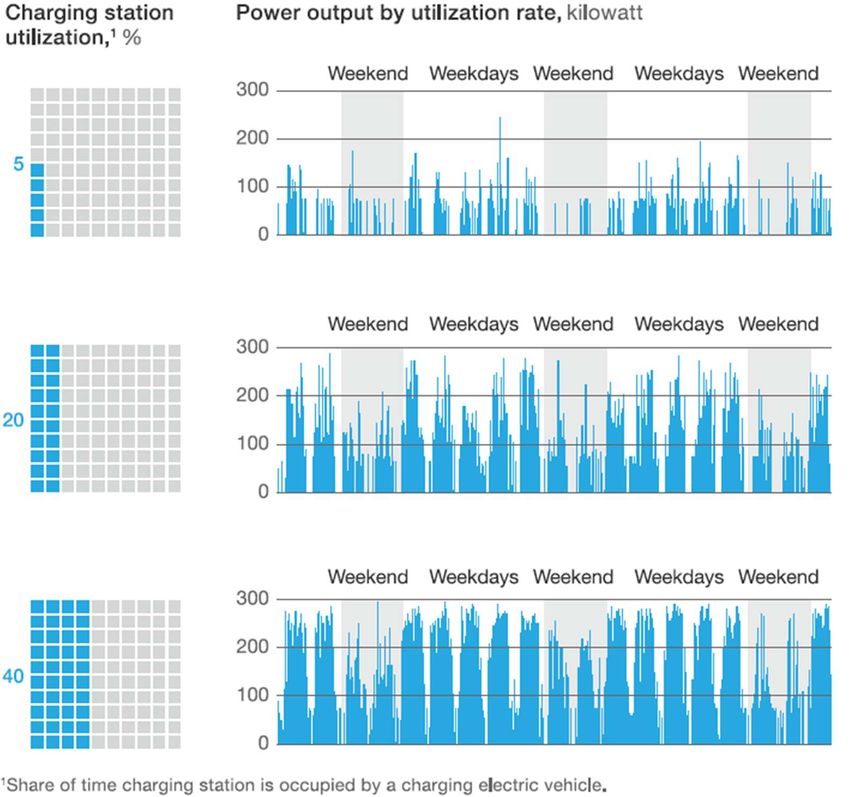
AECOM                                               Assessment of the Current State of Electricity and Gas Networks
                                                    Electricity and Gas Networks in the ACT
                                                    Commercial-in-Confidence

Table of Contents
Executive Summary                                                                                                       i
1.0      Introduction                                                                                                  1
2.0      The Current State of the Electricity Distribution Network                                                     2
         2.1       Electricity distribution capacity                                                                   3
         2.2       The state of the electricity distribution network                                                   5
         2.3       Poles                                                                                               7
         2.4       Overhead Conductors                                                                                10
         2.5       Underground Cable                                                                                  11
         2.6       Transformers                                                                                       12
         2.7       Performance of the electricity distribution network                                                13
         2.8       Key findings                                                                                       15
3.0      The Current State of the Gas Distribution Network                                                            16
         3.1       Gas pipelines                                                                                      18
         3.2       Regulated asset base                                                                               18
         3.3       Performance of the gas distribution network                                                        19
4.0      Energy Demand and Supply Capacity                                                                            20
         4.1       Energy Efficiency                                                                                  21
         4.2       The Energy Impact of Substituting Gas with Electricity                                             21
         4.3       Energy Available from Rooftop Solar                                                                22
         4.4       Other Sources of Energy to Substitute for Gas                                                      22
5.0      Strategies to reduce energy emission - Electricity Distribution Network                                      23
         5.1       Electric vehicles                                                                                  23
         5.2       Hydrogen-powered vehicles                                                                          29
         5.3       Distributed energy resources                                                                       31
         5.4       Large-scale energy storage                                                                         39
         5.5       District heating                                                                                   42
         5.6       Impacts on electricity supply                                                                      43
         5.7       Key findings                                                                                       44
6.0      Strategies to reduce energy emission - Gas Distribution Network                                              46
         6.1       Substitution of natural gas with hydrogen                                                          46
         6.2       Substitution of natural gas with biomethane                                                        49
         6.3       Termination of natural gas distribution                                                            50
         6.4       Key findings                                                                                       52
7.0      Summary of Findings                                                                                          53
8.0      Areas for Future Investigation                                                                               55
9.0      Abbreviations                                                                                                56
10.0     References                                                                                                   57
Appendix A
        Population Data                                                                                                A
Appendix B
        Planned Upgrades to Electrical Network                                                                         B

08-Oct-2020
Prepared for – ACT Government - Environment, Planning and Sustainable Development Directorate – ABN: 31 432 729 493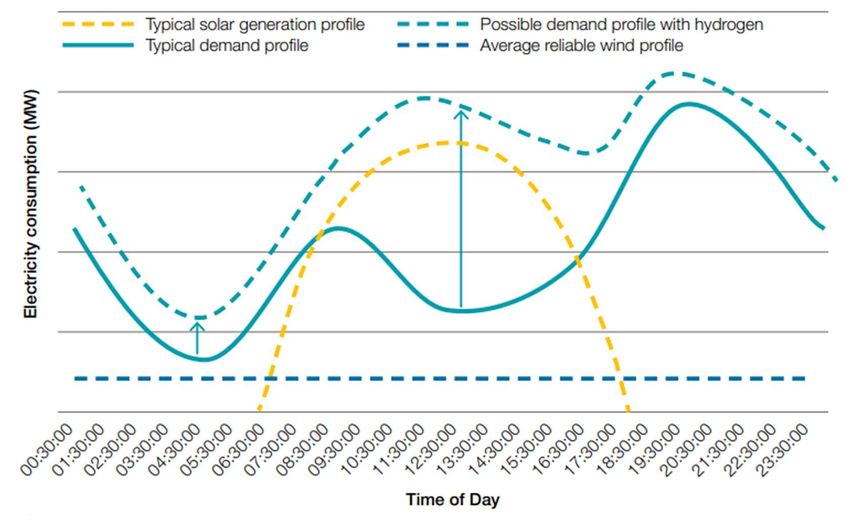
AECOM                                               Assessment of the Current State of Electricity and Gas Networks
                                                    Electricity and Gas Networks in the ACT
                                                    Commercial-in-Confidence

Table of Figures
Figure 1 The ACT electricity distribution system by zone                                                               2
Figure 2 Capacity by zone substation, summer 2020                                                                      5
Figure 3 Capacity by zone substation, summer 2031                                                                      5
Figure 4 Mean Condition and Life Expired by Asset Class                                                                7
Figure 5 Mean asset condition and life expired, poles                                                                  8
Figure 6 Mean asset condition by district, poles                                                                       9
Figure 7 Mean pole condition by suburb, Belconnen district                                                             9
Figure 8 Mean pole condition by suburb, Tuggeranong district                                                          10
Figure 9 Asset age profile – overhead conductors                                                                      10
Figure 10 Asset age profile – underground cable                                                                       11
Figure 11 Evoenergy capital expenditure forecast, HV underground cable                                                12
Figure 12 Asset age profile – transformers (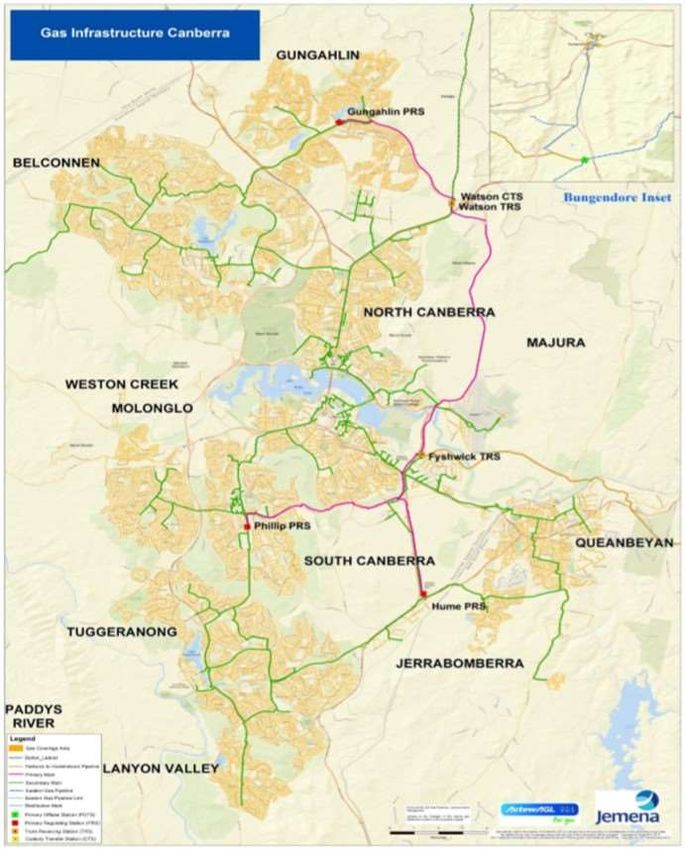
AECOM Assessment of the Current State of Electricity and Gas Networks i
Electricity and Gas Networks in the ACT
Commercial-in-Confidence
Executive Summary
The ACT Climate Change Strategy 2019-25 aims to achieve zero emissions from natural gas use by
2045. A key action of the Climate Change Strategy is a Plan to achieve zero emissions from natural
gas use by 2045, developed after consideration of the potential impacts of a transition to zero
emissions on the ACT’s current electricity and gas distribution networks.
The ACT Government engaged AECOM to assess the ACT’s current electricity and gas networks to
enable future modelling of transition pathways and enable development of the Plan.
Key findings of this study
Natural gas currently contributes about 20% of emissions in the ACT (ACT Government, 2019).
No viable options have been identified to eliminate emissions from natural gas, and substitutes
that could use the gas distribution network do not appear to be viable. Achievement of the zero
emissions target may therefore require that the use of natural gas be terminated.
We note that the ACT does not have enough feedstock to replace its natural gas use with
biomethane, and a range of issues make it unlikely that it would be viable to use hydrogen as a
substitute for natural gas, or to distribute hydrogen through the existing natural gas network.
The ACT’s current natural gas distribution network was assessed to be in good condition, and the
remaining service life of the network’s assets is likely to enable delivery of natural gas until
possible service termination by or before 2045.
Substitution of natural gas with electricity (based on 2018 consumption) would require that the
ACT’s current electricity supply capacity be increased by about 40-60% 1. The capacity required
would be greater again as the ACT’s population continues to increase, and with uptake in electric
vehicles. This can be offset by the uptake of renewable energy technology including distributed
energy storage.
Widespread adoption of hydrogen technology would affect the electrical network. This would rely
on fuel cells in vehicles or for energy storage, but production of green hydrogen to recharge the
fuel cells requires electricity (and water) and would therefore substantially increase demand for
electrical energy.
The ACT’s current electricity distribution network is designed around a set of substations and
feeders that serve energy to ACT suburbs via overhead lines or underground cables.
Evoenergy’s supply performance has been among the best in the Australian industry, and there is
no reason to conclude that with its regulatory environment (and continued effective oversight by
the regulator) and compliance with its own policies and procedures, Evoenergy’s performance will
not be maintained at historical levels.
Evoenergy has maintained its assets in a good condition and they are generally about halfway
through their expected service lives. It therefore seems likely that Evoenergy will continue to
keep its assets in a satisfactory condition so that it can continue to meet its mandated
performance targets, and that the regulator will approve the funding of this investment.
The main constraint in the network is supply capacity via the current substations. Evoenergy is
able to meet current expectations of peak demand with prudent contingency arrangements, but its
network does not have capacity to deliver the 40-60%1 increase in demand needed to substitute
natural gas with electricity. A substantial investment is therefore likely to be required to increase
supply capacity, which could be reduced but not avoided through implementation of peak demand
management strategies.
1
Estimated by AECOM considering the July 2018 demand peak, taking into account the relatively greater efficiency of electrical
appliances compared to gas appliances, refer to Section 4.0 for further discussion on projected energy demand and supply
capacity.
08-Oct-2020
Prepared for – ACT Government - Environment, Planning and Sustainable Development Directorate – ABN: 31 432 729 493
AECOM Assessment of the Current State of Electricity and Gas Networks ii
Electricity and Gas Networks in the ACT
Commercial-in-Confidence
Transition pathways policy implications
An impairment charge is likely if natural gas network is terminated in or before 2045. Termination
(make good) of a natural gas distribution network involves cleaning the pipes, sealing them and
abandoning them either empty or filled depending on their location.
A long-term decline in the use of natural gas as a result of the ACT Government’s policies would
avoid any need for network enhancement and minimise the investment required for asset
sustainment during the period.
Energy is lost when producing hydrogen (production of green hydrogen is not 100% efficient), so
it is unlikely that hydrogen or fuel cells would be viable ahead of electrical energy as a substitute
for natural gas, but this option is expected to be viable as a substitute for current transport fuels.
It appears unlikely that hydrogen would be piped to refuelling stations for safety and leakage
reasons, so this option does not appear to be a viable reason to retain the natural gas distribution
network. The trend appears to be to transport fuel cells rather than the hydrogen itself.
Hydrogen-based fuel cells can also be used for distributed energy storage.
It is possible to reduce peak demand and therefore reduce the impact on the electricity network:
- A continued rollout of rooftop solar energy (without energy storage) would reduce overall
demand but not reduce peak demand (which typically occurs in the early evening). The
rollout is likely to increase power quality issues caused by the bi-directional flow of power
and therefore force network upgrades and would increase the unit cost of grid electricity
(fixed costs would have to be recovered from a smaller quantity of energy served).
Rooftop generation currently has a penetration of about 16% in the ACT (SolarQuotes,
2020), but even at 100% penetration this resource would not be sufficient to fully substitute
for the natural gas .
It may be potentially be economic to encourage a high degree of energy self-sufficiency in
households based on rooftop solar generation and battery storage, and particularly if the
capacity to charge electric vehicles were included.
- The use of distributed (including community) energy storage associated with rooftop solar
energy generation has been shown to reduce peak demand. This strategy would reduce the
investment needed in the grid when natural gas is terminated but not eliminate it.
- The universal rollout of electric vehicles would increase overall demand for electricity but not
necessarily increase peak demand. Adoption of vehicle-to-home charging (using the vehicle
battery to serve energy to the home during peak demand periods and recharging off-grid
during off-peak periods) could potentially provide a sufficiently large resource to be a viable
substitute for natural gas (together with rooftop solar generation and distributed energy
storage).
With current technology, vehicle-to-home charging would shorten the life of the vehicle’s
battery, so this option may not be attractive to vehicle owners (batteries are typically about
45% of the vehicle cost (Bloomberg New Energy Finance, 2017)). Battery technology is
being improved, so the availability of affordable batteries with longer cycle lives would
alleviate this concern.
Commercial vehicles and long-distance travellers are likely to need fast charging facilities.
These are likely to be located more or less where petrol stations are currently located, but
those sites would need their electrical supply enhanced.
It has been estimated by Bloomberg New Energy Finance that electric vehicles will become
cost neutral with internal combustion engines around 2024 (Bloomberg New Energy Finance
(BNEF), 2019), so they are likely to become attractive trade-in options for the current private
vehicle fleet after that.
This report has identified several opportunities for future work to inform policy development at
Section 8.0.
08-Oct-2020
Prepared for – ACT Government - Environment, Planning and Sustainable Development Directorate – ABN: 31 432 729 493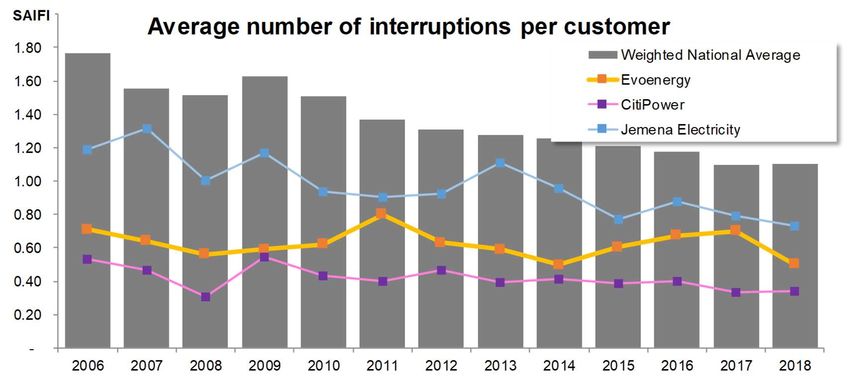
AECOM Assessment of the Current State of Electricity and Gas Networks 1
Electricity and Gas Networks in the ACT
Commercial-in-Confidence
1.0 Introduction
The ACT currently uses energy delivered via natural gas and electricity distribution networks:
The natural gas distribution system network is owned by Evoenergy Gas and operated by
Jemena. It consists of approximately 4,000km of pipeline and delivered approximately 8.2 PJ
(2,274 GWh) in 2018 (43% of the total energy supplied).
The electrical distribution network is owned and operated by Evoenergy. It consists of more than
2,300 km of overhead lines and 2,600 km of underground cables and supplied 2,986 GWh in
2018 (57% of the total energy supplied).
As of 2019-20, the ACT's electricity supply is 100% renewable, and the largest remaining sources of
emissions are transport (estimated at over 60%) and natural gas (over 20%) (ACT Government,
2019). The ACT Climate Change Strategy 2019-25 identifies an action for the ACT Government to
map out a pathway to transition towards zero emissions, focussed on the transport and gas sectors.
A key action of the Climate Change Strategy is the development of a Plan for achieving zero
emissions from natural gas use by 2045. The Plan will be released by 2024, and will enable the ACT
Government to develop a considered policy position which accounts for potential developments in zero
emissions technologies and appliances, and in alternatives to natural gas. It will also need to consider
the potential impacts of a transition to zero emissions on the ACT’s electricity and gas networks.
The ACT Government required an assessment of the ACT’s current electricity and gas networks for
use as the basis of future modelling of transition pathways for the ACT, and the study required was
awarded to AECOM.
The study is expected to provide an assessment of the impacts of strategies to reduce renewable
energy on the ACT’s electricity and gas network infrastructure, reporting on:
The current status (age and asset life) of the infrastructure;
Current supply performance;
Projected energy demand and supply capacity;
Strategies to reduce energy emissions in relation to both networks.
This report presents the findings of the study in several sections, including reviews of:
The current state of the ACT’s electricity distribution network;
The current state of the ACT’s gas distribution network;
Current and projected energy demand and supply;
The impact on the distribution systems of strategies to further reduce emissions, including
consideration of the potential impact of increasing use of electric vehicles;
Substitutes for natural gas, and their potential impact on the distribution systems.
08-Oct-2020
Prepared for – ACT Government - Environment, Planning and Sustainable Development Directorate – ABN: 31 432 729 493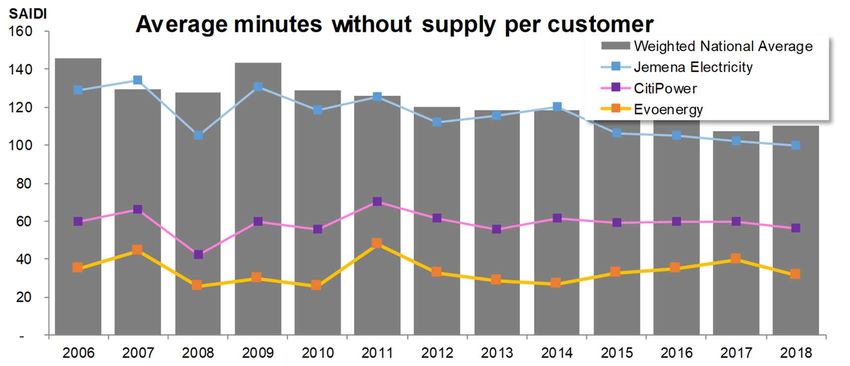
AECOM                                               Assessment of the Current State of Electricity and Gas Networks   2
                                                    Electricity and Gas Networks in the ACT
                                                    Commercial-in-Confidence

2.0           The Current State of the Electricity Distribution Network
A map of the network has been included for context (Figure 1 Source: (Evoenergy)).

Figure 1 The ACT electricity distribution system by zone

08-Oct-2020
Prepared for – ACT Government - Environment, Planning and Sustainable Development Directorate – ABN: 31 432 729 493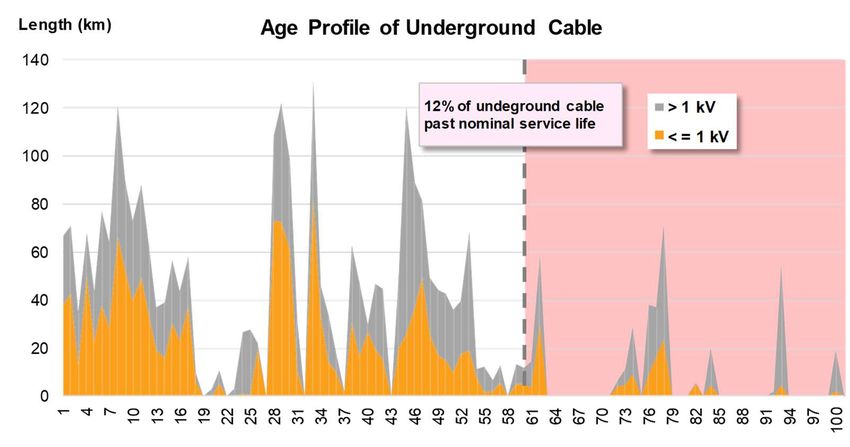
AECOM Assessment of the Current State of Electricity and Gas Networks 3
Electricity and Gas Networks in the ACT
Commercial-in-Confidence
This section summarises the current state of the ACT’s electrical network and provides an estimate of
the remaining life expectancy of current assets. It starts with an overview of the network taken from
Evoenergy’s recent submission to the Australian Energy Regulator (AER) and then summarises the
state of distribution assets and supply capacity by district as defined by Evoenergy using available
data. Evoenergy’s grouping of suburbs to supply zones and districts is attached as Appendix A.
It should be noted that:
Evoenergy, like all public distribution utilities, is subject to regular review by its regulator, and is
required to demonstrate during each review that it operates in a prudent and efficient manner.
Maximum prices for electricity are set by the regulator after each review and are influenced by
what the regulator considers efficient costs.
Evoenergy is monitored continually on its service performance, specifically including standard
performance measures of supply reliability, and must comply with mandated performance criteria.
A later section of this report demonstrates that Evoenergy performs well against these indicators.
Evoenergy has a set of asset class plans and asset management strategies that rely on historical
performance by asset class to predict the future risk of failure in the class. It uses that data to
plan asset refurbishment and renewal in order to achieve its mandated performance targets as
efficiently as possible.
2.1 Electricity distribution capacity
Electricity is distributed from a set of substations, each of which serves specific suburbs (more than
one substation can serve the same group of suburbs to provide redundancy and reliability). The
substations are located by Evoenergy in ‘zones’, and the Evoenergy uses the term ‘district’ to identify
zones which are served by more than one substation. The grouping of suburbs to Evoenergy’s zones
and districts, along with the population served in each case, is shown in Appendix A.
Since ‘capacity’ is measured at the substation (zone) and there is more than one substation serving a
zone, it is simplest to make an assessment of supply capacity using the ‘district’ grouping. Supply is
more complex than this suggests, because many of the zones can transfer load - the extent to which
load transfer can happen is shown in Table 1, which indicates the power (MVA) able to be transferred
from the district shown in the left column to the district shown in the top row of the table.
Table 1 Load transfer capability (simplified)
Presenting this load sharing accurately would make a district-based capacity assessment
unnecessarily complex, so for the purposes of this study supply and demand are compared at district
level (ignoring load transfers between districts). The transfer capacity shown is based on zone
substation transformer emergency rating (which in practice can only be used intermittently to avoid a
significant reduction in transformer life). Transfer capacity is also substantially limited by 11 kV feeder
capacity (for which data availability is limited).
08-Oct-2020
Prepared for – ACT Government - Environment, Planning and Sustainable Development Directorate – ABN: 31 432 729 493AECOM Assessment of the Current State of Electricity and Gas Networks 4
Electricity and Gas Networks in the ACT
Commercial-in-Confidence
An analysis of supply capacity is made in Table 2 and Table 3 (for summer and winter loads
respectively). The tables include:
The supply capacity by district, using the substation emergency two-hour rating measured in MVA
(noting that the emergency capability can only be used intermittently).
The capacity enhancement projects currently planned by Evoenergy to ensure that it is able to
satisfy future load projections. These projects are listed in Appendix B, and the additional
substation capacity has been included in the tables.
The current and projected population served in each of the districts (using the data attached in
Appendix A).
The 50% Probability of Exceedance (PoE) maximum demand by district by season for 2020, as
published by Evoenergy (Evoenergy, 2019).
Projections of peak demand by district by season extrapolated from expected population growth
(presented by suburb in Appendix A) and assuming that the current load per household remains
constant over the period. It should be noted that recent trends have shown a slow decline in
energy use per household, but for the purpose of this study the more conservative assumption
has been made. No allowance has been made here for substitution of electricity for gas.
The ratio of demand to capacity for 2018/19, 2031 and 2041, using colour coding to highlight
periods and districts where the projections indicate that capacity may be constrained (a red
highlight indicates that demand exceeds supply capacity, and orange indicates that demand is
projected to exceed 80% of installed capacity.
Table 2 Electricity demand and capacity projection by district, summer
Emergency Future Population Demand Demand /
District 2-hr Rating Project Capacity (MVA) Emergency 2-hr Rating
(MVA) (MVA) 2021 2031 2041 2020 2031 2041 2020 2031 2041
Belconnen 171 New Strathnairn ZSS. 226 104,255 125,005 140,297 109 143 169 64% 63% 75%
North Canberra & City 209 New Mitchell ZSS 264 59,437 79,500 90,088 134 177 169 64% 67% 64%
Canberra East 54 54 1,495 1,361 1,326 17 23 21 31% 43% 39%
Flyshwick
South Canberra 142 114 31,234 32,209 36,196 116 106 103 82% 93% 90%
decomissioning
Tuggeranong 219 219 87,941 86,547 88,922 133 135 151 61% 62% 69%
New third transformer
Gungahlin 76 131 82,118 86,644 86,905 68 72 73 89% 55% 55%
at Gold Creek
Tennent 15 15 1 3 3 7% 20% 20%
Woden Valley, Weston
Creek, Molonglo & 95 New Molonglo ZSS 150 77,536 111,211 138,739 77 111 124 81% 74% 83%
Urriarra - Namadgi
Total ACT 981 1,173 444,016 522,477 582,473 655 770 814 67% 66% 69%
Assuming no load sharing
Table 3 Electricity demand and capacity projection by district, winter
Emergency Future Population Demand Demand /
District 2-hr Rating Project Capacity (MVA) Emergency 2-hr Rating
(MVA) (MVA) 2021 2031 2041 2020 2031 2041 2020 2031 2041
Belconnen 190 New Strathnairn ZSS. 245 104,255 125,005 140,297 121 160 192 64% 65% 78%
North Canberra & City 257 New Mitchell ZSS 312 59,437 79,500 90,088 124 185 181 48% 59% 58%
Canberra East 54 54 1,495 1,361 1,326 18 23 21 33% 43% 39%
Flyshwick
South Canberra 142 114 31,234 32,209 36,196 101 109 108 71% 96% 95%
decomissioning
Tuggeranong 252 252 87,941 86,547 88,922 149 137 153 59% 54% 61%
New third transformer
Gungahlin 84 139 82,118 86,644 86,905 73 71 71 87% 51% 51%
at Gold Creek
Tennent 15 15 1 3 3 7% 20% 20%
Woden Valley, Weston
Creek, Molonglo & 114 New Molonglo ZSS 169 77,536 111,211 138,739 80 134 156 70% 79% 93%
Urriarra - Namadgi
Total ACT 1,108 1,300 444,016 522,477 582,473 667 821 886 60% 63% 68%
Assuming no load sharing
08-Oct-2020
Prepared for – ACT Government - Environment, Planning and Sustainable Development Directorate – ABN: 31 432 729 493AECOM Assessment of the Current State of Electricity and Gas Networks 5
Electricity and Gas Networks in the ACT
Commercial-in-Confidence
There are variations by district (Gungahlin is currently being upgraded, but South Canberra appears to
need more capacity in the future).
Total demand is anticipated to be at around 68% capacity by 2041. This reflects the firm capacity
concept applied for planning, which allows for credible contingency events such as the unavailability of
one transformer. For a substation with three transformers, this represents a maximum load at around
66% of installed capacity.
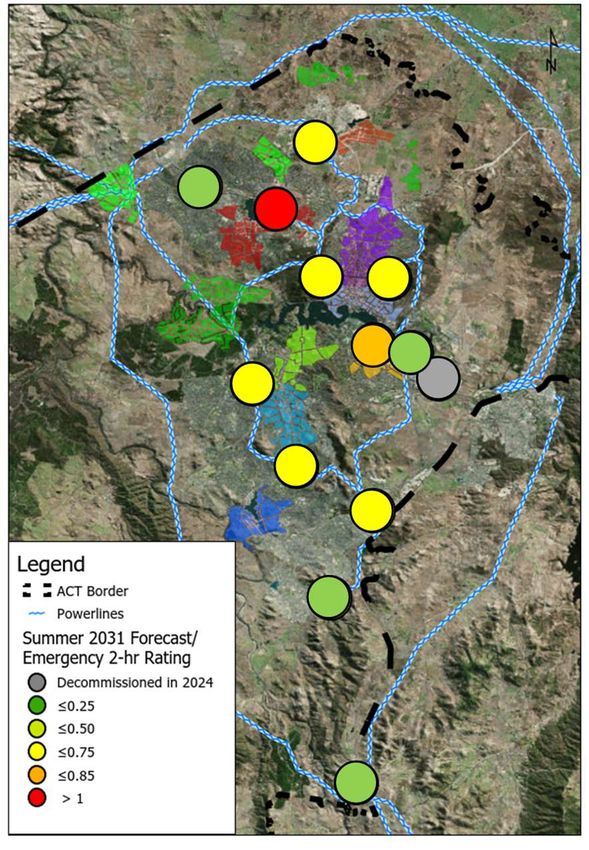
The capacity analysis is presented visually, where the substations are located on the map of the ACT
using dots, and the colour of the dot reflects current capacity utilization (Figure 2) and expected
capacity utilisation in 2031 (Figure 3).
Figure 2 Capacity by zone substation, summer 2020 Figure 3 Capacity by zone substation, summer 2031
In addition to the capacity of zone substations addressed in this section, the ability to meet demand
may be constrained by other network elements (notably; feeders and switchboards). A number of
capacity issues already exist with network feeders, as detailed in Appendix B.
2.2 The state of the electricity distribution network
The ACT’s electrical distribution network by asset class, adapted from Evoenergy’s 2019 submission
to the Australian Energy Regulator (AER), is shown in summary form in Table 4 (EvoEnergy, 2019). 2 3
4
2
For wooden poles which have been staked (reinforced to extend service life), the reported life expired and life remaining is
based on the date of pole staking.
3
The reported life expired and life remaining for zone substations is based on the commissioning date of the substation (as
reported in Evoenergy’s Annual Planning Report) and does not account for any refurbishment works since undertaken.
4
Asset life expectancies are as contained in Evoenergy’s submissions to the AER, where available.
08-Oct-2020
Prepared for – ACT Government - Environment, Planning and Sustainable Development Directorate – ABN: 31 432 729 493AECOM Assessment of the Current State of Electricity and Gas Networks 6
Electricity and Gas Networks in the ACT
Commercial-in-Confidence
Table 4 Network Summary
Table 4 indicates that the assets are generally in a satisfactory condition (based on the proportion of
expected service life remaining).
It is easier to visualise their condition using a lifecycle display format as presented in Figure 4, which
shows current mean asset condition and remaining service life expectancy by asset class against a
standardised asset deterioration curve.
For simplicity, a normal failure distribution has been used for the presentation, but it should be noted
that each asset has its own specific failure distribution derived from Evoenergy’s asset history, and
these are used by Evoenergy to predict condemnation rates for all its important assets.
In Figure 4 the dotted line illustrates a standardised asset deterioration curve based on a normal
distribution of failure. The vertical axis shows asset condition on a 5 point scale, where a rating of 4 is
used to indicate the point in the asset’s service life where it would be condemned or de-rated because
the risk of being unable to meet minimum service performance targets becomes unacceptable. For
assets where condition is the primary cause of failure, a prudent and efficient operator would generally
keep their assets at an average rating of about 3, representing a suitable trade-off of cost and risk to
service levels. 5The size of the bubble reflects the regulatory asset base (RAB) value.
5
Condition is however not the primary cause of failure for all assets. For instance, failure of overhead cable can be caused more
often by weather events than deterioration of the cable itself. For other (non-critical) assets, failure will not result in an
unacceptable outage (by definition) and it can be more cost-effective to run these to failure. An assessment of asset criticality
has not been undertaken for the purpose of this study.
08-Oct-2020
Prepared for – ACT Government - Environment, Planning and Sustainable Development Directorate – ABN: 31 432 729 493AECOM Assessment of the Current State of Electricity and Gas Networks 7
Electricity and Gas Networks in the ACT
Commercial-in-Confidence
Figure 4 Mean Condition and Life Expired by Asset Class
Figure 4 and Table 4 (based on Evoenergy’s submission to the AER (EvoEnergy, 2019)) indicate that:
Evoenergy’s overhead Cables are (on average) in a marginal condition with about 10% of
expected service life remaining. These overhead conductors are predominately aluminium, with
short slack spans in a non-corrosive environment and are not overloaded, so they would be
expected to experience minimal deterioration. The mean useful life (and remaining life) as
reported by Evoenergy’s may reflect accounting assumptions rather than the expected service life
and these assets may have a longer service life than indicated.
Almost all other asset classes are in good to adequate condition, with expected remaining life
ranging from 25% for hardwood poles and zone substations, 45% for underground cables, 50%
for distribution substation assets and more for other pole types.
Underground cables are the largest asset class by RAB value.
The brief for this study includes an assessment of capacity and asset condition by geographic area.
The data provided by Evoenergy to the AER in its pricing submission is aggregated by asset class and
does not include data by location, so we have relied on detailed pole and cable data from 2015 to
derive a summary of life expired and remaining life by area (using Evoenergy’s districts) as an
indication of the state of the network in each district. It is noted that actual condition may vary from the
expected condition presented in this section, due to usage, the level of historic maintenance
undertaken, and other environmental or operational factors.
2.3 Poles
The 2015 pole data available for this study includes all poles in the network at that time by suburb and
can be aggregated by pole type and service district to provide a useful summary of this asset class.
We have adjusted the data by assuming that Evoenergy will have continued (since 2015) to apply its
management strategies as documented in its asset class plans, and will therefore have reinforced or
condemned and replaced all poles that would have met its condemnation criteria over the period.
08-Oct-2020
Prepared for – ACT Government - Environment, Planning and Sustainable Development Directorate – ABN: 31 432 729 493AECOM Assessment of the Current State of Electricity and Gas Networks 8
Electricity and Gas Networks in the ACT
Commercial-in-Confidence
Figure 5 presents a summary of the current mean asset condition of the poles. The size of the
bubbles in the chart represents the aggregated replacement cost for the population of poles assumed
to be present in the network as of 2020 (including poles reinforced or replaced since 2015).6
Figure 5 Mean asset condition and life expired, poles
The pole asset class is estimated to have approximately 20% of its life remaining (on average). We do
not have information on new lines added since 2015. These new poles added to the existing
population would slightly improve the average condition of the class, so the data shown in Figure 5 will
slightly understate the remaining life of the current asset population.
This data is shown by service district in Figure 6.
6
This analysis is based on data dated 2014. Condition was projected forward to the current date, and a rate of pole renewal
consistent with historic levels assumed to have occurred over the period.
08-Oct-2020
Prepared for – ACT Government - Environment, Planning and Sustainable Development Directorate – ABN: 31 432 729 493AECOM Assessment of the Current State of Electricity and Gas Networks 9
Electricity and Gas Networks in the ACT
Commercial-in-Confidence
Figure 6 Mean asset condition by district, poles
Pole condition by districts is consistently in the targeted adequate condition range. A more detailed
view of pole condition by suburb is shown for the two largest districts by value (Belconnen and
Tuggeranong) in Figure 7 and Figure 8 respectively.
Figure 7 Mean pole condition by suburb, Belconnen district
08-Oct-2020
Prepared for – ACT Government - Environment, Planning and Sustainable Development Directorate – ABN: 31 432 729 493AECOM Assessment of the Current State of Electricity and Gas Networks 10
Electricity and Gas Networks in the ACT
Commercial-in-Confidence
Figure 8 Mean pole condition by suburb, Tuggeranong district
There are areas where the pole population is older and has shorter remaining service life expectancy
than others. We note, however, that Evoenergy has continued to meet is performance obligations
(refer to the Section 2.7), has policies and procedures to manage its asset base documented in a set
of asset class plans, and will continue to be regulated, so there will continue to be effective oversight
of its performance. In these circumstances, it seems likely that Evoenergy will continue to effectively
manage its risk of asset failure in the future, and therefore that it will keep its assets in approximately
their current satisfactory state of repair for the foreseeable future.
2.4 Overhead Conductors
The age profile of overhead conductors is presented in Figure 9 (EvoEnergy, 2019).
Figure 9 Asset age profile – overhead conductors
08-Oct-2020
Prepared for – ACT Government - Environment, Planning and Sustainable Development Directorate – ABN: 31 432 729 493AECOM Assessment of the Current State of Electricity and Gas Networks 11
Electricity and Gas Networks in the ACT
Commercial-in-Confidence
Approximately 36% of overhead conductors by length are currently past the nominal service life of the
cable (which is generally assumed by Evoenergy to be 50 years).
As noted in Section 2.2, the overhead conductors have a longer service life expectancy than
underground cable and appear to have experienced less deterioration to date than implied by their
age, indicating that the assets may be in better condition than expected. If this is the case, current
projections of renewal timetables and funding for the overhead conductors may be able to be deferred.
2.5 Underground Cable
The age profile of underground cable in the ACT is presented in Figure 10 (EvoEnergy, 2019).
Figure 10 Asset age profile – underground cable
Different types of cable have different life expectancies, ranging from 70 years for paper insulated
cables to 45 years for polymeric insulated cable assets (Evoenergy, 2018). Approximately 12% of
underground cables by length are currently past the nominal service life of the cable.
It is generally expected that as sections of the network are replaced over time, there will be a trend
toward a steady state of asset renewal. The age profile of the cable population is not evenly
distributed, however, and a relatively large percentage is expected to reach nominal end of life from
around 2025. This should cause a short-term step-up in the rate of cable renewals.
Evoenergy’s FY18 forecast for capital expenditure on high-voltage underground cable, shown in
Figure 11, demonstrates this expectation by showing an increases in capital required for the FY24-29
period (Evoenergy, 2018).
08-Oct-2020
Prepared for – ACT Government - Environment, Planning and Sustainable Development Directorate – ABN: 31 432 729 493AECOM Assessment of the Current State of Electricity and Gas Networks 12
Electricity and Gas Networks in the ACT
Commercial-in-Confidence
Figure 11 Evoenergy capital expenditure forecast, HV underground cable
2.6 Transformers
The age profile of transformers rated for less than 22kV (distribution substation and pole mounted
transformers) is presented in Figure 12 (EvoEnergy, 2019).
Figure 12 Asset age profile – transformers (AECOM Assessment of the Current State of Electricity and Gas Networks 13
Electricity and Gas Networks in the ACT
Commercial-in-Confidence
Figure 13 Asset age profile – zone substation transformers
Approximately 22% of the zone substation transformers appear to be currently past their nominal
service life (which is generally assumed by Evoenergy to be 45 years), but investment in zone
substations is likely to be driven by capacity constraints, not asset condition (Section 2.1).
2.7 Performance of the electricity distribution network
The quality and performance of the electricity distribution service in the ACT is mandated, and
Evoenergy reports its performance annually. Two commonly used indicators of performance are
supply interruption duration (SAIDI) and supply interruption frequency (SAIFI), both of which have
mandated maximum performance levels.
Figure 14 and Figure 15 show unplanned SAIDI and SAIFI compared to the AER’s Service Target
Performance Incentive Scheme (STPIS) (Evoenergy, 2019).
Figure 14 Duration of unplanned interruptions in minutes per customer per year (SAIDI)
08-Oct-2020
Prepared for – ACT Government - Environment, Planning and Sustainable Development Directorate – ABN: 31 432 729 493AECOM Assessment of the Current State of Electricity and Gas Networks 14
Electricity and Gas Networks in the ACT
Commercial-in-Confidence
Figure 15 Frequency of unplanned interruptions per customer per year (SAIFI)
While Evoenergy appears to have breached the STPIS in the past, it is actually one of the best
performing distributors nationally when the performance data is normalised to customer numbers
(Figure 16 and Figure 17) (AER, 2019).
Figure 16 SAIDI performance compared to national average
Figure 17 SAIFI performance compared to national average
08-Oct-2020
Prepared for – ACT Government - Environment, Planning and Sustainable Development Directorate – ABN: 31 432 729 493AECOM Assessment of the Current State of Electricity and Gas Networks 15
Electricity and Gas Networks in the ACT
Commercial-in-Confidence
It appears that the rest of the industry is gradually improving, but Evoenergy has remained one of the
best performing electricity distributors in Australia. This may be partly due to its relatively small
network size, the dense customer base (number of connections per km) and the degree of network
interconnectivity – its performance is more aligned with performance of other small, urban networks
such as CitiPower and Jemena Electricity. Evoenergy includes in its customer base important
government institutions that have a national impact, and needs to maintain high reliability services to
satisfy them.
The regulatory regime active in Australia retains a strong focus on performance, and Evoenergy, like
all other distributors, must withstand scrutiny from the AER and its agents at 5-year intervals. In this
environment, it seems reasonable to assume that past performance is a likely indicator of future
performance, and that Evoenergy should be able to continue the performance it seems to have
consistently achieved over the past 14 years.
2.8 Key findings
Evoenergy has planned substation enhancements to ensure that it is able to satisfy future demand,
using current assumptions of population growth and demand per household. The forecast load on the
network is around 68-69% of installed capacity by 2041. Noting that Evoenergy cannot operate at
100% of installed capacity (will rather need to operate at around 65-80% of installed capacity to
account for credible contingency events), there is limited spare capacity available. The ACT’s supply
capacity is closely related to demand projections, and Evoenergy would be expected to continue to
retain a prudent reserve. It could therefore be concluded that supply capacity will remain suitable
based on current projections.
If electricity were to be used to substitute for natural gas, however, total energy demand would
increase by at least 40-60%. Evoenergy’s current plans do not provide for this scale of increase.
There are other factors to consider, and some of these are addressed later in this report. For
example:
Widespread use of electrical vehicles may add off-peak load but provide new mechanisms to
manage demand peaks.
The continued development of distributed energy storage, coupled with continued investment in
rooftop and district solar generation options, may also enable peak demand to be minimised and
therefore reduce the extent of the capacity upgrades needed in the supply network.
08-Oct-2020
Prepared for – ACT Government - Environment, Planning and Sustainable Development Directorate – ABN: 31 432 729 493AECOM Assessment of the Current State of Electricity and Gas Networks 16
Electricity and Gas Networks in the ACT
Commercial-in-Confidence
3.0 The Current State of the Gas Distribution Network
This section summaries the current state of the ACT’s gas network assets. A map of the distribution
network is presented in Figure 18 (ActewAGL Distribution, 2015)).
Figure 18 ACT gas network
This section draws from Evoenergy’s recent submission to the Australian Energy Regulator (AER). It
includes a summary of the gas pipelines and a projection of the value of the regulated asset base of
gas assets (assuming that no further material investment will be undertaken).
Since current policies are likely to reduce or terminate the use of natural gas and Evoenergy has met
operational targets with higher levels of gas demand, a review of gas supply capacity is redundant and
has not been undertaken. The use of other forms of energy generation is assessed in Section 6.0.
08-Oct-2020
Prepared for – ACT Government - Environment, Planning and Sustainable Development Directorate – ABN: 31 432 729 493AECOM Assessment of the Current State of Electricity and Gas Networks 17
Electricity and Gas Networks in the ACT
Commercial-in-Confidence
Table 5 presents a summary of the gas network status, with asset quantities, life expectancies and
asset values (where available) adapted from Evoenergy’s June 2020 access arrangement proposal to
the AER (Evoenergy Gas, 2020), (Evoenergy Gas, 2020).
Table 5 Network Overview
In general, Table 5 indicates that the gas network assets are relatively new and are on average in
good condition.
Figure 19 presents this graphically using the same form of presentation used for the electricity
network, showing mean asset condition, remaining service life expectancy, and RAB value by asset
class.
Figure 19 Mean Condition and Life Expired by Asset Class
Figure 19 shows that expected remaining life ranges from 60% (for low to medium pressure pipelines)
to 75% (for high pressure pipelines).
The data provided by Evoenergy to the AER is aggregated by asset class and does not include more
detailed data by service district.
08-Oct-2020
Prepared for – ACT Government - Environment, Planning and Sustainable Development Directorate – ABN: 31 432 729 493AECOM Assessment of the Current State of Electricity and Gas Networks 18
Electricity and Gas Networks in the ACT
Commercial-in-Confidence
3.1 Gas pipelines
Figure 20 presents the age profile of gas pipelines (ActewAGL Distribution, 2015). 7
Figure 20 Age distribution of gas pipelines
No gas pipelines have yet reached nominal service life expectancy (50 years for medium pressure
mains and 80 years for high pressure mains).
3.2 Regulated asset base
In the context of a policy to reduce emissions, the scale of asset impairment that might result from
termination of the natural gas supply should be of interest. Figure 21 shows a simple estimate of the
regulated asset base of gas assets projected forward to 2045, using published service life
assumptions as reported to the AER in Evoenergy’s 2020 submission, and assuming that no
substantive investment would take place during the period (the assets are currently at an early stage
of their expected service life) (Evoenergy Gas, 2020).
Figure 21 Projected regulated asset value
7
This analysis is based on data dated June 2015, extrapolated to the current period excluding asset acquisitions and/or asset
renewals over the period.
08-Oct-2020
Prepared for – ACT Government - Environment, Planning and Sustainable Development Directorate – ABN: 31 432 729 493AECOM Assessment of the Current State of Electricity and Gas Networks 19
Electricity and Gas Networks in the ACT
Commercial-in-Confidence
The value in current dollar terms of the regulated asset base of the gas distribution system is
estimated to decrease to $88 million in 2045, including $58 million of high pressure mains and $30
million of medium pressure services.
3.3 Performance of the gas distribution network
Evoenergy reported being compliant (for the 2018-19 reporting period) with its licence to provide gas
distribution and connection services under the Utilities Act 2000, and being compliant to code
requirements under the Utilities (Technical Regulation) Act 2014 (Environment, Planning and
Sustainable Development Directorate).
Figure 22 presents unplanned outages over the FY11-19 period (Evoenergy Gas, 2020).
Figure 22 Unplanned Outages
In FY19, Evoenergy’s target was less than 500 major unplanned outages affecting more than five
customers (Evoenergy, 2020), but actual outages were far lower than this and none affected more
than five customers in FY19. Figure 23 presents SAIFI, calculated per thousand customers per year.
The SAIFI target for the FY22-26 period included in Evoenergy’s June 2020 proposal is also included
for context (Evoenergy, 2020).
Figure 23 Frequency of unplanned interruptions per thousand customers per year (SAIFI)
SAIFI has decreased in recent years (FY18-19), and future targets are aligned with this recent
performance. If the gas distribution system is terminated under current Government policy, demand
for gas will reduce in the future and any performance issues will become less significant.
08-Oct-2020
Prepared for – ACT Government - Environment, Planning and Sustainable Development Directorate – ABN: 31 432 729 493AECOM Assessment of the Current State of Electricity and Gas Networks 20
Electricity and Gas Networks in the ACT
Commercial-in-Confidence
4.0 Energy Demand and Supply Capacity
The ACT uses energy delivered via natural gas and electricity distribution networks:
The natural gas distribution system network delivered approximately 8.2 PJ (2,274 GWh) in 2018
(43% of total energy supplied).
The electrical distribution network supplied 2,986 GWh in 2018 (57% of total energy supplied).
Data published by the Department of the Environment, Water, Heritage and the Arts (2008) indicates
that approximately 78% of the gas energy supplied to households in the ACT is used for space heating
(the remainder is used mainly for water heating and cooking). Energy demand from natural gas peaks
during winter, and in 2018 the demand for gas peaked at about 60% of total energy demand, as
indicated in Figure 24 (Evoenergy, 2020).
Figure 24 Energy demand in the ACT (2018)
Although the ACT population is projected to continue increasing, current Government policy in relation
to emissions is expected to incentivise substitution of electricity for gas, reducing total demand for gas
by about 10% over the 2021-26 period (Figure 25). (Evoenergy, 2020).
Figure 25 Historic and forecast gas usage
08-Oct-2020
Prepared for – ACT Government - Environment, Planning and Sustainable Development Directorate – ABN: 31 432 729 493AECOM Assessment of the Current State of Electricity and Gas Networks 21
Electricity and Gas Networks in the ACT
Commercial-in-Confidence
4.1 Energy Efficiency
Electric appliances are more energy efficient than the gas appliances which they would replace,
however (Department of Industry, Science, Energy and Resources, n.d.). Reverse-cycle air
conditioning systems, for example, are significantly more efficient than gas heaters. 10 megajoules of
useful heat delivered using a reverse cycle air condition system (a ‘heat pump’) requires supply of 2.6
megajoules of energy, whereas delivery via a gas heating system requires 33.4 megajoules (Figure
26) (Beyond Zero Emissions, 2013). Other gas appliances (such as those used for cooking and water
heating) are also less energy efficiency than their electric substitutes.
Figure 26 Efficacy of Gas Burner System Compared to Reverse Cycle Air Conditioner (Heat Pump)
4.2 The Energy Impact of Substituting Gas with Electricity
If the ACT Government’s 2045 net zero emissions target is to be achieved by substituting electricity for
natural gas, electricity distribution capacity will need to be increased. Gas provided about 60% of the
July 2018 peak energy demand (Figure 25), which suggests that the supply capacity of the electrical
network could need to be increased by around 150% to substitute for gas.
Replacement of the inefficient gas heaters with reverse cycle air conditioners (or similar heating
systems) would significantly reduce the increase in energy required, however, and we estimate that
the increase in electricity supply and distribution capacity needed to supply peak energy demand
during winter (for the 2018 population of the ACT) would be in the range of 40-60%, assuming that:
78% of the gas energy supplied in 2018 was used for heating;
Between 100% (lower limit of the range) and 25% (upper limit of the range) of current users of
gas heating would replace them with split cycle systems;
Other gas appliances are typically 85% energy efficient compared to equivalent electric
appliances, and would be replaced with electrical appliances.
Other measures such as the introduction of more energy efficient appliances and peak demand
management could further reduce the scale of that increase.
08-Oct-2020
Prepared for – ACT Government - Environment, Planning and Sustainable Development Directorate – ABN: 31 432 729 493AECOM Assessment of the Current State of Electricity and Gas Networks 22
Electricity and Gas Networks in the ACT
Commercial-in-Confidence
4.3 Energy Available from Rooftop Solar
The penetration of rooftop solar energy production in the ACT is currently about 16%, representing
about 76MW of installed capacity. If 100% penetration could be achieved, the possible maximum
generation capacity available (in summer) is likely to be less than 500MW (SolarQuotes, 2020).
Solar irradiation is reduced during winter, which is when the greatest demand for energy occurs (for
heating), so the actual energy generated will be lower. It is clear, however, that a 100% rollout of
rooftop solar energy generation at current panel efficiency levels will not provide enough generation
capacity to substitute for all the energy currently served via natural gas.
Further, such a significant uptake in solar penetration is likely to lead to power quality issues and
network instability (as discussed at Section 5.3). The network would not be able to support solar
penetration anywhere near this level this without significant investment to support bidirectional energy
flows in zone substations.
4.4 Other Sources of Energy to Substitute for Gas
We note in Section 6.2 that the feedstock for bioenergy production in the ACT is limited, and the likely
maximum supply capacity is only around 3% of the ACT’s energy demand. Bioenergy cannot
therefore be considered a complete substitute for natural gas.
We review in Section 6.1 the potential for green hydrogen to be used as a substitute for natural gas:
Current gas appliances will continue to work effectively with hydrogen blended with the natural
gas up to about 15% only, so hydrogen cannot completely replace the gas.
Green hydrogen production (using electrolysis) is currently 60% - 80% efficient (depending on the
technology used). While hydrogen could be considered a potential substitute for natural gas, in
practice it is not a viable alternative to electricity (the solar generation capacity required to
manufacture hydrogen would be more cost effective and energy efficient if used directly by
consumers).
Grid-scale hydrogen storage via fuel cells has a relatively low round trip efficiency (in the range
30-40%) compared to other commercially viable technologies (such as utility scale battery
storage, which has an efficiency in the range 85-95%).
08-Oct-2020
Prepared for – ACT Government - Environment, Planning and Sustainable Development Directorate – ABN: 31 432 729 493AECOM Assessment of the Current State of Electricity and Gas Networks 23
Electricity and Gas Networks in the ACT
Commercial-in-Confidence
5.0 Strategies to reduce energy emission - Electricity
Distribution Network
The electrical network in the ACT is operated by Evoenergy and covers an area of 2,358 km 2, serving
a population of about 420,000 with over 2,300 km of overhead lines and 2,600 km of underground
cables. Net peak demand of the network is 587 MW (Evoenergy Gas, 2020).
The strategies that the ACT Government uses to transition toward zero emissions may have a positive
or a negative impact on the existing electricity distribution network. These potential impacts have
been grouped into three main themes for the purposes of this study:
The increasing penetration of electric vehicles for private and public use.
The impact of increasing distributed energy sources on the distribution network
The implementation of district heating.
5.1 Electric vehicles
In 2020, transport was estimated to cause more than 60% of the ACT’s emissions, mostly via fossil
fuel use by private cars. The transition to zero emissions vehicles is a key focus of the ACT’s transport
and climate strategies, and a global shift toward zero emission vehicles is underway - the United
Kingdom and France intend to ban sales of new petrol and diesel cars by 2040, for example, and
some car manufacturers (such as Volvo and General Motors) intend to phase out fossil fuel powered
vehicles (ACT Government, 2018).
The main types of passenger electric vehicles (EVs) are presented in Figure 27 (ACT Government,
2019).
Figure 27 Types of Electric Vehicles
08-Oct-2020
Prepared for – ACT Government - Environment, Planning and Sustainable Development Directorate – ABN: 31 432 729 493AECOM Assessment of the Current State of Electricity and Gas Networks 24
Electricity and Gas Networks in the ACT
Commercial-in-Confidence
Bloomberg estimated that the ownership cost of EVs for private use may reduce below that of fossil
fuel vehicles as early as 2024, which suggests that a rapid transition could occur after then as the
current fossil fuel fleet is traded in (Bloomberg New Energy Finance (BNEF), 2019). An uptake in EV
use presents challenges to the existing electricity distribution network, and the impact of EVs will
depend on interrelated factors including:
The impact of driver and charging behaviour on peak loads (which differs for different EV use
cases);
Requirements and distribution of charging infrastructure;
Demand management strategies like smart charging, planned placement of charging
infrastructure, the use of Vehicle-to-Grid (V2G), Vehicle-to-home (V2H) and alike technologies;
The capacity and configuration of the existing distribution network.
Driving and Figure 28 shows the charging patterns of household and fleet EVs in a Victorian
charging Government trial. Household EVs generally charge at night (which roughly aligns with
behaviours existing peak periods), while fleet EVs tend to charge during business hours
(EVENERGI, 2019).
Figure 28 EV Charging Demand Profiles for Fleet and Households (Victorian Government EV Trial)
It is estimated that in an unmanaged charging scenario (where 80% of EV users
charged at peak periods), total peak demand of the National Energy Market could
increase by 1.9GW by 2030. EVs could be charged during the off-peak period,
however, using demand management strategies like smart charging, which would
decrease peak demand and increase the utilisation of existing network capacity
(AECOM, 2011) (Mullan, Harries, Braunl, & Whitely, 2011). The cooler temperatures
during off-peak, night-time charging allow assets like conductors and transformers to
take a higher load without being damaged (AECOM, 2011).
There is potential for the energy needed to charge EVs to be supplied by renewable
energy generation if market arrangements and infrastructure are in place to enable the
matching of supply with demand. AECOM estimates that by 2030, EV energy demand
would represent around 13% of total renewable energy generation in the NEM
(AECOM, 2011).
08-Oct-2020
Prepared for – ACT Government - Environment, Planning and Sustainable Development Directorate – ABN: 31 432 729 493You can also read