2004 Metro Transit Bus Strike - Nebiyou, Mike, and Charles CE 5212 case study #4 Oct 6, 2004
←
→
Page content transcription
If your browser does not render page correctly, please read the page content below
2004 Metro Transit
Bus Strike

Nebiyou, Mike, and Charles

CE 5212 case study #4
Oct 6, 2004
Twin Cities Bus Strike
March 2004 – Members of Amalgamated Transit Union local 1005
voted to strike.
Were Objecting to:
Council’s proposal to increase health
insurance premiums for working members
and cut health care coverage for retirees.
Its proposal to freeze wages for 2004 and
have a 1% increase the next year
Strike lasts 6 weeks. Members agree to terms that are much less
than what they were demanding.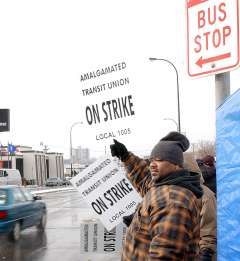
Transit Labor Relations - History
Unions in transit industry go back a long way
Mid 1800s – Workers on New York’s Third Avenue streetcars unionized Short
lived.
1885 a more stronger union formed – got concessions from management –
encouraged unionization elsewhere in transit industry.
1892 – 1st Nation wide transit workers union – what has today become the ATU.
1910 – 1920 Emergence of Bus Transport in cities.
Bus transport provided by private companies
Through World War II increased use of busses.
Fuel was scarce
Rubber was scarce
After WWII Roads Expanding
Rising Incomes
Cars becoming affordable
Transit ridership declines.
1950s and 60s – Transit firms in financial crisis - pay cuts, strikes, financial
woes – many transit companies went out of business.History…Continued
1964 - UMTA passed by congress.
Provided federal funds for states/cities to own and operate their own
transit systems.
Ensured that collective bargaining rights would be preserved as
employees moved from privately owned transit companies to public
companies.
At the state level, ATU and local leaders push for legislation for local
public transit systems.
States had to allow collective bargaining for transit workers in order
to qualify for federal funding.
By 1970’s most transit systems are publicly owned and operated.
Workers right’s to strike without loss of job is assured.To Strike or Not to Strike…
Labor –Why not strike?
Loss of income
Company may end up in a worse financial situation
Labor– Why strike?
Last bargaining chip.
Gives company incentives to settle disputes.Incentives to Settle
Private Sector
Profit
maximizers
Loss of Revenue
Loss of trained workers
Competition can harm company’s position in industry
Public Sector
Not profit maximizers
No competition, except from other modes
Loss of revenue not as big a player here.
Indirect pressure from the public through the
Legislature and Governor's office.Who was affected?
Bus Drivers/Passengers
Loss of job/regular form of travel
Drivers
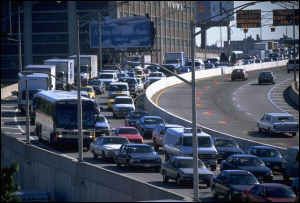
Heavier traffic levels
Greater usage of parking lots
Bikers/Pedestrians
Theft
Increase in densityStrategies for Mitigation
Few and far between
Drive, bike or walk
Commuters ->
parking lots/meters
Timeframe of strike (early March until mid-
April) was an issue
Slushy/snowy/wet roads and sidewalksEffect on Congestion
Some, but not more than
expected
Commuters into the
metro area experienced
some delays of up to 30
minutes compared to
usual travel time
Delays with parking as
well, plus the increase in
payment for a ramp
space or at a meterWhere was the congestion?
Knowing a strike was imminent, affected
citizens and communities mobilized
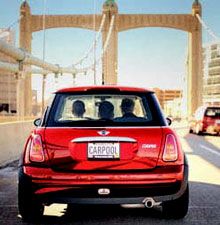
Deeply discounted parking rates in city-owned
ramps for carpoolers.
Carpools, shuttles, schedule shifts
Some people made fewer trips
Transit
dependent workers traveled less
Fewer peak-period trips to avoid congestionWhere was the congestion? Cont.
Many Bus systems were still operational
Opt Out providers (MVTA, SW Metro, etc.)
were still in business, except for MetroTransit-
operated routes (These routes use freeways).
Congestion predictions misinformed
“75,000 riders”, “40% of downtown workers”
Downtown Minneapolis drive/ride mode split
calculations can be confusing…Downtown Mode Split
Calculated in different ways, all depend on:
Methodology (question asked, sample size)
Geographical area in question (CBD vs. entire
“downtown”- Loring Park to Riverfront)
Time of day: peak period, “peak hour”, all day, 24-
hour, inbound versus outbound.
Type of trip: work, shopping, short-term, long-term.
Mode of transit: LRT vs. bus trips (a new issue)A few examples of mode splits
United States Census: 25.0%
How do you get to work? For all downtown Mpls
workers (136,000), 34,000 said “transit”.
Measured all downtown, 24 hrs, work trips
Cordon Count: 34% (Mpls Plan)
Survey teams at 100+ entrance points counting
people entering downtown
Measured peak period, all downtown, all trips
Employer Survey- 24-58%
(source: SRF Consulting, 2000 Downtown Transportation Study)
Surveyresponses at dozens of major employers in
downtown area, 1990 & ‘98-99
Looks at short term vs. long term trips, all day, by downtown
areaTravel Behavior Inventory Sample of 5% of households in Metropolitan area, asked question “how do you get to/from work?” For downtown Mpls (split into 3 areas), work trips, 24 hours (split into AM/PM peak, off peak, peak hours) Results affected by small sample size for some areas.
Results from TBI
“Inbound”
        AM         AM       PM     PM     Off    Entire
transit peak       peak     peak   peak peak     day
users hour         period   hour   period
Core 55.8          52.2     68.2   17.0 29.7     39.6
Outer 29.2         31.6     39.1   28.3   19.1   24.8
core
Frame 26.3         20.2     8.5    13.8   6.8    10.8
All         43.4   40.6     31.0   19.7   18.8   26.8
Conclusions about mode split
Mode split depends on question asked
For total “displaced” workers, rely on census data
Popular Misconception: 55,000 workers take the bus to
downtown Minneapolis for work every day during rush hour.
In reality, 34,000 ride in ALL DAY
For Peak Period congestion forecasting, much trickier
Depends on time, direction, CBD area, trip type, destination
All of these factors affect congestion
What about downtown St. Paul?
Small mode split (12.5% in census) and fewer jobs (Since the Strike… recovery
Post-strike ridership was initially quite low
May ’04 rides 16% below May ’03, despite
comparable February months in each year
Opt-out operated routes fared worse: 45% lower in
May ’04 vs. May ’03
Recovery occurred quickly
Reg. Route MT ridership only down 8% in July ’04 vs.
July ’03, without accounting for LRT
Difficult to gauge recovery in exact terms
LRT opened June 26
Many “opt-out” routes contracted to MetroTransit
reverted back to private operators
Annual variation/long term will tell real storyTotal MT-Operated Regular Route Rides, Jan-Aug 2003 & 2004
7000000
6000000
5000000
4000000
Rides
3000000
2000000
1000000
0
January February March April May June July August
MonthQuestions Which side won in the transit strike? Which side(s) lost in the strike? Is the transit system important for the reduction of congestion? For “the poor”? What alternatives exist to transit? Are any feasible? Did the Met council aim to “bust the union”, as many strikers charged?
You can also read