Big Data: che si può fare? - 2018 05 07 Prof. Francesco Sacco - Impara Digitale
←
→
Page content transcription
If your browser does not render page correctly, please read the page content below

Prof. Francesco Sacco

Università dell’Insubria e SDA Bocconi

Big Data:
che si può fare?

2018 05 07
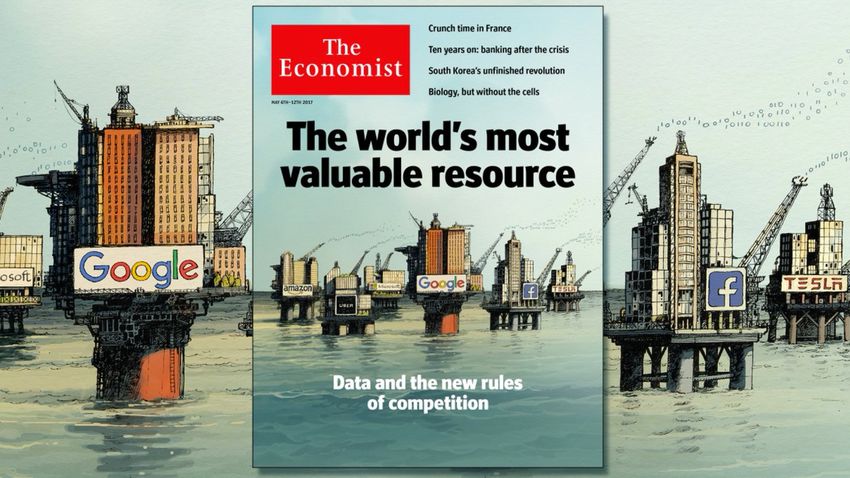
Big data…
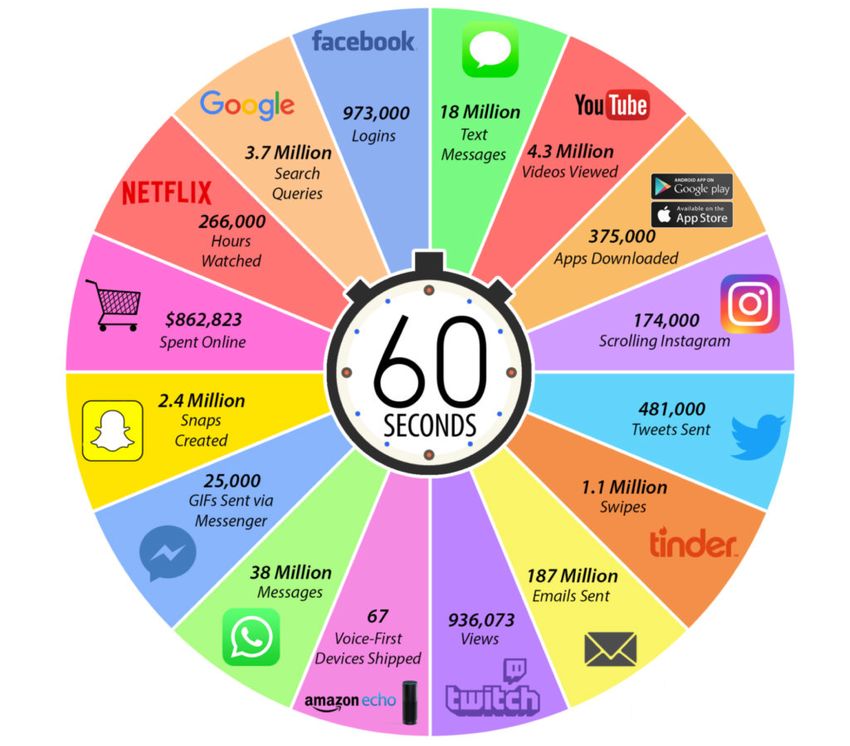
Un minuto di Internet nel 2018
3
Cosa si può fare…

1

1
1
2
2
2
2
3
4   Entrare sul mercato californiano?

          www.voicesfromtheblogs.com | we look into the data, not at the data
5
Il Giappone e l’olio di oliva
www.voicesfromtheblogs.com | we look into the data, not at the data6 Travel Volumes, Fares
and the Economy
BUSINESS TRAVEL
SURVEY 2017
MARZO 2017 - RELEASE DIGITALE
2015: …
… … …
UVET AMERICAN EXPRESS
I DATI PIÙ SIGNIFICATIVI DEL PRIMO SEMESTRE 2014
UVET TRAVEL INDEX TREND DI SPESA BIGLIETTERIA AEREA HOTELLERIE RAIL
… … … … ….
ANDAMENTO DEL NUMERO DI TRASFERTE E DELLE SPESE DI VIAGGIO
Numero indice base 1° Semestre 2013
120 115
100
99 108
100 100 105
88
93
80 87
1° Sem. 2014 2° Sem. 2014 1° Sem. 2015 2° Sem. 2015 1° Sem. 2016
BUSINESS TRAVEL SURVEY di Uvet American Express
SOMMARIO
BUSINESS TRAVEL SURVEY 2017 MARZO 2017- RELEASE DIGITALE
Using Big Data to inform the industry of Business TravelTravel from Italy only: does Economic
6 growth drive Business Travel?
Destination Lag (number of quarters)
Spear
man
Correlat
ion
United States 3 0.93**
Japan 1 0.92**
Poland 2 0.92**
Chile 1 0.85**
Netherlands 1 0.72**
Israel 3 0.71**
Correlation between GDP and volume of flights
Portugal 2
**: statistical significance at 95%; *: statistical significance at 90%
0.71**
Germany 3 0.67**
Denmark 1 0.63**
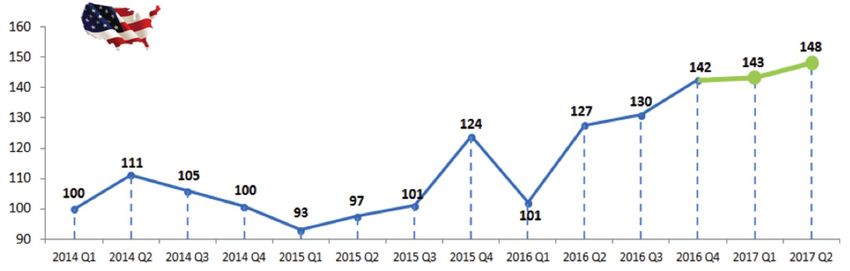
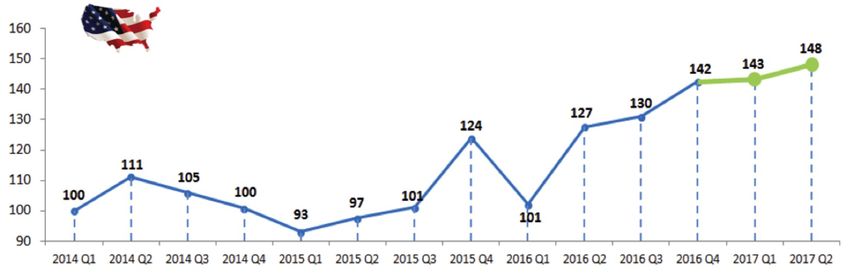
Data Source:6 The prediction for 2016 Q4: USA
● Quarterly real volume
● Prediction for 2016 Q4 with macroeconomic variables (GDP, etc)
● Prediction for 2016 Q4 without macroeconomic variables
Base 2014 Q1 = 100, data Source:The prediction for 2017 Q1 & Q2 (as of
6 December 2016)
●Quarterly real volume
●Prediction for 2017 Q1 & Q2 with macroeconomic variables
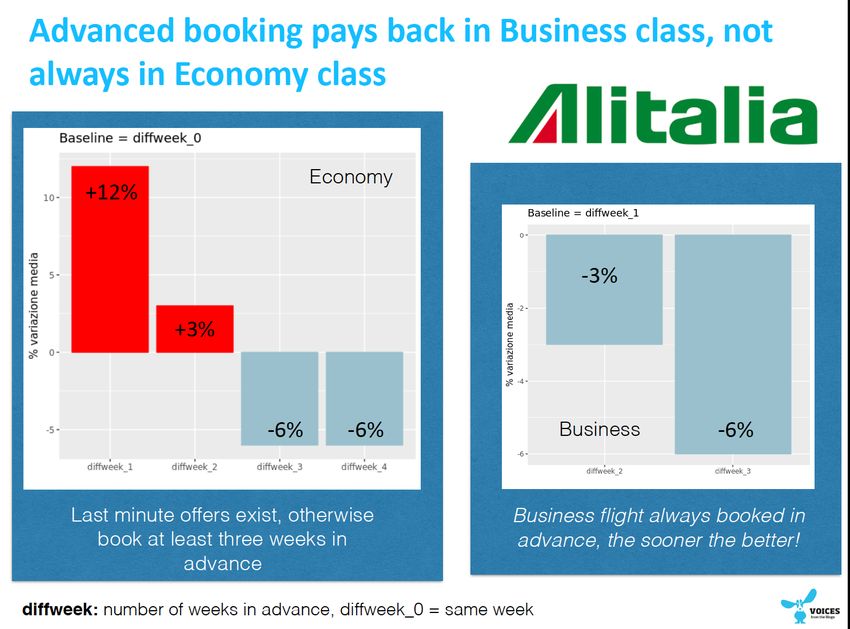
Base 2014 Q1 = 100, data Source:Patterns in Air Fares? An example:
6
Milan to New York
baseline = Q1
54%
Average % Variation
30%
15% 17%
8% 9%
peak season peak season
Q2 Q3 Q4
Economy Business
baseline = Q1
Average % Variation
peak season
39%
24%
17%
11% 9% 7%
peak season peak season
Q2 Q3 Q4Patterns in Air Fares in Asia? An example:
6 Milan to Shanghai
baseline = Q1
8%
5%
Average % Variation
3%
0% peak season peak season
-9%
-11%
Q2 Q3 Q4
Economy Business
Lowest fare = Q4, no longer Q1
Business class behaviour also changes6
6
6   Mix all information
                                   Air Fare Pattern
    GDP - Flight Prediction

                              +
            Competitors Analysis
                                       Pre buy seats

    +                              =    & Resell for
                                       better service
                                         (or profit)
7 Nowcasting the economic cycle
7                   Nowcasting the economic cycle
                                                 Lavoro
                                                                   De
                                                                        sk
                                                                             t op                               Correlation
                                y
                           ac
                    P   riv

                                                                                            WN
      mia

                                                                                             I
    Ec ono

                                                                                                o
                                                                                             lo g ic
                                                                                            Ec o
         Wi
             r ed

                                                                                                       Data Source
                                                                                       re
                                                                                                       ◉   WNI (Voices)
                                    I br                                       So
                                                                                  la
                                                                                                       ◉   Wired =“web visits” (wired.it)
                                           ide
                                                                                                       ◉   ibride (Unrae)
                                                          Futuro                                       ◉   other = GoogleTrends
8 Make profit out of nowcasting
Example: looking at trend switching of
WNI, speculate on the market.Make profits on machine learning
Algo Finance Sagl
911
Cos’altro si può fare…
Wireframe of future VOICES ANALYTICS® (Prototype version, may change)
VOICES ANALYTICS® PRODUCTS
It reports the s e ntiment
and describes the m ain
opinions around a
brand/product/topic.
It also provides the
reasons for expressing a
positive or negative
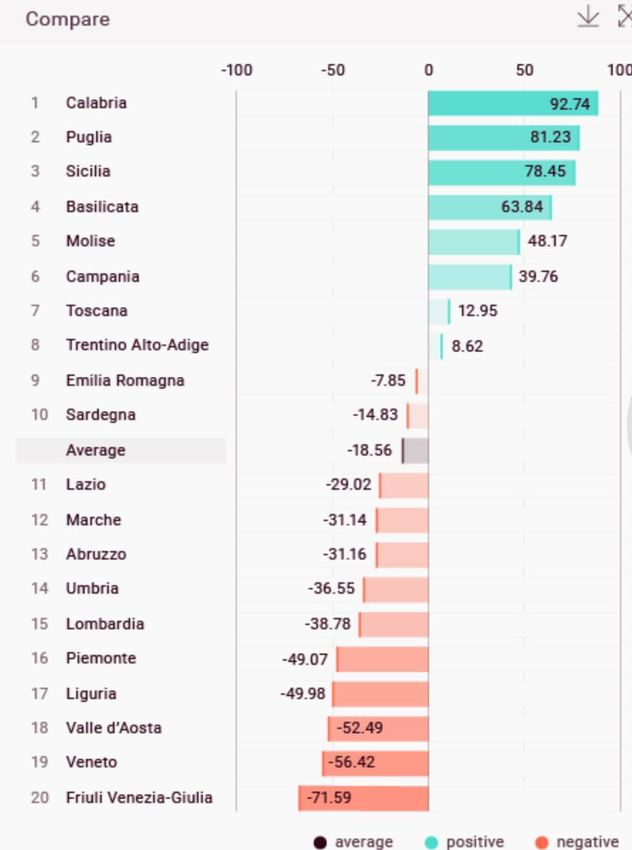
sentiment.VOICES ANALYTICS® PRODUCTS
It performs a
comparison across the
brands active in a
peculiar market,
showing the net rate
between promoters and
detractors.
This give s an ide a about
of the online “word of
mouth” around each
brand.VOICES ANALYTICS® PRODUCTS
It investigates the words
and the concepts
associated to a
product/market/topic
and allows to identify
unsatisfied n e e d s of the
consumers or n e w trends
in consumption and
opinions combining
sentiment with topic
discovery models.VOICES ANALYTICS® PRODUCTS It applies social network analysis to identify the influencers and the “hub” active on conversations around a brand/topic. This allows to s e lect users that mus t b e engaged for marketing activities and to spread communication.
VOICES ANALYTICS® PRODUCTS

This promptly builds indexes
  of mood/views/attitudes
showing the variation across
       tim e and space.

 It can b e used for content
 generation purposes or as
  fire-alarm. The index can
 integrate sen timent with
    other sources of data.
VOICES ANALYTICS® PRODUCTS
It combines sentiment analysis
with other sou rces of data (e.g.
google query, websites visits,
daily revenues or other own
data).
It performs time series analysis
to identify breakpoints, trends,
predict out c o me s and evaluate
which time series can anticipate
an increase/decrease in the level
of another o n e in order to take
action.VOICES ANALYTICS® PRODUCTS
It m o nitors the
effective n e s s of
advertising/communication
campaigns by combining
reputation analysis with
predictive analytics.
This allows to take action
adjusting the frame of the
campaign and evaluating
its effects going beyond the
number of “like s ”.ANALISI GRANDI EVENTI
ANALISI GRANDI EVENTI
ANALISI GRANDI EVENTI
Cos’altro si può fare con altre tecnologie…
Linked data…
Linked data…
Intelligenza artificiale…

                            44
Intelligenza artificiale…
45Grazie per l’attenzione!
francesco.sacco@unibocconi.itYou can also read