2018 Integrated Resource Plan - Integrated Resource Plan 2018 to 2022 City of Fremont, Nebraska
←
→
Page content transcription
If your browser does not render page correctly, please read the page content below

Integrated Resource Plan
                           2018 to 2022
                    City of Fremont, Nebraska

2018 Integrated Resource Plan                   Page 1
Section
           1                                     Introduction
           2                               Public Works Oversight
           3                                Community Outreach
           4                                        History
           5                          Community and Customer Profiles
           6                            Electrical Distribution System
           7                                    Environmental
           8                                    Existing Supply
           9                    Fremont Electrical Load and Forecasted Growth
          10                     Conservation and Demand Side Management
          11                                    Excess Energy
          12                                       Summary

2018 Integrated Resource Plan                                             Page 2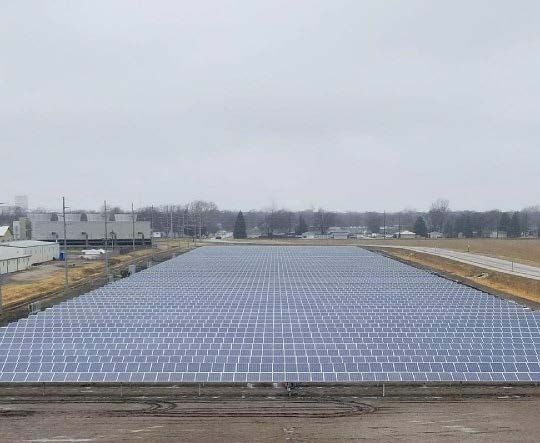
Disclosure
This document contains estimates and forward looking trends and events, it is important to note that
future events will affect this document and possibly alter the results of this document.

Acknowledgement
Electric production resource planning at the City of Fremont is an ongoing process. This integrated
resource plan (IRP) is designed to evaluate the City’s electric production resources and the City’s
electrical needs in the present as well as in the future.

2018 Integrated Resource Plan                                                                     Page 3
1: Introduction
The City of Fremont (COF) owns its municipal electric system for the benefits of its ratepayers. The
Utilities and Infrastructure Board (UIB) has oversight over the electric system and makes
recommendations to the COF City Council whom has the ultimate decision making authority.
The COF electric production is part of a rapidly changing electric production environment. The electric
industry is constantly changing; there are technological advancements, regulatory changes and
customer preferences. COF understands it has to embrace and manage the changing environment, but
still hold true to the mission of providing rate payers the safest, most reliable and cost effective energy
possible.
COF has made a dramatic shift in its generating assets from primarily fossil fuel by adding renewables
such as wind and solar. The COF is participating in a long-term purchase power agreement with NextEra
Energy in the Cottonwood Wind Project, LLC for 41 MW’s of wind energy. The COF also recently installed
a community solar farm located in the COF that has an output of approximately 1.5 MW’s and is in the
construction phases of building a second community solar farm totaling 1 MW. When it is finished, the
total community solar output will be approximately 2.5 MW’s of electric power.

                                     2: Public Works Oversight
The Utilities and Infrastructure Board
The Utilities and Infrastructure Board (UIB) consists of five (5) citizens appointed by the Mayor and
approved by the City Council, to serve as oversight of public works activities. Each member serves a five-
year term. The UIB makes recommendations to the COF City Council concerning public works activities.
The UIB meets the second and last Tuesday of every month at 4:00 PM in the Municipal Building at 400
E. Military Fremont, NE. These meetings are open to the public and the public is encouraged to attend.
The meetings generally consist of financial, project, and department updates.
The City of Fremont City Council
The COF’s governance structure consists of an elected Mayor and eight (8) elected City Council
members. There are two councilmembers from each of four (4) voting wards, shown below.

2018 Integrated Resource Plan                                                                        Page 4
The City Council meets on the second and last Tuesday of every month at 7:00 PM in the council
chambers at the Fremont Municipal Building 400 E. Military Fremont, NE. The City Council receives
recommendations from the UIB and acts on those recommendations. These meetings are open to the
public and the public is encouraged to attend.
3: Community Outreach
It is a priority of the COF to notify and engage the public regarding City projects. The COF uses several
different methods of communication to provide ratepayers and the public with information on a variety
of topics.
The COF publishes a newsletter that is included in the monthly billing statements that updates
ratepayers about City activities, safety topics and other related topics. A monthly electronic newsletter
is also published and sent to customers that have provided the utilities with their e-mail address. This
newsletter includes items such as updates for the community solar projects, links to engineering
assistance, and natural gas safety.
In addition to the newsletter, the COF utilizes social media as a means to notify customers of upcoming
events and programs along with outage and storm damage updates. For further information, visit the
COF Facebook page. https://www.facebook.com/City-of-Fremont-NE-273002179432953/
The COF provides a link on its web site (www.fremontne.gov) to information about safety and energy
related topics. COF meets with community civic groups, public forums and educational institutions to
engage the public and inform them of upcoming COF projects and activities. These events have been
very helpful with the implementation of the community solar projects.
2018 Integrated Resource Plan Page 5Annually, the COF has a booth at the Fremont Home Show. The booth is staffed with City employees
that are available to discuss various topics concerning City functions. In addition to the booth, COF
management participates in town hall type meeting with topics ranging from long term planning to
community solar and wind projects, these meetings are open to the public and the public is encouraged
to attend. COF staff also participates in a weekly radio session that provides information on various City
topics.
COF staff participates in the “Ecology Fair” sponsored by Keep Fremont Beautiful each year for middle
school children. COF staff also participate with local elementary schools and provides an educational
tool called the “Energy Detective” for elementary educators to utilize. Both teachers and parents have
been very supportive of this program.
The COF offers many opportunities for internships, school to career, and tours for students interested in
the energy sector or to further their education. The COF annually provides tours of its facilities to
students from the local high school and university. The COF staff also participate in mock interviews
with the high school and local community college students.
In addition to the City Council meetings and the Utility and Infrastructure Board meetings, the City held
a public meeting to discuss the Integrated Resource Plan and took public comments prior to official
acceptance by the City Council.
4: History:
The COF electric system has been in operation since 1885, when the first “Light Plant” came online. The
original light plant provided the streetlights from dusk to approximately 11:00 PM. The first power plant
was located at 8th and Park St. (Downtown) Fremont. The plant began 24-hour electric service in 1907.
The plant underwent many improvements resulting in five (5) steam driven turbine-generating units.
The plant continued to operate until 1976, when it was officially decommissioned.
LDW Unit 6, located at Lon D. Wright Power Plant (LDW), started construction in 1955 with commercial
operation beginning in January 1958. Shortly after LDW Unit 6 construction and commissioning was
completed, construction on LDW Unit 7, adjoining the existing LDW Unit 6, came on line in 1962. During
this period, the downtown plant and the LDW units served City customers.
In 1970 – 1971, the COF authorized the purchase and installation of LDW Unit 8, a 91.5 MW steam
turbine generator and associated boiler and balance of plant equipment. LDW Unit 8 completed
successful commissioning and established a commercial operation date in December 1976. Once LDW
Unit 8 came online, the downtown plant was shut down and eventually all equipment was removed. The
COF sold the downtown facility, and a developer repurposed the building as an apartment complex.
In 2003, the Derril G. Marshall Generating Station (a simple-cycle gas combustion turbine) went into
service. The primary purpose of this plant to provide electric energy during peak period and to maintain
electric reliability when LDW units are offline.
2018 Integrated Resource Plan Page 6In 2017, the COF entered into a purchase power agreement for approximately 41 MW of wind energy
from the NextEra Cottonwood Wind Project, LLC., near Blue Hill Nebraska.
In 2018, the COF built two community solar farms in the City. Ratepayers can subscribe to solar energy
either by buying panels or by buying solar energy shares.
5: Community and Customer Profiles
The COF is located in the Platte River Valley in Dodge County in eastern Nebraska. Fremont is a first class
City as defined by the State of Nebraska. The COF serves a diverse customer base comprised of
residential, commercial, and industrial electrical loads.
Climate 2017 Data
Table 5-1
Average Daily Temperature Average Low Average High Deg. F Average Precipitation Average Snowfall
Deg. F Inch Inch
January 13 33 .17 6
February 17 38 .83 7
March 27 50 1.93 6
April 38 63 2.91 2
May 50 74 4.21 0
June 60 83 4.72 0
July 65 87 3.62 0
August 62 85 3.43 0
September 52 77 3.15 0
October 40 65 2.13 1
November 28 49 1.38 3
December 16 34 1.02 7
Historic Growth – Table 5-2, below shows the population for Fremont and Dodge County from 1870 to
2016 (est.) based on U.S. Bureau of Census data.
Table 5-2
2018 Integrated Resource Plan Page 7Year City of Fremont Dodge County
1870 1195 4212
1880 3013 11263
1890 6747 19260
1900 7241 22298
1910 8718 22145
1920 9592 23197
1930 11407 25273
1940 11862 23799
1950 14762 26265
1960 19698 32471
1970 22962 34782
1980 23979 35847
1990 23680 34500
2000 25174 36160
2010 26397 36691
2016 (est.) 26519 36757
Projected Population – The 2012 Comprehensive Plan for the COF projected the following population
data for the COF in 2020 and 2030 (see Table 5-3). The population in 2040 was estimated using the data
from the 2012 Comprehensive Plan.
Table 5-3
Year City of Fremont
2020 27,466
2030 29,794
2040 (estimated) 32,319
Fremont Demographics
The COF currently occupies approximately 8.80 square miles and according to the 2010 U.S. Census
data, there are approximately 11,675 households in the City. Housing characteristics are: owner
occupied - approximately 7,147 units and renter occupied - approximately 4,528 units 1. Home
ownership represents 61.2% of all residential property.
The COF electric service area includes the COF and the surrounding area. A map of the service area is
attached in the appendix of this document.
City Electric Customer Profile: Residential Customers: 12,457, Commercial Customers: 2,311, and
Industrial Customers: 497
1
Housing statistics derived from 2017 Dodge County housing study at www.dodgecountyhousingstudy.com.
2018 Integrated Resource Plan Page 8Customer Profiles
Residential Commercial Industrial
3%
15%
82%
6: City of Fremont Distribution System
COF operates its distribution system in a manner to provide the most dependable and lowest cost
electricity to the customer. Distribution circuits are periodically evaluated to determine load levels and
areas where circuits need to be upgraded and/or added to provide for more flexibility in shifting loads
and for future growth.
The COF evaluates transformers to ensure they are not overloaded and operating as efficiently as
possible. New transformers are evaluated when purchased for not only cost, but also for losses over the
expected life of the transformer.
The COF has replaced essentially all electro-mechanical relays with newer microprocessor-based
relaying on both the 13.8 kV and 69 kV systems. The new equipment has resulted in fewer widespread
outages and better system reliability. The COF periodically reviews fuse coordination on the system to
minimize customer outages, and reviews outage records to identify potential weaknesses in the
distribution system and determine placement of additional fusing.
The COF has recently completed a power factor study on the distribution system, which resulted in a
plan to install additional capacitors on various distribution circuits. The addition of these capacitor
banks will optimize the power efficiency of the distribution system.
In addition, COF currently offers an incentive to encourage industrial users to improve their power
factor. In 2017, a large industrial customer installed 4,350 kVAR of capacitors as part of an electric
system improvement to their plant, which improved their peak month power factor from 83% to 96% or
greater. This resulted in reduced kVAR demand, which can now be used to serve other loads.
The COF has recently completed three (3) long-term projects to improve the safety and reliability of the
system. Replacement of old and obsolete oil filled 69 kV substation breakers with new sulfur
hexafluoride (SF6) gas breakers, replacement of old and obsolete 13.8 kV substation breakers with new
outdoor vacuum breakers, and upgrade substations to current code requirements.
A pilot project was completed to investigate the cost/benefits and energy efficiencies of changing the
existing streetlights to light-emitting diode (LED) streetlights. The pilot project results showed a
reduction in the cost and increased energy efficiencies. Therefore, going forward, the COF will be
2018 Integrated Resource Plan Page 9installing LED street lights on all new installations, and replacing existing high-pressure sodium, mercury vapor, and metal halide fixtures as they fail with LED streetlights. Although the changeover will take several years to complete, analysis has shown that switching to LED streetlights will result in a streetlight demand reduction of approximately 372 kW and an energy consumption reduction of approximately 1,600,000 kilowatt-hours annually. The COF is currently building two new distribution circuits (approximately 3.5 miles) to serve a new large industrial customer. The new electrical load is estimated to be 12-14 MW, and is scheduled to come online in mid-2019. Weather can have an impact on the distribution system. In June of 2017, a thunderstorm moved through the COF service area with 115 mile-per-hour straight-line winds. The storm resulted in widespread damage to the distribution system, with outages to approximately 4,560 customers. COF crews, along with one neighboring mutual aid crew, restored service within two days to all customers who did not sustain damage to their electrical system and were able to utilize the power. The storm also destroyed 1.2 miles of 69kV transmission line, which was rebuilt and back in service in the spring of 2018. To further improve the COF distribution system, the COF issued a request for proposal for a Supervisory Control and Data Acquisition (SCADA) Control System to upgrade/replace the existing SCADA systems for all four City utilities (water, natural gas, electric and wastewater). This will result in a common master SCADA platform for all four (4) utilities. The project also includes replacement/upgrading of entire control systems including programmable logic controllers (PLC’s), remote terminal units (RTU’s), human machine interface’s (HMI’s), radios, network servers, etc. Monitoring of 18 lift stations and 40 gas pressure regulator/gas metering stations will be added to the upgraded system. The project is expected to result in increased reliability, enhanced monitoring and control capability, and reduced operation and maintenance costs for the City. In addition to the SCADA upgrade, the City has contracted with a local communications contractor to install a substantial expansion of the City’s fiber optic communication network. The expansion in an approximate 18-mile fiber optic ring that includes COF electric substations, distribution warehouse, power plants, water treatment plant, and waste water treatment plant. The fiber optic network ring will be used for high-speed SCADA network communication, control, and direct transfer trip relay communications. The fiber network, along with the SCADA upgrade, will provide increased reliability, security and accommodate additional future functionality, such as outage management systems, distribution management system, and advanced metering infrastructure applications. Due to capacity constraints on the two existing 69kV transmission ties with Omaha Public Power District (OPPD), the COF has contracted with OPPD to build a new 161kV/69kV transmission tie line into the COF. The line is scheduled to be completed by January 2019. In preparation for the new line, the COF has contracted for the design and construction of a major upgrade to Substation B. The upgrade will include a new control building housing all-new relaying and control panels. The new transmission tie will 2018 Integrated Resource Plan Page 10
have 1200-amp capacity and provide the COF with the ability to utilize additional outside “grid”
resources.
In 2016, COF began using the American Public Power Association (APPA) eReliability Tracker software to
track customer outages. The software allows the COF to calculate reliability indices for the distribution
system and provides top-level reliability-related benchmarking information. In March of 2018, the COF
was recognized by APPA for achieving excellence in reliability for 2017 by significantly outperforming the
electric industry national average as reported by the Energy Information Administration (EIA). In
addition, the COF earned a 2017 Gold Level Designation RP3 award from APPA, recognizing the COF as a
Reliable Power Provider. The award recognizes utilities that demonstrate high marks in reliability,
safety, workforce development, and system improvement.
In February of 2018, the COF commissioned a new 1.5 MW Community Solar Farm. COF’s customers
participating in the community solar project purchase the energy from the solar farm. The solar farm’s
output is connected directly to one of the COF’s 13.8 kV distribution circuits. The Community Solar Farm
was so successful that the COF contracted for a second, 1.0 MW solar farm that is scheduled to be
completed by September of 2018.
In 2018, the COF received a Grant from the Nebraska Environmental Trust to purchase five (5) electric
vehicles and install two (2) electric charging stations. The dual 240-volt Level 2 chargers were installed
on the distribution system in public locations to encourage use of electric vehicles and provide
convenient locations for electric vehicle (EV) owners to charge their vehicles. The COF will apply for
additional grant funding in future years for additional EV’s and charging stations to promote
environmentally friendly EV usage in the COF. In addition, the COF is considering implementing
additional EV incentives to build off-peak load.
The COF continues to use an infrared camera to monitor hot spots in substations and switchgears,
motors, and electrical equipment. Regular monitoring helps to minimize unplanned outages and
breakdowns. This monitoring also reduces energy losses caused by loose connections and failing
equipment. The camera is shared with other City departments to help improve their operations.
In 2015, the COF purchased a commercial pole testing equipment so that COF personnel could perform
wood pole testing in lieu of hiring a private contractor. From 2015 through 2017, approximately 2,454
poles were tested. The number of failed or “bad” poles is approximately 4 to 5 percent. As bad poles
are found, they are replaced with new poles by COF staff. COF staff estimates that 1,000 poles will be
tested each year. The COF’s goal is to have all wood poles on the system tested on a 10 to 15 year cycle.
COF staff performs annual transmission line inspections, based on the inspection repairs are prioritized
and completed in a timely fashion. Every two years the distribution circuits, both underground and
overhead are inspected and issues are repaired as appropriate. The COF also has its own tree-trimming
crew. The crew trims trees to maintain clearance on the City’s electrical system in a four-year cycle. The
COF has maintained very good reliability numbers by performing these tasks.

2018 Integrated Resource Plan                                                                      Page 11
7: Environmental
One of the biggest challenges in projecting and planning for future power generation is the ever-changing
environmental and regulatory climate. There have been several new environmental regulations that have
affected the LDW Power Plant, including the Mercury Air Toxics Standards Rule, Cross State Air Pollution
Rule and Coal Combustion Residuals Rule.
The sections below discuss several environmental regulations that affect the LDW Power Plant.

Acid Rain Program:
Title IV of the 1990 Amendments to the Clean Air Act required acid rain to be controlled, thus creating
the Acid Rain Program. The Acid Rain Program requires the monitoring, recordkeeping and reporting of
sulfur dioxide (SO2), nitrogen dioxides (NOx), carbon dioxide (CO2), volumetric flow and opacity under 40
CFR part 75. The LDW Unit 8 and Derril G. Marshall Generating Station are subject to the Acid Rain
Program and is allocated allowances annually for each unit from the Environmental Protection Agency
(EPA). The LDW Unit 8 has the ability to operate on coal and natural gas. The unit also utilizes natural
gas or propane for igniters and flame stabilization. The Derril G. Marshall Generating Station is a dual
fuel simple cycle combustion turbine that can operate on natural gas or number two fuel oil. Annual
allowances are maintained in an account and annual SO2 and NOx emissions are subtracted from the
annual allocated allowances. Any remaining unused allowances can be banked and used in future year’s
emissions.
Cross-State Air Pollution Rule (CSAPR):
The Cross-State Air Pollution Rule (CSAPR), also known as the Transport Rule was finalized by the EPA on
July 6, 2011. After court challenges, the rule became effective on January 1, 2015 to reduce SO2 and NOx
emissions by setting an annual limit on tons of pollutant emitted through the use of allowances. The
rule does allow affected sources to determine how they will meet compliance. Affected sources must
have enough allowances in their account at the end of the compliance period to cover the emissions for
that period. Participants in the CSAPR are allowed to buy, sell or bank allowances. The LDW Unit 8 and
the Derril G. Marshall Generating Station are subject to the CSAPR and holds allowances to cover annual
SO2 and NOx emissions.

Mercury and Air Toxics Rule (MATS):
The Mercury and Air Toxics Rule (MATS) final rule became effective on April 16, 2012, and created
technology based standards to limit mercury, acid gases and other pollutants emitted by power plant
electric generating units (EGUs) with a capacity of 25 megawatts or greater. The MATS rule required
sources to comply with the rule no later than April 16, 2015. Sources could apply to their permitting
authority for a 1-year extension allowed under Section 112 of the Clean Air Act. The LDW Unit 8 is
subject to the MATS Rule and installed a Spray Dryer Absorber (SDA) to control acid gases, a fabric filter
baghouse to control particulate matter (PM) and a powder activation carbon (PAC) injection system to
control mercury to comply with the emission standards.

2018 Integrated Resource Plan                                                                     Page 12
National Pollutant Discharge Elimination System (NPDES):
The National Pollutant Discharge Elimination System (NPDES) permit program was created in 1972 by
the Clean Water Act to address water pollution from point sources that discharge to waters of the
United States. The LDW was issued their current NPDES permit from the Nebraska Department of
Environmental (NDEQ) on July 3, 2017. The permit included a compliance schedule to meet the
requirement of zero discharge of bottom ash transport water set forth in the 2015 revision of the Steam
Electric Power Generating (ELG) category of 40 CFR Part 423. Due to pending litigation of the ELG Rule,
the EPA has proposed a reconsideration of the rule that applies to bottom ash transport water at
existing sources.

Coal Combustion Residuals (CCR):
The Coal Combustion Residuals (CCR) Rule was published in the Federal Register on April 17, 2015 and
became effective on October 19, 2015. The CCR rule details requirements for the safe disposal of coal
combustion residuals from coal-fired power plants into landfills and surface impoundments under
Subtitle D of the Resource Conservation and Recovery Act (RCRA). Based on the CCR rule, the LDW
power plant meets the definition as an existing landfill and complies with the rule.

                                   8: Existing Electrical Supply
It is the mission of the COF to provide safe, reliable, economical electricity to their customer owners at
the lowest cost. In order to accomplish this it is imperative that the assets of the utilities be properly
maintained and operated.
The COF serves approximately 15,265 electric customers located in and around the COF. A map of the
COF electric service area is included in the appendix.
The COF operates the electrical system for the ratepayers. The system includes three (3) coal and
natural gas fired boilers supplying steam to three (3) steam turbine generators located at the LDW
Power Plant. One (1) dual fuel combustion turbine located at the DGM Power Plant. One (1) solar farm
(SF1) on the City’s distribution system near the existing power plant. One (1) solar farm (SF2) currently
under construction on the City’s distribution system located at the City’s Well Field. In addition, a
Purchase Power Agreement (PPA) for wind energy with NextEra Energy Cottonwood Wind Project, LLC,
near Blue Hill, Nebraska. A summary of the units below:

                                                 Table 8-1

2018 Integrated Resource Plan                                                                      Page 13
Unit In-Service Nameplate Rating Net Fuel Supply
Year Rating MW MW
LDW Unit 6 1956 16.5 15 Coal / Natural Gas
LDW Unit 7 1962 21 20 Coal / Natural Gas
LDW Unit 8 1976 91.5 82 Coal / Natural Gas
Derril G. Marshall 2003 40 36 Natural Gas / #2 Diesel
Generating Station
Solar Farm 1 (SF1) 2018 1.3 Renewable Solar
Solar Farm 2 (SF2) 2018 1.0 Future (10/1/2018)
Cottonwood Wind 2018 40.89 Renewable Wind (PPA)
Project LLC (Joint)
City of Fremont Resources – Nameplate Ratings
City of Fremont Power Plants: LDW - Derril G. Marshall Generating Station
The LDW Power Plant and the Derril G. Marshall (DGM) Power Plant serve the City’s demand and are
able to produce additional electrical energy to the grid. The primary fuel for the LDW Power Plant is coal
from the Powder River Basin in Wyoming. The coal is low sulfur and approximately 8,800 Btu’s per
pound. Coal is supplied by rail and the COF receives shipments from late March through November. The
COF stockpiles coal to provide adequate fuel supply for the winter months.
The chart below indicates the national average price for coal and natural gas since 2008, plus the
estimated cost of delivery to Fremont. The COF purchases approximately 315,000 tons of coal per year
and approximately 175,000 MMBtus of natural gas. These amounts change based on weather and the
COF’s demand.
2018 Integrated Resource Plan Page 14National Average Fuel Cost*
$35
$30
$25
$20
Gas ($/MMBtu)
$15 Coal ($/Tons)
$10
$5
$0
2018 2009 2010 2011 2012 2013 2014 2015 2016 2017
*Gas cost: Rate includes both commodity and pipeline transportation cost average for that year traded on the NYMEX.
*Coal cost: Rate includes the commodity and rail transportation cost average for that year according to the Argus Coal Weekly
Pricing and Rail rate.
LDW Power Plant has seen many improvements and repairs over the years. Most of the improvements
have been required to meet new state and federal regulatory requirements, while repairs are required
to maintain high reliability standards. The following are some of the plant improvements made.
1978-1979: LDW Unit 6 and LDW Unit 7 were equipped with baghouses and new induced draft fan
(ID Fan) for capture of fly ash.
1979-1980: An ash conveying and storage system was installed for all three (3) LDW units. This
replaced the ash sluicing system.
1995: A continuous emissions monitoring system was installed on LDW Unit 8 as part of the
Clean Air Act to monitor SO2, NOX, CO2, Air Flow and Opacity.
2002 The installation of the reverse osmosis system and the water analysis equipment was
installed to better monitor the boiler water and increase the efficiency of the existing
demineralized water system.
2002 LDW Unit 8 cooling tower replacement.
2000-2003 Honeywell digital controls were installed to replace the original pneumatic controls on
all three (3) LDW units. This installation provided improved boiler and turbine control
and tuning, enhanced data collection and logging, and allowed the utilities to combine
2018 Integrated Resource Plan Page 15multiple control rooms to better staff the facility and increase communication within
operations and maintenance.
2001-2003 LDW Unit 6 and 7 generator excitation systems were obsolete and replaced with new
systems.
2006 LDW Unit 6 and LDW Unit 7 condenser tube replacement. This project was done to
ensure reliability due to unexpected tube leaks and to aid in the efficiency.
2014 LDW Unit 8 electrostatic precipitator was rebuilt due to age and condition of the original
electrostatic precipitator. The electrostatic precipitator’s function is to capture fly ash
from LDW Unit 8.
2014 LDW Unit 8 cooling tower fill was replaced, this allows for increased efficiency and
reliability.
2015 LDW Unit 8 boiler was stiffened to protect the boiler due to the installation of the new
induced draft fan.
2015 An Air Quality Control System (AQCS) was installed on LDW Unit 8. The AQCS consists of
a dry scrubber, carbon injection, baghouse, ash system, and associated equipment.
2015 LDW Unit 8 Generator field rewind.
2015 LDW Unit 8 generator and turbine inspections were conducted based on hours of
operation. The inspections provide an opportunity to inspect, clean and repair all
internal components to allow for safe, reliable and efficient operation of the unit.
2017 LDW Unit 8 excitation system replaced due to the obsolescence of the prior system. The
new system provides for reliable generator control and protection.
Ongoing Units 6, 7 and 8 turbines and generators are inspected on a periodic basis
(approximately 40,000 hours of operation).
Plant staff evaluates methods and practices to increase plant efficiency. When the units are in an
outage, equipment is inspected, cleaned, and calibrated to provide efficient and reliable service. The
LDW Power Plant has established a program to replace the original lighting with energy efficient LED
lighting.
Below is a brief description of each of the energy sources that serve City customers:
LDW Unit 6
The construction of the LDW Power Plant began in 1955 with the construction of LDW Unit 6, a 16.5 MW
General Electric steam turbine powered by a Babcock and Wilcox coal and natural gas fired boiler. LDW
Unit 6 boiler operates at ~ 925° F @ 880 PSI.
LDW Unit 6 is primarily a standby unit operated when LDW Unit 8 is offline or during high demand
seasons. LDW Unit 6 has seen many modifications including the addition of a baghouse and new induced
2018 Integrated Resource Plan Page 16draft fan, removal of original pneumatic controls and replaced with state of the art digital controls. LDW Unit 6 utilizes a non-reheat turbine and once through condenser. LDW Unit 6 Turbine / Generator inspection is performed based on hours of operation. The boiler is inspected twice per year depending on operation of the unit. A boiler life study was conducted and the results of the study determined that the boiler and associated equipment are suitable for service. LDW Unit 7 LDW Unit 7, commissioned in 1962, is a 21 MW General Electric Steam Turbine powered by an Erie City coal and natural gas boiler. LDW Unit 7 boiler operates at ~925° F @ 880 PSI. LDW Unit 7, is primarily a standby unit operated when LDW Unit 8 is offline or during high demand seasons. LDW Unit 7 has seen many modifications including the addition of a baghouse and new induced draft fan, removal of original pneumatic controls and replaced with state of the art digital controls. LDW Unit 7 utilizes a non-reheat turbine and once through condenser. LDW Unit 7 Turbine / Generator inspection is performed based on hours of operation. The boiler is inspected twice per year depending on operation of the unit. A boiler life study was conducted and the results of the study determined that the boiler and associated equipment are suitable for service. LDW Unit 8 LDW Unit 8, commissioned in 1976, is a 91.5 MW General Electric steam turbine generator powered by a Babcock and Wilcox coal and natural gas fired boiler. LDW Unit 8 operates as a load following generator, it is the primary unit utilized to serve the City’s customers. The fuel supply for LDW Unit 8 is primarily low sulfur nominal 8,800 btu Powder River Basin (PRB) coal. LDW Unit 8 also has the ability to burn natural gas, however seasonal gas supply to the plant is insufficient to provide the quantity of natural gas to achieve full output. When natural gas is utilized, it is during start-up or co-fired with coal. LDW Unit 8 utilizes natural gas and, in an emergency propane, for start-up fuel and flame stabilization. LDW Unit 8 utilizes a reheat turbine boiler and a cooling tower for condenser cooling. LDW Unit 8 Turbine / Generator inspection is performed based on hours of operation. The boiler is inspected twice per year depending on operation of the unit. Derril G. Marshall Generating Station The Derril G. Marshal Generating Station was installed and commissioned in 2003. The unit is a dual fuel (natural gas / liquid fuel) nominal 40 MW simple cycle General Electric Frame 6B combustion turbine. It is a standby unit used for reliability concerns and during peak demand. The natural gas supply for the unit comes from the City’s natural gas system at 120 PSI to the inlet of a natural gas compressor that raises the pressure to the required 310 PSI. 2018 Integrated Resource Plan Page 17
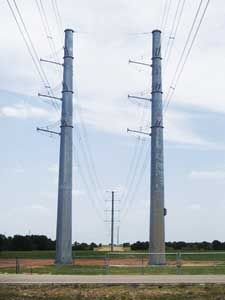
Cottonwood Wind Project, LLC
In 2017, the COF entered into a power purchase agreement with NextEra for the purchase of nominal 41
MW of wind energy from the Cottonwood Wind Project, LLC. This is a joint project with the COF as one
of the participants. The total Cottonwood Wind Project is approximately 89 MW.
On December 1, 2017, NextEra completed commissioning and turned the City’s share of the wind farm
over to the COF. On February 1, 2018, all documentation was completed and the City’s portion of the
wind farm was registered with the Southwest Power Pool (SPP) as a COF generation asset.
COF Community Solar Farm 1 and 2
The COF conducted multiple community outreach meetings to gauge the interest in a community solar
farm. The response was overwhelmingly positive, prompting the COF to solicit proposals for a solar
farm located on an 11-acre site adjacent to the LDW Power Plant. The solar farm was initially going to
be approximately one (1) MW, however due to the large volume of customers wanting to participate,
the solar farm was enlarged to approximately 1.3 MW.
On March 27, 2018, the City Council approved the purchase of Community Solar Farm #2 to be located
at the COF’s Well Field. The proposal for Solar Farm #2 is approximately one (1) MW.
Western Area Power Administration (WAPA)
The COF has a long-term firm energy and capacity agreement with Western Area Power Authority
(WAPA). Table 8-2 below summarizes the energy received from WAPA on an annual basis.
                                               Table 8-2
             Month                          Energy ( MWH)                      Capacity (kW)
             January                             2,443                             4,285
            February                             2,249                             4,345
              March                              2,358                             3,975
               April                             2,138                             4,049
               May                               1,684                             3,931
               June                              1,855                             4,090
               July                              2,184                             4,369
             August                              2,453                             4,792
           September                             1,969                             4,297
             October                             1,746                             3,104
            November                             2,465                             4,433
            December                             2,706                             4,790

2018 Integrated Resource Plan                                                                  Page 18
9: Fremont Electrical Load and Forecasted Growth
The COF electric system presently serves approximately 15,265 customers. The COF has a total net
generation capacity of 153 Megawatts illustrated in Table 9-1 below. The COF receives a maximum of
4.7 Megawatts per hour from the Western Area Power Administration (WAPA).
Table 9-1
Unit Net Winter MW Rating Net Summer MW Rating
(Capacity) (Capacity)
LDW Unit 6 15 MW 15 MW
LDW Unit 7 20 MW 20 MW
LDW Unit 8 82 MW 82 MW
DGM 0 MW 36 MW
WAPA 3 MW 3 MW
Capacity Reserve 13% 16 MW 20 MW
Total Installed Capacity 120 MW 156 MW
Total Installed Capacity – 104 MW 136 MW
Reserve
The COF operates the fleet of electric generating units to provide reliable, safe and cost effective electric
energy to it ratepayers. LDW Unit 8 provides the majority of energy to supply the COF electric demand.
Table 9-2 below illustrates the City’s demand and the energy produced from each resource for calendar
years from 2012 through 2017. During unit outages and when energy prices are low, the COF purchases
energy to serve ratepayers. In Table 9-2, the off system sales are a result of the net effect of purchases
and sales.
Table 9-2
Fremont LDW Unit LDW Unit LDW Unit Derril G. Off System
Year
Demand 8 7 6 Marshal WAPA Sales
2012 442,532.60 353,836.90 54,511.21 44,176.58 1,801.51 26,285.20 38,078.80
2013 437,914.07 341,597.65 80,914.23 59,920.49 7.54 26,218.80 70,744.64
2014 438,011.10 333,782.92 85,250.93 55,452.23 57.78 26,289.50 62,822.26
2015 435,002.80 306,728.04 81,542.68 43,860.50 5,745.58 26,243.90 29,117.90
2016 439,676.51 301,064.91 90,861.97 55,178.61 10,668.62 26,304.00 44,401.60
2017 432,645.96 351,918.53 66,301.22 36,070.77 499.24 26,249.50 48,393.30
2018 Integrated Resource Plan Page 19The charts below illustrate the historical winter and summer peak demand for the COF from 1980 to
2017. The data assumes a 1% growth to the system from 2018 to 2038, based on historic growth of 1%
from 1980 to present. The charts also include the additional industrial load that will be starting in 2019
and completed in 2020. This industrial load is assumed to be two (2) MW in 2019 and twelve (12) MW in
2020. The data for these charts is included in the appendix at the end of this report. As displayed below,
the City’s current resources are sufficient to meet Fremont’s energy demands in both the winter and
summer seasons.
Winter Historic and Projected Capacity
180.00
160.00
140.00
120.00
100.00
80.00
60.00
40.00
20.00
0.00
1980
1983
1986
1989
1992
1995
1998
2001
2004
2007
2010
2013
2016
2019
2022
2025
2028
2031
2034
2037
Net System Demand SPP Reserve Winter Installed Capacity
Summer Historic and Projected Capacity
180.00
160.00
140.00
120.00
100.00
80.00
60.00
40.00
20.00
0.00
1980
1983
1986
1989
1992
1995
1998
2001
2004
2007
2010
2013
2016
2019
2022
2025
2028
2031
2034
2037
Net System Demand SPP Reserve Summer Installed Capacity
2018 Integrated Resource Plan Page 20The charts below illustrate various load growth scenarios for winter and summer peak demands. Chart 1
illustrates the COF’s historic summer peak demand and growth increases of 1%, 1.5%, 2% and 2.5%.
Chart 1
180
160
140
120
1.00%
100
1.50%
80
2.00%
60
2.50%
40
20
0
Chart 2 illustrates the COF’s historic winter peak demand and growth increases of 1%, 1.5%, 2% and
2.5%.
Chart 2
180
160
140
120
100 1.00%
1.50%
80
2.00%
60
2.50%
40
20
0
2018 Integrated Resource Plan Page 21Chart 3 utilizes historic summer demand data, the assumed 1% growth, 12 MW of new industrial load in
2020, and growth increases of 1%, 1.5%, 2% and 2.5%.
Chart 3
180
160
140
120
1.00%
100
1.50%
80
60 2.00%
40 2.50%
20
0
Chart 4 utilizes historic winter demand data, the assumed 1% growth, 12 MW of new industrial load in
2020, and growth increases of 1%, 1.5%, 2% and 2.5%.
Chart 4
180
160
140
120
1.00%
100
1.50%
80
2.00%
60
2.50%
40
20
0
2018 Integrated Resource Plan Page 22Chart 5 shows summer peak demand of 1% growth, 12 MW of new industrial load in 2020, and growth
increases of 1%, 1.5%, 2% and 2.5%.
Chart 5
180
160
140
120
100
80 1.00%
60
40
20
0
Chart 6 shows winter peak demand of 1% growth, 12 MW of new industrial load in 2020, and growth
increases of 1%, 1.5%, 2% and 2.5%.
Chart 6
180
160
140
120
100
80 1.00%
60
40
20
0
1980
1982
1984
1986
1988
1990
1992
1994
1996
1998
2000
2002
2004
2006
2008
2010
2012
2014
2016
2018
2020
2022
2024
2026
2028
2030
2032
2034
2036
2038
2018 Integrated Resource Plan Page 23Chart 7 shows projected summer peak demands with and without the 12 MW of new industrial load in
2020.
Chart 7
180
160
140
120 1.00%
100 1.50%
80 2.00%
60 2.50%
40 1.00%
20
0
1980
1982
1984
1986
1988
1990
1992
1994
1996
1998
2000
2002
2004
2006
2008
2010
2012
2014
2016
2018
2020
2022
2024
2026
2028
2030
2032
2034
2036
2038
Chart 8 shows projected winter peak demands with and without the 12 MW of new industrial load in
2020.
Chart 8
180
160
140
120 1.00%
100 1.50%
80 2.00%
60 2.50%
40 1.00%
20
0
1980
1982
1984
1986
1988
1990
1992
1994
1996
1998
2000
2002
2004
2006
2008
2010
2012
2014
2016
2018
2020
2022
2024
2026
2028
2030
2032
2034
2036
2038
2018 Integrated Resource Plan Page 2410: Conservation and Demand Side Management
Nebraska consistently ranks in the top 10 of the lowest electric energy prices in the United States.
Electric energy prices in the COF are equally low making it difficult to justify a demand side program. The
COF has seen a reduction in electric demand from ten (10) years ago. This reduction has been attributed
to increased efficiencies in residential, commercial and industrial loads. An example is the COF’s efforts
in changing out the streetlights in the City with LED lights to significantly reduce consumption.
The COF will continue to monitor the COF’s demand and the available generation, and if necessary and
economically feasible, the COF may adopt some form of Demand Side Management or energy
conservation program.
The COF is in the process of establishing an electric vehicle incentive program and has been working
with multiple organizations to encourage the purchase of electric vehicles. The COF is also installing
charging stations for public use. The charging stations will collect data to indicate usage patterns that
can be used to promote electric vehicles in the future.
11: Excess Energy
The COF participates in the Southwest Power Pool (SPP) market (map below). The COF schedules
estimated demand and generation resources on a daily basis. As shown on Table 9-2, the COF has
generation available for “off system sales” and makes that energy available into the SPP market when it
makes economic sense.
As COF’s load increases or there are unforeseen regulatory constraints, the amount of energy that the
COF has available to place into the SPP market may be reduced.
The COF monitors pricing and demand to determine which units that are placed into service. There are
periods of the year and or conditions that warrant multiple unit operation due to reliability constraints.
The COF manages the operation and loading of those units to provide a reliable source of energy, while
being cognizant of the pricing per unit.
2018 Integrated Resource Plan Page 2512: Summary:
• The COF will review that electric demand of the City and compare it against the forecasted
demands in this report.
• The COF will monitor the regulatory agencies for impact to the existing fleet of generation
sources.
• The COF will provide outreach to stakeholders in the City. This will provide the COF the
opportunity to gauge the ratepayer’s energy trends. This also provides the COF the opportunity
for ratepayer input on existing and new generation sources.
• As illustrated in this report, the City’s expected growth in demand, including the new industrial
load, should not exceed available generation.
• The COF will monitor customer preferences in electric supply and resource mixes.
2018 Integrated Resource Plan Page 26Appendix City of Fremont service area map COF net summer and winter peak demand historic from 1980 through 2017, and estimated from 2018 to 2038, as indicated by the yellow text. Net Summer System Peak Demand Net Winter System Peak Demand Year Net System Demand Year Net System Demand 1980 72.60 1980 45.90 1981 71.00 1981 47.50 1982 64.70 1982 48.50 1983 66.90 1983 39.90 1984 65.32 1984 45.10 1985 59.48 1985 44.90 1986 65.23 1986 45.38 1987 69.60 1987 42.26 1988 73.45 1988 46.31 2018 Integrated Resource Plan Page 27
1989              69.94        1989   49.03
 1990              72.69        1990   51.08
 1991              71.15        1991   50.44
 1992              61.92        1992   47.77
 1993              72.88        1993   48.53
 1994              73.86        1994   52.98
 1995              84.22        1995   54.17
 1996              85.97        1996   57.00
 1997              83.39        1997   59.54
 1998              87.44        1998   55.90
 1999              91.44        1999   58.30
 2000              84.90        2000   60.57
 2001              87.23        2001   62.58
 2002              85.68        2002   58.77
 2003              89.54        2003   63.15
 2004              89.55        2004   63.78
 2005              91.49        2005   66.82
 2006              96.52        2006   66.72
 2007              90.91        2007   70.30
 2008              87.34        2008   72.28
 2009              86.93        2009   72.12
 2010              92.49        2010   71.00
 2011              94.58        2011   72.26
 2012              96.77        2012   67.90
 2013              90.31        2013   70.66
 2014              89.99        2014   75.71
 2015              88.76        2015   71.96
 2016              93.87        2016   68.11
 2017              94.91        2017   70.08
 2018              95.86        2018   70.46
 2019              98.82        2019   73.16
 2020              109.81       2020   83.90
 2021              110.90       2021   84.73
 2022              112.01       2022   85.58
 2023              113.13       2023   86.44
 2024              114.26       2024   87.30
 2025              115.41       2025   88.17
 2026              116.56       2026   89.06
 2027              117.73       2027   89.95
 2028              118.90       2028   90.85
 2029              120.09       2029   91.76

2018 Integrated Resource Plan                  Page 28
2030              121.29       2030   92.67
 2031              122.51       2031   93.60
 2032              123.73       2032   94.54
 2033              124.97       2033   95.48
 2034              126.22       2034   96.44
 2035              127.48       2035   97.40
 2036              128.76       2036   98.37
 2037              130.04       2037   99.36
 2038              131.34       2038   100.35

2018 Integrated Resource Plan                   Page 29
You can also read


