2018 JCSE-IITPSA ICT Skills Survey
←
→
Page content transcription
If your browser does not render page correctly, please read the page content below
2018 JCSE-IITPSA
 ICT Skills Survey

  Joburg Centre for Software Engineering and IITPSA
  (Institute of Information Technology Professionals
                      South Africa)
Authored by Adrian Schofield, Programme Consultant: IITPSA and Consultant: Applied Research Unit, JCSE

                                       © JCSE and IITPSA 2018

                                        Supported by
CONTENTS

Executive Summary ................................................................................................................................................ 1
    The ICT Sector .................................................................................................................................................... 1
ICT Skills Environment ............................................................................................................................................ 3
    The South African context ................................................................................................................................. 3
    Closing the gap .................................................................................................................................................. 4
Survey Process ........................................................................................................................................................ 5
Corporate Responses.............................................................................................................................................. 6
    Provinces ........................................................................................................................................................... 6
    Respondent Level .............................................................................................................................................. 6
    Type of Enterprise.............................................................................................................................................. 7
    Size of Enterprise ............................................................................................................................................... 7
    Sectors ............................................................................................................................................................. 10
    Sector Skills Plan Correlation ........................................................................................................................... 10
        MICT SETA ................................................................................................................................................... 10
        Other SETAs ................................................................................................................................................ 11
        AgriSETA ...................................................................................................................................................... 11
        BankSETA .................................................................................................................................................... 12
        CATHSSETA.................................................................................................................................................. 14
        CETA ............................................................................................................................................................ 15
        CHIETA ........................................................................................................................................................ 15
        EWSETA ....................................................................................................................................................... 15
        ETDP SETA ................................................................................................................................................... 15
        FASSET......................................................................................................................................................... 16
        FoodBev SETA ............................................................................................................................................. 17
        FP&M SETA ................................................................................................................................................. 17
        HWSETA ...................................................................................................................................................... 18
        INSETA ......................................................................................................................................................... 18
        LGSETA ........................................................................................................................................................ 18
        MERSETA ..................................................................................................................................................... 18
        MQA ............................................................................................................................................................ 19
        PSETA .......................................................................................................................................................... 20
        SASSETA ...................................................................................................................................................... 20
        Services SETA .............................................................................................................................................. 20
        TETA ............................................................................................................................................................ 22
        W&R SETA ................................................................................................................................................... 22
Sector Consolidation ................................................................................................................................... 23
    ICT Priorities..................................................................................................................................................... 24
    Staff Dynamics ................................................................................................................................................. 26
    Corporate Preferences..................................................................................................................................... 27
        Recruitment Value ...................................................................................................................................... 27
        Local Recruitment ....................................................................................................................................... 27
        Training Methodologies .............................................................................................................................. 28
        Management Development ........................................................................................................................ 28
        Skills Needs ................................................................................................................................................. 29
    Impact of Skills Shortage on Business .............................................................................................................. 30
    Corporate Summary ........................................................................................................................................ 30
Practitioner Responses ......................................................................................................................................... 32
    Practitioner Profile........................................................................................................................................... 32
    Practitioner Practices ....................................................................................................................................... 34
    Multi-tasking .................................................................................................................................................... 35
    Skills Acquisition .............................................................................................................................................. 36
Concluding Remarks ............................................................................................................................................. 37
Bibliography.......................................................................................................................................................... 38
EXECUTIVE SUMMARY
The Joburg Centre for Software Engineering (JCSE) is a University of Witwatersrand partnership with government
and industry, founded in 2005. IITPSA (the Institute of Information Technology Professionals South Africa) is the
61-years old professional body for the sector. This is the JCSE’s ninth edition of its survey of skills trends in the
South African information & communications technology (ICT) sector and its first in full partnership with the
IITPSA.

The state of the South African economy continues to restrict growth in the demand for ICT skills as the sector’s
clients limit their budgets. The global market structure is shifting under the influence of the Trump
Administration in the US and the increasing presence of China outside of its own borders. Demand in developed
economies (and in many developing ones) for ICT skills is generally strong. South Africa is lagging its peers in
Africa (notably Kenya, Nigeria, Rwanda and Egypt) who continue to derive the                            benefits
that technology adoption add to economic growth and social development.

Unacceptable delays in implementing policies, such as the migration from                   Stagnant
analogue television signals and the rollout of broadband networks,
continue to frustrate the potential contribution of the ICT sector to the                  economy
overall economy. We are encouraged by President Ramaphosa’s
                                                                                        Policy delays
commitment to speeding up these processes and look forward to seeing
his statements converted into action.                                                 Basic education
We emphasise again our concern at the slow pace of improvement in South
Africa’s basic education for the majority of pupils. Exposure to and familiarity
with ICTs for all learners is essential, in order to equip them to adapt the modern                             tools
to their daily lives. Some laudable initiatives have appeared (such as the use of tablets in Gauteng schools) but
they have yet to reach a sustained, critical mass for all grades of learner. Of over 1 million pupils entering the
schooling system each year, only half will write matric and less than 20% will be able to enrol for tertiary studies.

THE ICT SECTOR
Although it is commonly recognised that ICTs are the tools that enable improved performance in most fields of
human endeavour and that growth in the use of ICTs is critical to building sustainable economies and social
cohesion, we continue to suffer from a lack of current, coordinated data about the so-called ICT sector in South
Africa. “So-called” because it is almost impossible to define where the creation and implementation ends and
the embedded use and further development of ICTs begins.

Too many state entities have disparate views on their roles in regulating, acquiring, implementing, promoting
and utilising the broad range of elements that come under the ICT umbrella. These varied perspectives and
conflicting mandates encourage the waste of resources and dissipation of holistic approaches. The alphabet
soup of entities influencing policy and practice contains too many to mention – DTPS, DOC, DTI, DST, SITA, SETA,
DBE, DHET, iNeSI…

The 2018 National List of Occupations in High Demand contains a broad range of ICT occupations. These are
chief information officer (CIO), ICT project manager, data management manager, application development
manager, information systems manager, IT manager, computer quality assurance specialist and ICT
communications assistant. (One would wonder how the latter occupation appears in the list of much more senior
roles.)

                                                                                         ADRIAN SCHOFIELD        1
2018 JCSE-IITPSA ICT Skills Survey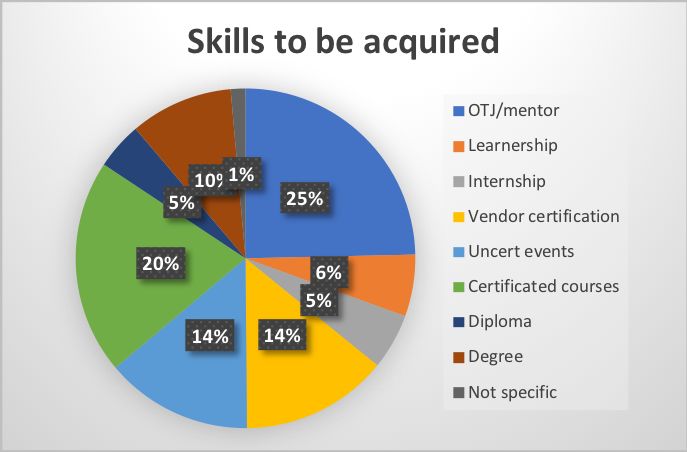
Higher- and high-demand occupations in the ICT sphere include ICT systems analyst, software developer, ICT risk
specialist, programmer analyst, developer programmer, applications programmer,
data quality officer, decision support analyst, computer network technician,
geographic information system specialists and technicians, multimedia
designer and web designer, web developer, database designer and
administrator, computer network and systems engineer, network analyst
and ICT security specialist.                                                         Whose sector is
However, as we will show in our review of the various Sector Skills Plans, it              it anyway?
is very difficult to see how this list was derived and impossible to quantify
the numbers of practitioners required and what the trends are.

This lack of useful data leads to fragmented policy initiatives based on flimsy and
obsolete information, the effectiveness of which cannot be properly measured. The
JCSE and IITPSA urge all the stakeholders to recognise their dependence on ICTs and to integrate their activities,
horizontally and vertically, to create a sound, holistic foundational view of the attributes and dynamics of the
country’s ICT enterprises and practitioners.

These comments sound familiar because they are. South Africa’s leaders must come together to create the
critical mass required to energise the economy through implementation of ICTs and, in particular, domestic
products and services that can leverage the access to global markets.

                                                                                      ADRIAN SCHOFIELD        2
2018 JCSE-IITPSA ICT Skills Survey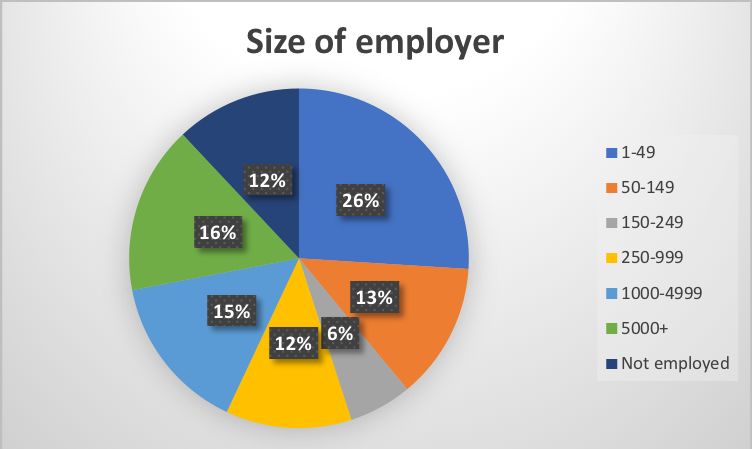
ICT SKILLS ENVIRONMENT
The global ICT industry is now estimated to reach US$5,5 trillion in annual revenues by 2020, according to IDC.
(IDC, 2017) They emphasise that such technologies as Internet of Things (IoT), Robotics and Augmented Reality/
Virtual Reality will drive the next wave of growth – a growth of more than 35% from the estimates for 2018. It is
hardly surprising that the demand for the skills to create, implement and support these technologies remains
high across the world.

The increasing reach of high speed broadband networks supports the growth of ICT related activities in regions
such as Africa, which are proving to be cost-effective locations for the infrastructure required by the explosion
in innovative technologies, such as Artificial Intelligence (AI), Internet of Things (IoT), big data/data analytics,
cloud services and cryptocurrencies. Africa represented only 2% of the global ICT market in 2017 (PRNewswire,
2018), so has enormous potential to harness the economic and social development enablers of ICTs.

In September 2018, the Sydney Morning Herald published an article under the heading, “Three-quarters of new
Aussie Tech jobs to be imported, report shows” (Hastie, 2018), pointing out that 100 000 new ICT roles would
have to be filled by 2023 but that there are only 5 000 domestic graduates per year. The writer goes on to say
that Australia should be targeting 200 000 new ICT roles if they are to meet their ambition to be a global digital
leader.

There is no question that the global ICT industry continues to create high levels of employment for skilled
practitioners. The need to translate masses of data into commercial and social value while protecting the users
and subjects of that data from cybercrime and privacy abuse will grow
exponentially, in tandem with the spread of the networks and data centres
housing the information.
                                                                                        R276 (US$19)
THE SOUTH AFRICAN CONTEXT                                                               billion out of
The South African economy continues to be plagued by political issues
and a high level of corruption that is diverting vital resources away from
                                                                                       US$ 5,5 trillion
building a healthy and growing GDP. The ICT sector is estimated to                          market
contribute more than R250 billion (approximately 6%) to the country’s R4
trillion GDP (MICT SETA, 2017). Good growth in the agriculture sector in Q2
of 2017 reversed the recession of the previous two quarters but this was a “flash
in the pan” and South Africa has again retreated into recession in 2018.

Gartner’s John-David Lovelock forecast that South Africa’s IT spend would reach R276 billion in 2018, up 4,3%
from 2017 (ITWeb, 2018). Within this increase, software is predicted to grow by 12,5%, device spending showing
a minimal growth of 0,9% and a similarly flat communications services market. IT Services (the second largest
sub-sector) will show an 8% increase.

Exacerbating the lack of overall market growth is the continuing restriction of the skills pipeline through poor
performance in the maths and science education in schools. The 2016 South African Science, Technology &
Innovation indicators report, released in September 2017, shows stagnant numbers of matric passes in these
critical subjects and in the numbers of science, engineering and technology (SET) enrolments at tertiary
institutions (National Advisory Council on Innovation, 2017).

We are concerned that prolonged failure to improve the science, technology, engineering and mathematics
(STEM) output from the education pipeline will have a serious negative impact on South Africa’s ability to
counter the growing risk of cybercrime attacks (estimated as costing R1 billion each year), as well as on our
capacity to maintain a competitive and innovative ICT industry.

                                                                                        ADRIAN SCHOFIELD        3
2018 JCSE-IITPSA ICT Skills Survey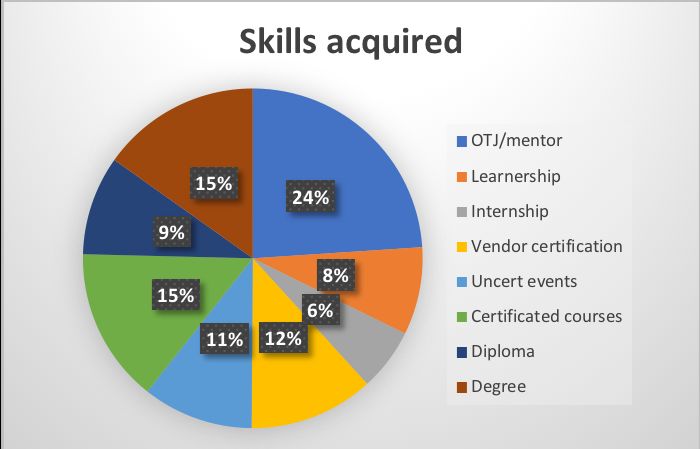
There is a critical need for academia and business to partner in influencing government’s understanding of future
skills, so that all three spheres can invest in the development of people, to ready them for the changed roles
that will come from “Industry 4.0”. President Ramaphosa’s Youth Employment Service (YES) should recognise
such relevant training within its programme.

CLOSING THE GAP
Away from the failure of the education departments, we are pleased to observe many private sector initiatives
to address the skills gap. Although one could argue that this is self-interest, most of the programmes reach
beyond the needs of a vendor to support its products and offer genuine skills upliftment and employment
opportunities.

The JCSE has continued its partnership with BankSETA which has funded 50 students through the Digital Skills
Pipeline Programme, a two-year programme to improve employability of matriculants and graduates by
teaching them scarce IT skills and exposing them to realistic project experience. Their progress is measured by
sitting internationally recognised certification exams, such as CompTIA A+ and relevant Microsoft or Oracle
programming exams. Content for the courses is provided by Cisco and Accenture. The curriculum covers IT
Essentials, programming in C# or Java, configuring networks, designing databases and writing SQL. For the
second year, students are placed in self-funded internships or trainee developer posts.

Another initiative, aimed at boosting recruitment of programming graduates, is WeThinkCode (WTC). This is a
free 2-year course sponsored by corporates such as BBD and requires only aptitude and enthusiasm as the entry
criteria.

Three universities have partnered with Amazon Web Services (AWS) to offer a specialised cloud-computing
focused curriculum. Others may join the programme later.

We were somewhat surprised by the announcement in August 2018 by the Deputy Minister of
Telecommunications and Postal Services that the government has committed to
train a million young people between 2019 and 2030 to become data scientists.
On the face of it, this is a very welcome initiative, but examination of the
numbers causes some doubts about the feasibility of the programme. As
Moira de Roche (a director of IITPSA) commented, “One can’t just churn out
data scientists; instead they need some specialist skills which are only built
                                                                                   1 million data
by experience of about five to eight years.” BCX’s Explore Data Science              scientists
Academy (EDSA), offering students the opportunity to learn how to solve
real-world problems during a one-year engagement, using the latest data
science tools and methodologies has begun this journey but at nowhere near
the scale the Deputy Minister envisages. We tend to agree with the prevailing
opinion that reaching even a tenth of this ambitious goal would be very tough. The
EDSA is offering 300 or 400 internships over 2018/2019.

Hopefully, more realistic results will flow from the launch of Microsoft Azure data centres, intended to add
53 000 new jobs by 2022, with an additional 112 000 generated through other cloud services. The practitioners
to fill those jobs must be appropriately skilled. Microsoft claims its programmes can train school leavers to the
level of software engineer or data scientist.

                                                                                     ADRIAN SCHOFIELD        4
2018 JCSE-IITPSA ICT Skills Survey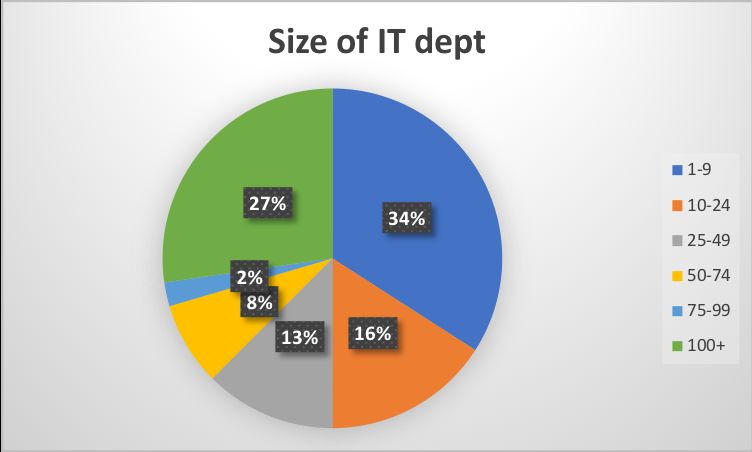
SURVEY PROCESS
The Skills Survey continues to follow the process established in 2008. Its objective is to identify the most pressing
skills needs from the corporate perspective, balanced with the view of current skills capacity of the practitioners
and their intentions for future skills development. The questionnaire, devised by the JCSE, is in a consistent
format to track trends and is published as an on-line survey. In 2018, as for the previous four surveys, we were
assisted in this regard by Eduflex (a Cape Town company), who gave us the use of their Virtual Assessor™ survey
engine and hosted the on-line access. Our thanks go to their team for great support.

We acknowledge the new partnership with the IITPSA (Institute of Information Technology Professionals South
Africa), and the assistance of the Information Technology Association in bringing the survey to the attention of
their members.

The data gathered from the questionnaire is put into context by an environment scan and literature review.

Any use of this Report (in whole or in part) must acknowledge “2018 JCSE-IITPSA ICT Skills Survey” as the source.
Please direct any queries and requests to research@jcse.org.za or ceo@iitpsa.org.za.

                                                                                         ADRIAN SCHOFIELD        5
2018 JCSE-IITPSA ICT Skills Survey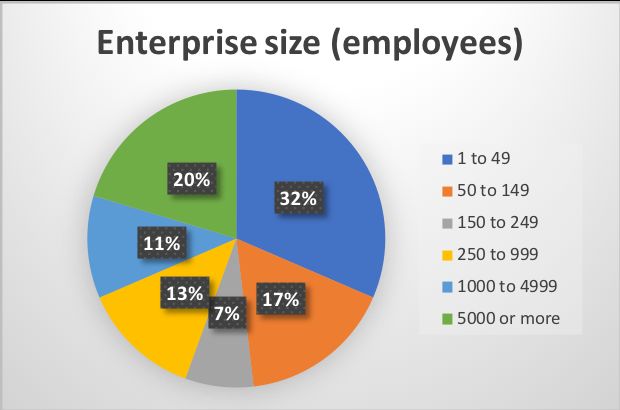
CORPORATE RESPONSES
In this section of the report, we analyse and comment on the responses received from employers, usually from
the executives and managers responsible for ICT creation, implementation and support functions. Corporate
response levels in 2018 are similar to those experienced in the previous surveys.

PROVINCES
                                                                                All nine Provinces were
                      Enterprise Province                                      represented, as they have
                                                                               been in all except our first
                                                              Limpopo          survey in 2008, and 31%
                                                              Mpumulanga       (2017: 35%; 2016: 38%;
                            9% 7%                                              2014: 45%, 2012: 42% , 2011
                                                              Gauteng
                        6%           8%                                        – 34%, 2010: 40%) of the
                                                              North West
                     12%                                                       respondents were located in
                                                              Northern Cape    Gauteng, 15% (2017: 16%;
                                       31%
                                                              Western Cape     2016: 12%; 2014: 23%,
                      15%
                                                              Eastern Cape     2012: 24%, 2011: 27% ,
                            6% 6%
                                                                               2010: 44%) in Western Cape
                                                              Free State
                                                                               and 9% (2017: 9%; 2016:
                                                              KwaZulu Natal
                                                                               14%; 2014: 10%) in KwaZulu
                                                                               Natal. We are encouraged
by the increased interest in the Eastern Cape. This pattern is a reasonable reflection of the geographical
distribution of ICT enterprises in South Africa.

RESPONDENT LEVEL
                                                                                 Slightly lower participation
                    Enterprise respondent                                        at senior level this year,
                                                                                 with 13% being C-level
                                                                                 executives or Directors
                                                                                 (2017: 19%; 2016: 7%;
                                 3%
                                                                                 2014 - 26%; 2012 – 27%;
                                                               Academic
                           11%        8%                                         2011 – 48%; 2010 – 34%;
                                           5%                  C-Level/Owner     2009 – 45%) but the same
                                                               Director          input from Managers at
                                           25%                 Manager           25% (2017:25%; 2016:
                     48%                                       Other
                                                                                 23%; 2014 - 38%; 2012 -
                                                                                 40%; 2011 - 42%; 2010 –
                                                               Not stated
                                                                                 30%; 2009 – 25%). 48% of
                                                                                 respondents’ job titles
                                                                                 were not clearly executive
                                                                                 or management level.

                                                                                  ADRIAN SCHOFIELD       6
2018 JCSE-IITPSA ICT Skills Survey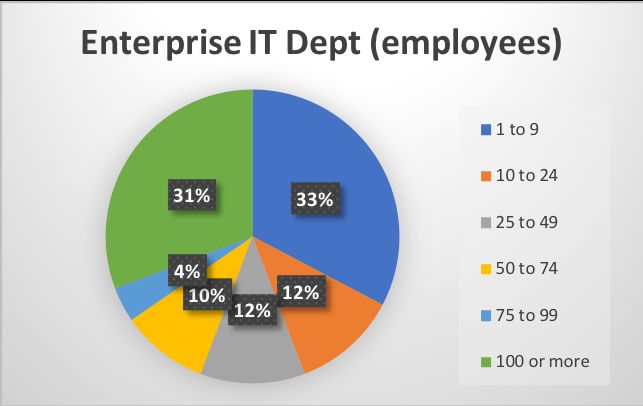
TYPE OF ENTERPRISE
The trend to a lower proportion of South African privately-owned (non-listed) companies in this survey at 31%
continued from last year (2017 39%; 2016:40%; 2014 - 44%; 2012 - 56%; 2011 - 63%) but South African listed

                                     Enterprise ownership
                                                                   Foreign owned listed company

                                                                   South African owned listed company
                               12%     15%
                          3%                                       Foreign owned private company

                     10%
                                                                   South African owned private company
                     0%                      21%
                                                                   State owned enterprise

                           31%          8%                         Academic institution

                                                                   Government department or agency

                                                                   Not-for-profit company

companies were above previous levels at 21% (2017 17%; 2016:9%; 2014 – 18%; 2012 -18%; 2011 - 19%; 2010 -
13%). Altogether, three-quarters of respondents are from private sector enterprises and more than one-fifth of
those enterprises are foreign-owned. No state owned enterprises responded this year, which is disappointing.

SIZE OF ENTERPRISE

32% of the enterprises have less than 50 employees (2017 29%; 2016: 46%; 2014 – 41%; 2012 – 45%; 2011 -
44%; 2010 – 62%; 2009 – 50%; 2008 – 40%) and 37% have between 50 and 250 staff members (2017 13%; 2016:
22%; 2014 – 32%; 2012 – 28%; 2011 - 16%; 2010 – 25%; 2008/9 - 20%).

33% of respondents’ enterprises employ less than 10 people internally to supply ICT functions (2017 26%; 2016:
29%; 2014 – 27%; 2012 – 31%; 2011 - 39%; 2010 – 45%; 2009 – 40%). 31% of this year’s respondents have greater
than 100 practitioners in their IT department (very slightly lower than 2017).

                                                                                    ADRIAN SCHOFIELD      7
2018 JCSE-IITPSA ICT Skills Survey
Regular readers of these Survey reports will know that we endeavour to make comparison with the sector’s
formal data source, so we look to the MICT SETA’s Sector Skills Plan (SSP) for the next 5 years, published in
August 2017 (MICT SETA, 2017). Tables and figures are copied from that Plan. We are concerned about some
discrepancies appearing in the “final” version of the SSP. For example, the Grand total line for the table above
reads 329, 372, 600, 716, 20423 and 25301, in spite of the detail lines being unchanged. We have opted to use
the earlier version of the table from last year. The text of the SSP states that the MICT sector is currently made
up of at most 26,955 companies spread across the five sub-sectors (allocated to the MICT SETA through the
SARS registration process).
We should note that the MICT SETA size breaks are: Small, below 50 employees; Medium, 50-149 employees;
Large 150 or more employees. Of these enterprises, 24,4% (6 602 employers) pay levies to the SETA. 49% of levy
value comes from the IT sub-sector, 13% from Electronics and 14% from Telecommunications.
The MICT SETA acknowledges that there are challenges in extracting employment data beyond that reported in
the Workplace Skills Plans (WSPs) as there are no disaggregated data from StatsSA. The 2017 SSP (op.cit.) reports
an estimated total of 241 535 employees in the levy-paying portion of the MICT sector, a major drop from
297 831 they report for 2016 and 274 095 for 2015 but significantly up from 153 880 in 2014, 162 579 in 2013
and 193 032 in 2012 (181 157 in 2011). The variations in these numbers are considerable and we would like to
see a detailed analysis at the employer level.
We note that the current SSP does not include the historical data on employee numbers, so we have retained
the chart from the 2014 SSP (see below) for comparison purposes.
ADRIAN SCHOFIELD 8
2018 JCSE-IITPSA ICT Skills SurveyNumber of Employees by Sub-sector, 2009 to 2013
2009 2010 2011 2012 2013
100000
90000
80000
70000
60000
50000
40000
30000
20000
10000
0
Film and Electronic Information
Advertising Electronics Telecommunications
Media Technology
2009 11181 12888 26337 76452 52475
2010 11020 10849 28122 77981 52880
2011 9046 12608 27197 79611 53125
2012 12055 12835 26889 86554 54699
2013 7647 13038 20895 66489 46016
Source: The MICT SETA OGS
We note that it can be difficult to measure the effect of interventions concerning employment in the ICT sub-
sectors, given the variations in employment numbers appearing in these reports. For example, we have charted
the employee numbers reported in the MICT SETA SSPs in 2014 and 2017 for the IT and Telecommunications
sub-sectors in the following graph:
The SETA’s frustration is evident in the comment in the current SSP: “Total number of
employees recorded from employer levy records in 2017 is 241,535. The analysis
of WSPs submitted in 2016, there were 297,831 people employed in companies
submitting WSPs, up from 274,095 based on 2015 submissions. The
consistency of employers in submitting annually is important and the lack 600 000 ICT
thereof always leads to anomalies.” (op.cit.)
workers
As we will show later, it is difficult to estimate the number of ICT “people”
in total, so we will continue to adopt the conventional wisdom that there are
as many “ICT” practitioners employed in non-MICT sector companies as there
ADRIAN SCHOFIELD 9
2018 JCSE-IITPSA ICT Skills Surveyare indicated above. This would arrive at an estimated South African ICT practitioner population of around
600 000. However, this will remain in the “guesstimate” category until we can source more reliable and complete
statistics. In May 2018, IDC’s Mark Walker indicated their data shows total IT employment in South Africa as
522 000 people, expected to increase by as many as 119 000 over the next 5 years.
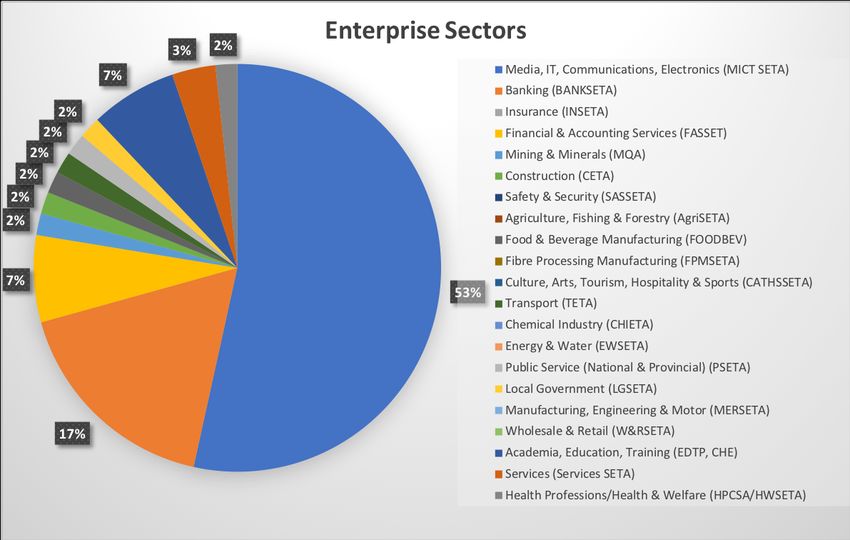
SECTORS
This survey elicited responses from employers in 15 of the sectors represented by SETAs. This is lower than the
18 reporting in 2017 but higher than the 2016 coverage.
Of the responding enterprises, 53% were operating in the MICT (including electronics) sector (2017 40%; 2016:
52%; 2014 - 56%; 2012 – 54%; 2011 – 53%; 2010 - 67%; 2009 – 57%); 7% (2017 10%; 2016: 22%; 2014 - 6%) in
the Education/Training cluster; 17% (2017 7%; 2016: none; 2014 - 5%) in Banking and 7% (2017 9%; 2016: 5%;
2014 - 3%) in Financial and Accounting Services.
Lower than last year, 70% (2017 – 85%; 2014 - 82%) of the responding enterprises have been in business for
more than 5 years and we continue to observe a growing proportion at 12% (2017 9%; 2016: 5%; 2014 - 2%)
existing for less than 2 years.
SECTOR SKILLS PLAN CORRELATION
MICT SETA
The JCSE-IITPSA ICT Skills Survey samples the views of employers and practitioners in the ICT field with the
intention of informing decisions about skills development, particularly but not exclusively in respect of tasks
related to software creation, implementation and support. This work is seen as complementary to the statutory
data presented in the Sector Skills Plan (SSP) (MICT SETA, 2017) produced annually by the Media, Information &
Communications Technologies Sector Education & Training Authority (MICT SETA).
In examining the relationship between the two, it is important to understand the difference between them. The
corporate data gathered by the JCSE-IITPSA is supplied voluntarily by executives and managers in response to
invitations to participate published in the media, direct approaches and through various institutions and
ADRIAN SCHOFIELD 10
2018 JCSE-IITPSA ICT Skills Surveyassociations. The “ICT operations” that they manage will exist within enterprises from all economic sectors, as
well as from those that are seen as ICT companies. However, it is only the latter group that falls within the ambit
of the MICT SETA – its levy payers. The JCSE Survey focuses on ICT practitioners in all sectors, while the MICT
SETA data includes only employees in MICT levy-paying companies.
The different rationales for the two reports (this Survey and the SSP) lead to different views of what should be
the same phenomenon. The levy payers’ reports of hiring reflect the reality of filling vacancies, while the
respondents to the Survey tend to indicate what they want, rather than what they get. The Survey traditionally
reports a much higher demand than the SSP – demand that would be satisfied if supply at the right price was
available and not constrained by external factors. This demand scenario is also reflected in the regular Career
Junction Index (CJI) reports, available online from https://www.careerjunction.co.za/downloadindustrytrends .
The August 2018 edition of the CJI indicates software development and programming remain the most sought-
after skill sets on Career Junction (Career Junction, 2018). According to CJI, in spite of an overall decline in labour
demand, Information Technology remains one of the 5 sectors that show positive employment prospects, with
a demand factor of 29% versus a supply factor of 8% (almost the same ratio as a year ago).
The MICT SETA SSP (op. cit.) gives the following list of top 10 occupations with hard to fill vacancies in the MICT
sector (and the quantity needed).
– Software developer (1131)
– Computer Network and Systems Engineer (352)
– ICT Systems Analyst (316)
– Programmer Analyst (165) Top 10
– ICT Security Specialist (150)
– Business Analyst (126) MICTSETA
– Multimedia Designer (121) occupations
– Advertising Specialist (106)
– Database Designer and Administrator (91)
– Telecommunications Network Engineer (91).
The SSP comments that there is an increased demand for employees to be multi-skilled and that the employment
opportunities tend to be for high-skilled professionals. MICT SETA identifies the change drivers as:
• Digitisation and convergence
• Analytics and Big Data
• Information Security
• Cloud Computing
• Internet of Things
As we shall see from our respondents, in the short time since they compiled their SSP, new drivers have arisen.
OTHER SETAS
As previously, we have reviewed each SETA’s SSP to establish any references to skills relevant to the ICT job
roles. Not all SETAs publish updates to their SSPs with any regularity and several fail to make the latest edition
available through their web sites. This exacerbates the paucity of comprehensive and current data needed by
skills development policy makers and talent managers across the board.
AGRISETA
The 2017-2018 SSP (AgriSETA, 2016) has no specific mention of ICT roles, beyond including Information
Technology in the table of Top Emerging Skills and Future Demand Needs (P.34).
ADRIAN SCHOFIELD 11
2018 JCSE-IITPSA ICT Skills SurveyBANKSETA
Banks are one of the larger employers of ICT skills, outside of the MICT sector. The Banking Sector Skills Plan
2017/18 (BankSETA, 2016) is the same version we reported on in 2017 and includes the following in the
Foreword:
BANKSETA has identified the following five strategic focus priorities to which relevant projects are implemented
and the sector skills needs are appropriately aligned in the SSP:
• Regulatory compliance
• Changing Customer expectations
• Digitisation and technology including Data Management
• Risk Management with a key focus on cyber-security
• Management and Leadership with a key focus on business modelling and managing change
With two of the five priorities focused on technology, it follows that much of the BankSETA SSP will refer to the
skills needed to implement technological innovation. We will not repeat everything we included in our 2017
report. What follows is a reminder of the highlights.
“C HANGE D RIVERS
“The fourth industrial revolution is at the heart of five key drivers of change impacting the banking sector. The
five major change drivers this discussion will focus on are: Digitisation and Technology; Changing Customer
Expectations; Cybercrime and Risk; Disruptors in Banking and Economic and Political Uncertainty.
“DRIVER 1: DIGITISATION AND TECHNOLOGY
“Technological innovation is revolutionising the banking industry. There is no getting away from the fact that
banks are under threat unless they can keep pace with technology. Some of these innovations are great for banks.
Cloud computing, for example, can reduce costs and promote low-cost innovation. But some advances disrupt
banking in a big way, like crypto-currency Bitcoin, which skips banks in the payment process. The four
technological advances that are changing the face of banking, for better or for worse are social media, mobile
banking, cloud technology and crypto-currency.
“DRIVER 2: CHANGING CUSTOMER EXPECTATIONS
With ready access to information, influence of online retail experiences and adoption of new technologies,
customer expectations are rapidly changing. This is driving a shift in the market and forcing organisations to
develop new interaction models that deliver deeper personalised service and improved customer care.
“DRIVER 3: CYBERCRIME AND BROADER FINANCIAL CRIME RISK
“The IT systems of the banks are now the focus of determined criminals who can transfer millions of pounds (or
indeed any currency) within seconds to different accounts and move money across jurisdictions and borders with
a few strokes of a keyboard. With IT systems of the larger banks under scrutiny for failures and inadequate
controls, it is open to question whether the level of security and infrastructure will be sufficiently robust to
withstand the challenge of cyber-crime. To improve cybersecurity, banks will be forced to devote greater
resources to enhance the security, vigilance, and resilience of their cybersecurity model.
“DRIVER 4: DISRUPTORS IN BANKING
“Large retailers are entering the payment and Digital Wallet Market.
“The second disruptors are telecommunication companies.
“The third disruptors are internet giants, like Google, Amazon or PayPal.
ADRIAN SCHOFIELD 12
2018 JCSE-IITPSA ICT Skills Survey“C ONCLUSION
“By 2020, the Fourth Industrial Revolution will have brought us advanced robotics and autonomous transport,
artificial intelligence and machine learning, advanced materials, biotechnology and genomics. These
developments will transform the way we live, and the way we work. Some jobs will disappear, others will grow
and jobs that don’t even exist today will become commonplace. What is certain is that the future workforce will
need to align its skillset to keep pace.”
In the list of top banking sector vacancies that arose 2012-2014, Application Development Manager, ICT Systems
Analyst and Systems Administrator stood out from the banking and general business roles. BankSETA included
a table of IT Skills that are hard to fill, based on a 2015 survey:
It is obvious that the supply of many of these critical skills falls far short of the demand across the economy. The
BankSETA SSP (op.cit.) presents a number of other tables listing the predictions for skills needs over the next 5
years, the skills that are imported and the scarce skills. They note that new technology has brought about an
increased demand for skills in the industry and quote the University of Cape Town Financial Sector Assessment
Report (2014) which stated that in the South African economy there is a massive deficiency of Information
Technology skills. These include hybrid roles such as Business Architects and Business Analysts, and there is also
a growing need for Digital Managers. It has also been reported that the following Information Technology roles
in companies within the financial services sector are in demand:
• JAVA Developers;
• COBOL Developers;
• IT Project Managers;
• SAP Developers;
ADRIAN SCHOFIELD 13
2018 JCSE-IITPSA ICT Skills Survey• Software Developers;
• Systems Analysts;
• Systems Developers;
• Systems Architects;
• Analyst Developers; and
• Information Architects.
The following table is the list of Scarce Skills in the Banking sector, by OFO Code:
They also observe that Data Analytics has been identified as a major future development area for the sector as
companies have large quantities of consumer data where the ability to identify trends and develop innovative
solutions from that data is required. It has been reported that this area has suffered most due to the dearth of
Statisticians in South Africa.
CATHSSETA
There has been no new SSP information since the 2014-2017 update to the SSP (CATHSSETA, 2015) which does
not mention ICT skills, although there is a possible overlap into the roles of TV equipment operators, sound and
light technicians with the Electronic Media & Film sub-sector of the MICT SETA (see graph below).
ADRIAN SCHOFIELD 14
2018 JCSE-IITPSA ICT Skills SurveyCETA
The Construction Sector SSP (CETA, 2017) includes the following reference to technology:
2.2.1 Technological Advances
The world is increasingly moving towards a more digitised world. The advent of technologies such as the internet
of things is changing how society engages with the world. The change in traditional building methods is fast
changing with developments in construction such as “Offsite construction” gaining ground as an alternative
building method that offers the benefits of reduced construction time, less waste and possible cost savings.
Building Information Modelling (BIM) has been a growing trend for years, as it is no longer relegated to just the
largest firms but is seen as providing tangible business benefits such as more consistent, more accurate and less
time consuming project document generation.
Building and Construction Industry (and its professionals) require advanced skills to cope with and optimally
utilise technological advances in the industry, such as off-site prefabrication, laser scanning, 3-D printing, dry
walling and projector plastering. A few recently completed projects in South Africa utilised these technologies
such as the SANRAL building, Diepsloot housing project and the CellC JHB campus at Waterfall Business Estate.
It will require from institutions of learning to be at the forefront of technology and impart such knowledge to
young people studying to enter the construction sector, either as professionals (architects, quantity surveyors,
engineers) or in management (project managers, planners and schedulers, quality assurance specialists).
CHIETA
The Chemical Industries SETA SSP (CHIETA, 2017) contains only one specific mention of ICT skills. They include
Software Developer in their “hard to find” list.
EWSETA
The Energy & Water SETA SSP for 2017-2022 (EWSETA, 2016) has no mention of ICT skills.
ETDP SETA
The ETDP SETA issued a Schooling Sector Skills Plan update (ETDP SETA, 2018). They include Computer
Applications Technology Teacher (Grade 10-12) in the list of top scarce skills.
We also quote the following references to the use of technology in schools and the teaching of STEM subjects:
ADRIAN SCHOFIELD 15
2018 JCSE-IITPSA ICT Skills Survey2.3.5 Technology
Digital Learning is under consideration by the DBE, there are currently 130 000 of the 413 067 teachers trained
in the usage of computers in the basic computer skills and software. However, more than 80% of schools have
the infrastructure to roll out digital learning but most teachers are not equipped to use it, according to a study
commissioned by one of the publishers has found (SAPA: 2014). The usage of technology will contribute in
advancing the interest of learners on the ICT, although electricity is a source of concern in some schools.
www.sapa.co.za: Accessed 13/06/2014.
The Department of Basic Education has made some progress with regards to the use of technology within its
libraries but has fallen short of its targets. The e-Education programme through the Department of Basic
Education Library and Information Systems initiative has been rolled out to various provinces, with varying
degrees of success due to lack of sufficient funding and trained personnel.
2.5.11 Mathematics, Science and Technology Education
Mathematics, Science and Technology has proven to be fundamental in influencing any country’s economy
direction. However, South African research and reports indicates poor learner performance and achievement in
both mathematics and science, an issue that has caused alarm among various key stakeholders in the country.
In 2015 a new Conditional Grant, namely the Mathematics, Science and Technology (MST) Grant, intended to
promote the teaching and learning of Mathematics, Science and Technology in schools was introduced.
According to DBE Minister (Basic Education Budget Vote Speech for the 2016/17 Financial Year) the 2015 MTEF
allocation for the MST Grant stood at a total of R1.1 billion, which increased to R1.156 billion over the 2016 MTEF
period – an increase of 5.1%. The 2016/17 allocation for MST Conditional Grant is R362.444 million; which will
increase to R385.145 million and R407.483 million in 2017/18 and 2018/19 financial years, respectively. The MST
Grant will continue to strengthen the implementation of the National Development Plan and the Action Plan to
2019 by increasing the number of learners taking Mathematics, Science and Technology subjects, improving the
success rate in the subjects, and improving teachers’ capabilities in teaching these three gateway subjects. The
MST Grant will continue to focus on the provision of ICT resources to schools and training of teachers especially
at Senior Phase and Technical Schools during the MTEF periods.
On 6 May 2015 during the DBE Budget vote speech for the 2015/16 financial year, the DBE deputy Minister
acknowledged that much more still needs to be done with regards to improving learner participation and success
rate in the Mathematics, science and technology. Thus, as part of the strategy to increase learner participation
and performance in the MST, the DBE has developed the Mathematics, Science and Technology (MST) Sector
Plan pronouncing national and provincial targets. The targets are deliberately intended to increase the number
of learners taking Mathematics in order to meet the National Development Plan (NDP) targets of increasing the
number of learners eligible for bachelors programme with Mathematics and Science to 450 000 by 2030.
According to DBE, the setting of targets revealed that there were schools in the country that had dropped the
offering of Mathematics in preference to Mathematical Literacy. Through the various interventions the number
of schools not offering mathematics has drastically been reduced, with many of the schools already reintroducing
mathematics. The DBE has invested in the development of the DBE Cloud. Digital curriculum content development
initiatives which were completed in 2014/15 and uploaded on the DBE Cloud included 24 Foundation Phase
interactive workbooks for Numeracy and Literacy, 120 textbooks titles of Mathematics, Natural Science, and
Technology as well as other multimedia resources.
FASSET
The FASSET SSP update (FASSET, 2017) for the financial and accounting services sector includes several
references to ICT skills, as would be expected. Under “Change Drivers in the Sector”, they include Developments
in Technology, with the following comments:
ADRIAN SCHOFIELD 16
2018 JCSE-IITPSA ICT Skills Survey“Developments in information and communication technology have had and continue to have a profound effect
on the work of professionals in the Fasset sector. It has, in many respects, made their work easier – for example
accounting software has simplified the work of accountants (Attolini, 2014) and SARS’s online tax platform has
simplified the work of all tax practitioners. However, accountants, auditors and many other professionals in the
financial field need to stay abreast of changing technology and the associated business risks. At the same time
they need to advise their clients on how to manage the risks and apply new skills to use technology effectively.
“Data security is becoming a crucial issue and all businesses have to introduce additional measures and controls
to safeguard data security and to ensure statutory compliance with the manner in which information is collected,
stored, used and destroyed. This drives the need for information technology professionals and technicians in the
sector.”
After Accountants and Auditors, ICT Professionals are the occupations most in demand, with almost 600 (down
from 1 000 in the previous update) requirements identified in roles including programmers, analysts and
managers. If we add together the similar roles of programmer analyst, developer programmer, software
developer and applications programmer, they constitute half of the ICT occupations in demand in this sector. 21
ICT occupations have been identified as suffering shortages in 2017.
FOODBEV SETA
There is still no update to the information shown in the 2012 report, which indicated the need for ICT Project
Managers (25), ICT Support Engineers (85) and Systems Analysts (315) over the five year period to 2016. The
2017/18 Scarce Skills List for the food and beverage industries no longer mentions ICT related skills.
There is a comment on ICT, as follows: The consolidation in the sector and the imperatives of reducing operating
costs have encouraged the installation of interconnected local networks among large companies, as support for
strategic decision making. The need for greater efficiency in internal processes (production, supply chain
management, administration, marketing and sales etc.) and the integration of internal processes with external
organisations are other factors that drive the increased adoption of information and communication technology
(ICT) solutions in large firms. Increased emphasis on packaging processes, the control of quality in HACCP and
product quality makes ICT increasingly important.”
FP&M SETA
FP&M SETA last published their SSP (FP&M SETA, 2016) in 2016 for the period 2016=2021. There is no specific
mention of ICT roles beyond including “Information Technology expertise” in the top 10 critical skills list.
However, they do provide the following commentary on the impact of technology in their sector:
Technological developments do not have a uniform effect on the demand for labour. On the one hand, the
mechanisation and computerisation of processes may reduce the demand for labour. At the same time
technological changes are the biggest drivers of skills demand in the sub-sector and all levels of workers have to
continuously upgrade their skills if they are to keep up with technological changes. The use of electronic media
is increasing at a rapid rate and is expected to change the face of the printing and publishing sub-sectors locally
and internationally. Paper products used for communication purposes such as newspapers are under threat from
digital technologies and have dropped substantially over the past few years. This has meant that the pulp &
paper sector innovate and look to develop alternative niche markets such as cellulose in cigarette filters,
absorbent wipes and stabilisers.
The importance of social media has grown globally. “Social media has emerged as one of the more important
channels in the online discovery, research and purchase processes” (Indvik, 2012). Social networks are a huge
source of consumer data that can be used effectively, but these sources have been underutilised so far. Some of
the implications that the SETA should consider are the role of social media in changing the way that companies
ADRIAN SCHOFIELD 17
2018 JCSE-IITPSA ICT Skills Surveydo business. For example, can blogging affect the bottom line or share price of a company and to what extent?
Ideally, social media should be incorporated into the strategy of any business including that of the SETA.
HWSETA
There is no mention of ICT skills in the 2017 update to the Health & Welfare SSP for the period 20116/17-
2021/22.
INSETA
The INSETA SSP published in 2017 (INSETA, 2017), as with the banking and financial services sectors, indicates
that technology has become a significant change driver for insurance companies. They mention that
developments in technology, transformational technology and sophisticated and universal technologies are
changing the ways that humans interact with each other and creating floods of information…
“Key trends include Big data, automated underwriting, and technology in marketing, sales and service
provision.” However, they caution that the insurance sector needs “an influx of technological talent” to translate
the opportunities into operation.
The INSETA “hard to fill vacancies” include Java/Oracle Developer and Business Analyst, with
Developer/Programmer (OFO Code 2015-251203) in their Top 10 Scarce Skills Occupations.
LGSETA
The LG SETA published a SSP update for 2018/19 (LG SETA, 2017). The SSP has the following to say about
technology in local government operations:
MERSETA
The merSETA SSP update for the period 2017/18-2021/22 (merSETA, 2017) introduces reference to Advance
Manufacturing and Future Skills in the context of Industry 4.0. They say:
The notion of manufacturing 4.0, future skills and advanced manufacturing has been the rhetoric and front of
mind concepts for a couple of years. Frightening statistics are reported such as those of disruptive labour market
changes, including the rise of robots and artificial intelligence resulting in job losses numbering in the millions.
However, amongst all the chaos, the South African government along with research councils and higher
education institutions have been investing time and energy into research to promote skills alongside
technological advances, particularly in advanced manufacturing and create a substantial number of new jobs
and preserve older jobs through up skilling and reskilling initiatives.
ADRIAN SCHOFIELD 18
2018 JCSE-IITPSA ICT Skills SurveyThese new curricula must account for broad areas with respect to: predictive analytics, artificial intelligence,
additive printing, the internet of things, nanotechnology, automation and robotics.
Professions in the future will centre on the following types of jobs: registered nurses, motor manufacturing
technicians, wind turbine service technicians, flexible app developers, tourism and hospitality professionals,
computer programmers, artificial intelligence and robotics specialists, and cloud computing specialists.
MQA
The SSP for the Mining Qualifications Authority (MQA) published in August 2016 (Mining Qualifications
Authority, 2016) for the 2017-2018 period contains no comment on the ICT skills issues but does include several
relevant occupations in the table of scarce skills (see the following table). The numbers of vacancies are relatively
low but it is significant that the employers regard the skills for the listed occupations as scarce.
We recommend review of the use of OFO codes that differentiate between telecommunications occupations
listed in the table. The granularity may be disguising the common characteristics of the job functions, making it
more difficult to recruit appropriately skilled workers than is necessary.
ADRIAN SCHOFIELD 19
2018 JCSE-IITPSA ICT Skills SurveyPSETA
The most recent SSP for the public service sector is the PSETA SSP Update for 2015-2016 (PSETA, 2014). They
include the following information, relevant to ICT skills:
The highest vacancy rate in any major occupational category is 21,4% for information technology personnel
(2014 data), with 564 vacant posts. Of these 34 are for computer programmers, 108 for computer system
designers and 422 for “other” information technologists. It would be useful for PSETA to share more details of
these requirements with MICT SETA.
To put the 564 posts into context, the vacancy rate for “professionals and managers” in the sector is 15,6% but
this represents more than 40 000 vacant posts.
SASSETA
The SASSETA was placed under administration in 2015 and has not published an update to the SSP since the
2013 edition (SASSETA, 2013). That edition made the following comment about technology:
“Rapid changes in technology have an impact on most sectors, For example, the introduction of the IT security.
From a skills development perspective, the industry should be prepared to effectively deal with technological
changes and innovations.
The introduction of technological changes are introduced primarily to enhance the effectiveness and to increase
efficiency of the security, for instance; to detect cybercrime. With all business striving to increase margins, the
introduction of technology often results in more efficient operations with reduced staff.”
The SASSETA 2013-14 update to the SSP (op.cit.) lists the following as scarce and critical skills:
Scarce skills:
Defence fraternity: Cyber Crime Investigators
Justice fraternity: IT Security Specialist
Policing fraternity: Cyber Crime Investigators
State Security fraternity: Network Specialist, Information Security
Organised labour: Information Communication Technology Specialists
NGOs: IT Specialist
Critical skills:
Corrections fraternity: IT (system developer, business analyst and Information Security)
Legal fraternity: IT Skills/ Cyber Law
Policing fraternity: Computer skills, IT Skills
State Security fraternity: ICT Training Skills, Cyber Crime Investigation Skills, Business Analyst Skills
Organised labour: IT Specialist
There is no quantification of the needs.
SERVICES SETA
The Services SETA SSP for 2017/18 (Services SETA, 2016) contains significant comment on the impact of
technology on some of the sub-sectors covered by the Authority.
“In the real estate industry, technology has had an impact on the design, form and nature of interaction between
sellers and buyers of property on the one hand, and/or between rental agent and lessor, on the other, as more
people turn to various websites and applications (Apps, as they are commonly known) to access, compare and
utilise information. This has necessitated that real estate agents and property management agents use
ADRIAN SCHOFIELD 20
2018 JCSE-IITPSA ICT Skills SurveyYou can also read