2021 REPORT - We Ride Australia

Page created by Lonnie Holmes
 
CONTINUE READING
2021 REPORT - We Ride Australia
WW
    e eR R
         i di ed eA uAsut sr at rl iaal i a

    2021 REPORT

    www.weride.org.au
   www.weride.org.au

A member firm of Ernst & Young Global Limited
Liability limited by a scheme approved under Professional Standards Legislation
2021 REPORT - We Ride Australia
We Ride Australia
                                                                                                        PO Box 973
                                                                                                        Mawson ACT 2607
                                                                                                        yes@weride.org.au

              20 October 2021

              The Australian Cycling Economy Report - Estimating the size and scope of the Australian Cycling Economy
              in 2020

              We Ride Australia (‘WeRide’) is the national independent voice for cycling in Australia. WeRide’s mission is to build a
              healthy, sustainable future through advocacy, program development and research around the bicycle’s role in
              environment, health, infrastructure and safety.

              WeRide has engaged Ernst & Young (“EY”) to conduct a study estimating the economic contribution of the cycling
              economy to Australia in 2020 (the “Study”). The Study is attached to this letter, which outlines the outcome of the work
              undertaken by EY and the basis on which the work was performed.

              The Study was funded with support from the following Corporate and Supporting Partners of WeRide:

                                                                             Corporate Partners

                                                                            Supporting Partners

              Yours faithfully

              Peter Bourke
              Executive Officer
              We Ride Australia
              weride.org.au

                                                www.weride.org.au/australiancyclingeconomy

A member firm of Ernst & Young Global Limited
Liability limited by a scheme approved under Professional Standards Legislation
2021 REPORT - We Ride Australia
The Australian
                    Cycling Economy
                    Estimating the size and scope of the
                    Australian Cycling Economy in 2020

                    We Ride Australia

                    October 2021

A member firm of Ernst & Young Global Limited
Liability limited by a scheme approved under Professional Standards Legislation
2021 REPORT - We Ride Australia
Table of contents

              01 Executive summary                                                03 Introduction

              06 Results                                                          12 Appendix

              About this report
              Estimating the size and scope of the Australian Cycling Economy in 2020.
              In June 2021, We Ride Australia commissioned EY to conduct a study estimating the economic
              contribution of the cycling industry to Australia in 2020.

                Matt Colston                                                         Matt Gill
                Associate Partner                                                    Associate Director
                EY                                                                   EY
                Asia Pacific Leader — EY Sports, Events and Venues Advisory          EY Sports, Events and Venues Advisory

                         The Australian Cycling Economy
A member firm of Ernst & Young Global Limited
Liability limited by a scheme approved under Professional Standards Legislation
2021 REPORT - We Ride Australia
Disclaimer
                                                                                  EY was engaged on the instructions of We Ride Australia (‘Client’)
                                                                                  and in accordance with the terms of our engagement agreement
                                                                                  dated 11 June 2021, to estimate the economic contribution of the
                                                                                  Australian Cycling Economy in 2020 to Australia.
                                                                                  The results of EY’s work, including the assumptions and
                                                                                  qualifications made in preparing the report, are set out in EY's
                                                                                  report dated 11 October 2021 (‘Report’). The Report should be
                                                                                  read in its entirety including the introductory chapters,
                                                                                  the applicable scope of the work and any limitations. A reference to
                                                                                  the Report includes any part of the Report. No further work has
                                                                                  been undertaken by EY since the date of the Report to update it.
                                                                                  Our work commenced on 11 June 2021 and was completed on 11
                                                                                  October 2021. Therefore, our Report does not take account events
                                                                                  or circumstances arising after 11 October 2021 . No further work
                                                                                  has been undertaken by EY since 11 October 2021 to update it.
                                                                                  EY has prepared the Report for the benefit of the Client and has
                                                                                  considered only the interests of the Client. EY has not been
                                                                                  engaged to act, and has not acted, as advisor to any other party.
                                                                                  Accordingly, EY makes no representations as to the
                                                                                  appropriateness, accuracy or completeness of the Report for any
                                                                                  other party's purposes.
                                                                                  No reliance may be placed upon the Report or any of its contents by
                                                                                  any party (“Third Parties”) other than the Client. Any Third Party
                                                                                  receiving a copy of the Report must make and rely on their own
                                                                                  enquiries in relation to the issues to which the Report relates, the
                                                                                  contents of the Report and all matters arising from or relating to or
                                                                                  in any way connected with the Report or its contents.
                                                                                  EY have consented to the report being released publicly. EY
                                                                                  disclaims all responsibility to any Third Parties for any loss or
                                                                                  liability that the Third Parties may suffer or incur arising from or
                                                                                  relating to or in any way connected with the contents of the Report,
                                                                                  the provision of the Report to the Third Parties or the reliance upon
                                                                                  the Report by the Third Parties.
                                                                                  The material contained in the Report, including the EY logo, is
                                                                                  copyright. The copyright in the material contained in the Report
                                                                                  itself, excluding EY logo, vests in the Client. The Report, including
                                                                                  the EY logo, cannot be altered without prior written permission
                                                                                  from EY.
                                                                                  No claim or demand or any actions or proceedings may be brought
                                                                                  against EY arising from or connected with the contents of the
                                                                                  Report or the provision of the Report to the Third Parties. EY will be
                                                                                  released and forever discharged from any such claims, demands,
                                                                                  actions or proceedings.
                                                                                  In preparing this Report we have considered and relied upon
                                                                                  information from a range of sources believed to be reliable and
                                                                                  accurate. We have not been notified that any information supplied
                                                                                  to us, or obtained from public sources, was false or that any
                                                                                  material information has been withheld from us. Neither EY nor any
                                                                                  member or employee thereof undertakes responsibility in any way
                                                                                  whatsoever to any person in respect of errors in this Report arising
                                                                                  from incorrect or incomplete information provided by
                                                                                  the Participant Survey or other information sources used.
                                                                                  We do not imply and it should not be construed that we have
                                                                                  verified any of the information provided to us, or that our enquiries
                                                                                  could have identified any matter that a more extensive examination
                                                                                  might disclose.
                                                                                  Our conclusions are based, in part, on the assumptions stated and
                                                                                  on information provided by the Client and other information sources
                                                                                  used during the course of the engagement. The modelled outcomes
                                                                                  are contingent on the collection of information and assumptions as
                                                                                  agreed with the Client and no consideration of other market events,
                                                                                  announcements or other changing circumstances are reflected in
                                                                                  this Report.
                                                                                  We highlight that our analysis and Report do not constitute
                                                                                  investment advice or a recommendation to you on a future course.

                         The Australian Cycling Economy
A member firm of Ernst & Young Global Limited
Liability limited by a scheme approved under Professional Standards Legislation
2021 REPORT - We Ride Australia
Executive summary
                  Estimating the size and scope of the Australian
                                                                                        In 2020, the Australian Cycling
                  Cycling Economy in 2020 (this Study) represents
                  the first time Governments, wholesalers, retailers                    Economy is estimated to have
                  and bicycle related organisations gain an insight                     directly contributed:
                  into the contribution of the Australian Cycling
                  Economy.

              The Australian Cycling Economy (“cycling economy” or
              “industry”) engages with a broad range of participants, with an
              estimated one in three Australian adult’s spending on cycling
              related goods or services in 2020.1
                                                                                        $6.3b
              Cyclists can engage in the industry as a means of sport and               direct industry output
              recreation, but also as a mode of transport to work or other
              commitments and as part of their tourism activities.
              As this is the first time a study of this nature has been                 Including…
              undertaken for cycling in Australia, it provides a unique insight
              into the cycling industry and its estimated contribution to the
              Australian economy.

                                                                                        $3.4b
              The Australian Cycling Economy as defined for this Study
              includes expenditure of participants on items such as new
              bicycles, accessories & equipment, servicing, bike hire,
              merchandise and media & subscriptions. It also includes local
              and state government expenditure on bicycle infrastructure and
              programs, bicycle organisation spend and private sector spend
              on logistics and end of trip facilities.
                                                                                        direct value add
              Growing cycling engagement and participation in the industry
              relies heavily on the built environment, including active
              transport infrastructure, but also the programs and safety                Supporting…
              initiatives that exist to support the industry.

                  Whilst this Study focuses on the economic contribution of the

                                                                                        34,295
                  industry, it is recognised that the physical activity benefits of
                  cycling participation support broader health & wellbeing,
                  social and productivity benefits to the Australian economy.
                  Cycling as a mode of transport can also benefit local
                  communities through reducing road congestion and providing
                  a sustainable transport option.                                       direct jobs (FTE)
                  Estimates included in this Study do not include quantification
                  of these important broader benefits. There is potential that
                  these benefits are material and the cycling industry would
                  benefit from their quantification within the scope of future
                                                                                      1 TheAdult population assessed as part of this Study includes
                  studies.
                                                                                      Australians aged between 18 to 90.

              1          The Australian Cycling Economy
A member firm of Ernst & Young Global Limited
Liability limited by a scheme approved under Professional Standards Legislation
2021 REPORT - We Ride Australia
Executive summary
              This Study estimated that in 2020:

             5.8m                                                     3.3m                                       $990
             Estimated number of Australian adults                    Estimated number of adults that spent      Average annual spend on cycling
             who spent money on cycling related                       money on cycling and cycled at least       related goods and/or service
             goods or services. This equates to 29%                   once per week.                             (spenders only).
             of adults aged between 18 and 90.

              1.7m                                                     28%                                        $900
              Estimated number of bicycles purchased                   Percentage of bicycles purchased that      Average retail cost of bicycles
              in Australia.                                            were children’s bikes.                     purchased in Australia.

               43%                                                    $118m                                       $428m
               Percentage increase in annual spend                    Estimated increase in annual                Estimated state/territory and local
               between adults that cycle at least once                expenditure if cyclists who indicated       government investment in bicycle
               per week compared to other spenders                    they would ride more frequently as a        related infrastructure and programs.
               (i.e. those cycling at least once per                  result of improving bikeways in urban
               fortnight or less).                                    areas moved from cycling at least once
                                                                      per fortnight to at least once per week.

              2          The Australian Cycling Economy
A member firm of Ernst & Young Global Limited
Liability limited by a scheme approved under Professional Standards Legislation
2021 REPORT - We Ride Australia
Introduction

              Estimating the size and scope of the Australian Cycling Economy in 2020 (this
              Study) represents the first time Governments, wholesalers, retailers and bicycle
              related organisations gain an insight into the contribution of the Australian
              Cycling Economy.
              The Australian Cycling Economy (“Cycling economy” or                    Figure 1: Cycling consumer expenditure survey demographics 1
              “Industry”) is large and diverse, engaging with a broad

                                                                                             29%
              participant base and generating expenditure that spans                                           of Australian adults
              across a number of sectors. It is estimated that over 1 in 3                                     spent money on
              adult Australian’s spent money on cycling related goods or                                       cycling in 2020…
              services in 2020.                                                                                                                    NT
                                                                                                                                                             QLD
                                                                                                                                                   1%
              Cyclists can engage in the industry as a means of sport &                   … with NSW and                                                     19%
              recreation, but also as a mode of transport to work or                      VIC containing the                           WA          SA
              other commitments and as part of their tourism activities.                  highest number of                            9%          5%         NSW ACT
                                                                                          cycling consumers.                                                  31% 2%
              Growing cycling engagement and participation relies                                                                                            VIC
              heavily on the built environment, including active                          The majority of consumers (31%)                                    31%
                                                                                                                                                                TAS
              transport infrastructure, but also the programs and safety                  are within the $50k - $99k                                             2%
              initiatives that exist to support the industry.                             income bracket.
              As this is the first time a study of this nature has been
              undertaken for cycling in Australia, it provides a unique                                                                     Less than $50,000
              insight into the cycling industry and its contribution to the                                     4%
                                                                                                                      19%                   $50,000-$99,999
              Australian economy.                                                                       21%
                                                                                                                                            $100,000-$149,999
              Whilst this Study focuses on the economic contribution of
              the industry in 2020, it is recognised that the physical                                                                      $150,000+
              activity benefits of cycling participation support broader                                                 31%
                                                                                                         25%
              health & wellbeing, social and productivity benefits to the                                                                    Prefer not to
              Australian economy.                                                                                                           say/Don't know

              Cycling as a mode of transport can also benefit local
              communities through reducing road congestion and                             The majority of people that
              providing a sustainable transport option.                                    spend on cycling are aged
                                                                                           between 18–34 and over                                  5%
              Estimates included in this Study do not include                                                                                12%
              quantification of these important broader benefits. There                    36% of consumers are
              is potentially for these benefits to be material and the                     aged between                                                      46%
              cycling industry would benefit from quantifying these                        35–49.
              benefits within the scope of future studies.                                                                                36%
                                                                                           Approximately 53% of
                                                                                           those who spend on
                                                                                           cycling identified as
                                                                                                                                   Age range:
                                                                                           male and 47%                                                                 2
                                                                                                                                    18-34       35-49    50-64     65+
                                                                                           identified as female.3

                                                                                  1 Based  on the results of Participant Survey Study
              3          The Australian Cycling Economy                           2   Maximum age range of 90 years of age
                                                                                  3   0.2% of respondents identified as ‘other’.
A member firm of Ernst & Young Global Limited
Liability limited by a scheme approved under Professional Standards Legislation
2021 REPORT - We Ride Australia
Methodology                                                         Limitations
              EY has taken the following approach to estimate the                 The following limitations should be considered:
              economic contribution of the Australian Cycling Economy:
                                                                                  •   While effort has been made to include all areas of the
              1.   Defining the boundaries of the cycling economy:                    cycling economy in estimating the economic
                                                                                      contribution, there are areas of the economy that have
              The Australian Cycling Economy was defined by EY through
                                                                                      not been included in this analysis due to an inability to
              consultations with We Ride Australia (WeRide) and cycling
                                                                                      access sufficient data at this time. Where data gaps
              stakeholders. The inflows and outflows of expenditure and
                                                                                      occurred, where possible, data was extrapolated
              revenue of each element of the sector were mapped in
                                                                                      against relevant population assumptions.
              order to capture all aspects of the industry, whilst avoiding
              double counting. Purchases via international online                 •   A key consideration in the analysis and extrapolation of
              platforms were excluded from estimates. Further details of              data is the interconnected nature of industry elements
              how the cycling industry was defined are provided in the                in the supply chain. While effort has been made to avoid
              diagram over the page.                                                  the double counting of sales/expenditure, there may be
                                                                                      discrepancies in the data provided.
              2.   Data gathering
                                                                                  •   Consultation with certain data providers were held to
              EY collected a combination of primary and secondary data
                                                                                      determine the factuality of data provided for this Study.
              from the following sources to estimate the economic
                                                                                      However, EY did not validate the accuracy of all data
              contribution of the industry:
                                                                                      provided through the data gathering process.
              Cycling consumer
                                                                                  •   In instances where data was not provided, data was
              To understand the proportion of the population that spent               assessed from prior years and extrapolated to the
              on cycling and their cycling expenditure habits, an online              relevant year based on assumptions.
              survey was conducted by EY Sweeney:
                                                                                  •   This Study includes both non-electric bicycles, electric
              •    The survey was distributed to n=3,840 adult                        bicycles, bike rentals and indoor / stationary cycling. It
                   Australians in August 2021, of these 1371 qualified for            does not include scooters, skateboards or related
                   the survey and 1200 completed the survey.                          equipment.
                   Qualification was restricted to those who have spent
                                                                                  •   The scope of this Project focused on estimating the
                   money on cycling or related activities between 2019
                                                                                      contribution of the cycling economy to Australia. We
                   and 2021. 1125 respondents spent money on cycling in
                                                                                      have provided an indicative breakdown by state and
                   2020.
                                                                                      territory using a top down cycling population approach
              •    The survey had a maximum margin of error of ±4.6% at               as an indication only i.e. the allocation of overall
                   the 95% level of confidence. This means that we can be             participant contributions to state and territories is
                   95% confident that survey estimates will be reflective of          based on the relevant cycling population in each state
                   the total population to within ±4.6%.                              and territory.
              •    All population data was weighted according to the
                   proportions of age, gender and location specified
                   in accordance with the Australian Bureau of
                   Statistics (ABS).
              •    The Survey was also distributed to the AusCycling
                   member base, with data used to inform this Study.
              Governments, public sector and private organisations
              EY and WeRide identified a range of cycling industry
              stakeholders (government, private sector and not for profit
              organisations) who were approached to provide
              expenditure and revenue data related to cycling.
              Consultations were held following the receipt of data to
              provide further clarity on the information provided.
              Where primary data was not available, desktop research
              was undertaken to inform assumptions. A list of public data
              sources used as part of the analysis is provided in
              Appendix A.
              3. Economic modelling
              Direct impact:
              The direct impact was calculated based on the expenditures
              of the components of the cycling economy captured in the
              data gathering stage. The inflows and outflows of
              expenditure and revenue of each element of the sector was
              mapped in order to avoid double counting.
              Indirect impact:
              To estimate the indirect expenditure, value-add (direct and
              indirect) and employment (direct and indirect) impact, EY
              conducted an Input-Output (IO) multiplier analysis. IO
              multipliers were supplied by REMPLAN.

              4          The Australian Cycling Economy
A member firm of Ernst & Young Global Limited
Liability limited by a scheme approved under Professional Standards Legislation
2021 REPORT - We Ride Australia
Defining the Australian Cycling Economy
              The Australian Cycling Economy has a number of interrelated components that flow through the economy including expenditure
              of cycling consumers, Governments, the public sector and the private sector.
              To capture the expenditure of the cycling economy in Australia, this Study first defined the boundaries of the industry. This was
              achieved through mapping the high level revenue and expenditure flows of each component of the industry. This was conducted
              in consultation with We Ride Australia and other cycling stakeholders.
              The components of the industry that have been assessed as part of this Study are outlined in the diagram below.

                Figure 2: High Level Cycling Economy Expenditure Map

                                                                                                                                          Cycling
                      Government                                                  Key cycling and related                               consumers
                                                                                      organisations

                             $                                                                                                              $

                          Cycling                                                                                                     Bikes, equipment,
                      Infrastructure                                                                                                   accessories and
                                                                                                                                          servicing

                                                        Private facility                Wholesalers /        Retailers / hire /
                                                          companies                      suppliers            service stores

                   Cycle campaigns /
                                                                                                                                        Memberships
                       programs

                                                                                          Bicycle
                                                                                       organisations

                      Sponsorship /                                                                                                     Events, tourism
                        donations

                                                                                                                                    Other (Bike Coaching,
                      Cycling High                                                                                                    Memberships and
                                                                                     Event organisations
                      performance                                                                                                         Coaching)

                                                       National / State                                       National cycling
                                                          institutes                                               teams
                                                                                                                                         Media and
                                                                                                                                        subscriptions

                                                                                     Cycling media and
                                                                                     service companies                                    Courier
                         Cycling
                                                                                                                                          services
                          R&D

                                                          Universities                                      Logistics / transport
                                                                                                                 companies

              5          The Australian Cycling Economy
A member firm of Ernst & Young Global Limited
Liability limited by a scheme approved under Professional Standards Legislation
Results

              The Australian Cycling Economy is estimated to have directly contributed $6.3b
              direct industry output, including $3.4b direct value added, in 2020.

              Direct Contribution                                                       Figure 3: Economic Contribution breakdown (2020)
              The direct contribution of the Australian Cycling Economy reflects
              the economic activity directly generated by all elements of the                                                   Total Economic
                                                                                                                                Contribution =
              cycling industry, including activity generated by cycling participants,
                                                                                                                                Direct Output +
              bicycle organisations, events, universities, national cycling teams
                                                                                                          $16.8b
                                                                                                                                Indirect Output
              and local & state governments.
                                                                                         Direct
              In 2020, the Australian Cycling Economy is estimated to have               Output =
              directly generated $6.3b direct gross output and $3.4b direct value        Direct          Total Economic
                                                                                         Primary                                    Indirect Output =
              add.
                                                                                         Inputs +
                                                                                                          Contribution              Indirect Primary
                                                                                         Direct                                     Inputs + Indirect
              Direct contribution or “Gross Output” is the market value of goods                                                    Value Add
                                                                                         Value Add
              and services (i.e. gross revenue) produced by each segment of the
              cycling industry, after accounting for intra-industry sales (to avoid
              double counting).                                                                  $6.3b                $10.5b
                                                                                                Direct Output         Indirect Output
              Value Add is the market value of goods and services produced by
              the cycling industry, after deducting the cost of goods and services
              used. That is, Value Add is a subset of Gross Output and represents
              the marginal/additional economic value generated by the cycling            $3.4b            Direct
                                                                                                         Primary
                                                                                                                   $5.1b          Indirect
                                                                                                                                  Primary
              industry. As such, direct value add is commonly put forward as the                                    Indirect
                                                                                        Direct Value      inputs                   inputs
              most appropriate measure of the relative contribution of an industry          Add                    Value Add
              to the economy.

              Total Contribution (direct and indirect)
                                                                                        Figure 4: Value Add Summary (2020)
              The direct economic contribution of the Australian Cycling Economy
              also generates ‘flow on’ effects to other industries, including
              supplier demand for intermediate goods and services and additional
              consumption by people employed in the cycling economy. This is
              called the indirect contribution.
                                                                                                           $8.5b                  Total Value
                                                                                                                                  Add = Direct
                                                                                                                                  Value Add +
                                                                                                                                  Indirect Value
              For example, money spent at bike retailers by consumers is                                 Total Value Add          Add
              allocated between material inputs (such as bike parts), wages and
              profits of the retailers. Wages spent by the employees of the bike
              retailer (for example, on household items) circulates the money
              throughout a broader economy creating indirect benefits. This
              includes flow on expenditure on cycling and non-cycling related
                                                                                                $3.4b                   $5.1b
                                                                                              Direct Value Add       Indirect Value Add
              items.
              After estimating the indirect contribution using input-output
              multipliers, the cycling industry generated a total economic
              contribution (direct and indirect) in 2020 of (see Figure 3):
              •   $16.8b Total Gross Output
              •   $8.5b Total Value add.

              6          The Australian Cycling Economy
A member firm of Ernst & Young Global Limited
Liability limited by a scheme approved under Professional Standards Legislation
The Australian Cycling Economy supports a broad range of employment
              opportunities across the Australian economy.

                  Employment (Direct and Indirect)                                                     Figure 5: Direct, Indirect and Employment (FTE)

                  In 2020, it is estimated that the Australian Cycling
                  Economy expenditure generated 62,330 jobs (full time
                  equivalent), including:                                                                                     62,330
                  • 34,295 direct jobs                                                                                       Total jobs (FTE)
                     This represents the people employed as a direct result
                     of the $6.3b direct output generated by the cycling
                     economy in 2020.
                  • 28,035 indirect jobs
                                                                                                                34,295                       28,035
                     This represents employment from the ‘flow on’ effects                                        Direct Jobs                 Indirect Jobs
                     to other industries, including employment supported by
                     expenditure relating to supplier demand for
                     intermediate good and services and additional
                     consumption by people employed in the industry.

                    Impact of the COVID-19 Pandemic1
                    The COVID-19 pandemic and subsequent movement restrictions have impacted the cycling economy in a unique way.
                    Whilst many cycling industry shopfronts and tourism providers were negatively impacted by social restrictions, the
                    overall demand for bikes has increased materially. Between FY19 and FY21, total number of bicycle imports increased
                    46% from approximately 1.2 million to 1.7 million. 2
                    This increased demand for bike purchases in 2020 is reflected in contribution estimates, offset to an extent by the
                    capacity of participants to spend on things like tourism and events which have been negatively impacted by social
                    restrictions.
                    Whilst the future spend profile of cyclists is unknown, 50% of participants surveyed indicated that they would increase
                    their frequency of riding and 61% indicated they would increase their cycling related expenditure in the future. The
                    outcomes of this Study indicate the more people cycle, the more they spend (refer to page 10), so there is potential that
                    whilst the demand for new bikes may diminish, participants using these bikes more frequently may spend more in other
                    categories (e.g. servicing, apparel etc.).

              Cycling Economy comparison

              As the cycling industry is unique, it is difficult to compare the contribution of the industry to similar industries. While cycling is a
              mode of transport and could be considered a sport and recreation industry, it could also be considered a tourism and event
              industry. The graph below outlines the contribution estimates of other sport / entertainment industries in Australia to provi de a
              comparison of the relative size of the cycling economy.

              Graph 1: Direct Value Add Industry Comparison 3

                                         $7.0bn
                                                                                                                                 $6.0bn
                                         $6.0bn

                                         $5.0bn

                                         $4.0bn                                   $3.4bn                  $3.4bn
                                         $3.0bn

                                         $2.0bn
                                                            $1.0bn
                                         $1.0bn

                                         $0.0bn
                                                      Australian Motor    Australian    Australian   Australian Live
                                                      Sport Indsutry in thoroughbred Cycling Economy Entertainment
                                                           2019         racing industry    2020      Industry 2019
                                                                           2016 -17

                                                                                     1 Note  that this Study did not directly assess the impact of COVID-19 on
                                                                                     the Australian Cycling Economy
                                                                                     2 Bicycle Industries Australia, Bicycle Import Data 2021

                                                                                     3 Inflated   to 2020 AUD dollar values. Sources provided in Appendix A.
              7          The Australian Cycling Economy
A member firm of Ernst & Young Global Limited
Liability limited by a scheme approved under Professional Standards Legislation
Breakdown of estimated contribution                                                       Graph 2: In-scope direct expenditure per component — 2020
                                                                                                        ($m)1
              by category
              The breakdown of total estimated direct expenditure ($6.3b)                                                 Bicycle Purchases                                              $1,566
              across the cycling economy in 2020 is presented in Graph 2.
                                                                                                        Bicycle related tourism and services                                    $1,168
              Bicycle purchases is the largest component of expenditure in                                              Bicycle Equiptment                           $668
              the industry in 2020 estimated at $1.6b, this equates to
                                                                                                                         Bicycle accessories                       $553
              approximately 1.7m bikes purchased in 2020. Bicycle related
                                                                                                                                                2
              tourism and services was the second highest component of                                                                 Other                       $519
              direct expenditure at $1.2b.                                                                            Bike Hire & Entry Fees                  $403

              Based on available data, it is estimated that State and Local                                Bicycle repair / servicing charges                 $396
              Governments across Australia spent approximately $428m on                                             Media and subscriptions                  $325
              cycling related infrastructure and programs to advocate and                                                 State Government                  $218
              promote cycling in their regions. Given a significant
              proportion of cycling related infrastructure spend occurs                                                   Local Government                  $210
              within larger transport projects, there is a potential that this                                                 Merchandise              $165
              is a conservative estimate. Further work to decouple this                                         Major Events and NRS Teams             $101
              expenditure would provide a clearer view on the industries
                                                                                                                     Logistics and Transport          $35
              contribution, however this was outside the scope of
              this Study.

              Both Victoria and the ACT populations engage in cycling at a greater rate when
              compared to other states and territories, contributing to their state/territory
              estimate.
              An estimated 34% of Victorian and 43% of ACT residents spent money on cycling in 2020, compared to the national average of
              29%.
              Victoria and New South Wales accounted for the highest proportion of economic contribution. Victoria contributed an estimated
              $1.93b in direct output (equivalent to $290 per capita) and New South Wales contributing $1.91b in direct output (equivalent to
              $235 per capita). It is also worth noting that ACT has a high per capita spend of $350 reflecting a high level of engagement in
              the cycling economy.
              Figure 6: Economic contribution per State — 2020 ($m) 3

                                            Northern Territory                                        Queensland

                                                            Direct      Indirect        Total                        Direct      Indirect           Total

                                           Output            $89          $72           $161       Output            $1,196      $1,711             $2,908

                                           Value Add         $49          $37            $86       Value Add          $640        $831              $1,471

                                           Jobs (FTE)        407          173            580       Jobs (FTE)        6,878        4,952             11,829

                                                                       % of total contribution
                  Western Australia                                                                                                New South Wales

                                  Direct      Indirect      Total                                                                                      Direct        Indirect      Total

                Output            $562         $709        $1,271                                NT                              Output                $1,913        $3,090       $5,003
                                                                                                            QLD
                                                                                                 1%
                Value Add         $302         $349         $651                                            19%                  Value Add             $1,028        $1,511       $2,538

                Jobs (FTE)        2,499        1,648        4,148                                                                Jobs (FTE)            10,471         8,302       18,774
                                                                                   WA
                                                                                                 SA
                                                                                   9%
                  South Australia
                                                                                                 6%         NSW ACT                Australian Capital Territory
                                                                                                             30% 2%
                                  Direct      Indirect       Total                                                                                     Direct        Indirect      Total
                                                                                                           VIC
                   Output         $370         $517         $886                                           30%                      Output             $149           $291         $440

                  Value Add       $195         $250         $444
                                                                                                               TAS                 Value Add            $82           $74          $155
                                                                                                               2%
                  Jobs (FTE)      2,141        1,593        3,735                                                                 Jobs (FTE)            761           389          1,150

                                            Victoria                                                  Tasmania

                                                            Direct      Indirect        Total                        Direct      Indirect           Total

                                             Output        $1,929       $3,301          $5,230         Output         $118        $138              $256

                                            Value Add      $1,035       $1,592          $2,627        Value Add       $63          $68              $131

                                           Jobs (FTE)      10,863        9,216          20,080        Jobs (FTE)      702          424              1,127

              1Note:   Where necessary, component revenue / expenditure has been adjusted to avoided double counting
              2Other   includes Bike Coaching, Memberships and Insurance and in-scope bicycle organisation & university expenditure
              3Economic    contribution (direct and indirect) estimates used state / territory multipliers and will therefore not sum to Austra lian estimates.

              8             The Australian Cycling Economy
A member firm of Ernst & Young Global Limited
Liability limited by a scheme approved under Professional Standards Legislation
The Australian cyclist
              This study profiled Australian cycling consumers to                               Graph 4: Level (%) of engagement in types of cycling at least once
              understand their cycling behaviours and preferences.                              per month (proportion of total spenders)
              It found:
                                                                                                80%
              • The cycling consumer is diverse and engages in the                              70%
                   industry as a means of sport and recreation, but also as a
                                                                                                60%
                   mode of transport to work or other commitments and as
                   part of their tourism activities.                                            50%
                                                                                                40%
              • Fitness was the primary motivating factor for cycling                           30%
                                                                                                                                                                   69%
                                                                                                                                                            59%
                   amongst the adult population in 2020 with socialising                                                                       52%    56%
                                                                                                20%                              41%   44%
                   and connection another key motivating factor.                                            33%   35%     36%
                                                                                                10%
              • The most popular form of cycling is recreational road                            0%
                   cycling, with 69% of those who cycle at least once a
                   month noting that they engage in recreational road                                   BMX riding
                   cycling.                                                                             Bicycle riding to and/from school, university and study
                                                                                                        Bicycle riding to children’s school
              • Metropolitan riders more likely to spend more
                   frequently on bicycles than those living in regional areas.                          Bicycle riding to work
                   Four in ten (42%) metro riders have spent money related                              Mountain biking
                   to bicycle riding in the last month compared with three in                           Indoor/stationary cycling
                   ten (27%) regional riders. Metro (48%) riders were also                              Bicycle riding to other destinations
                   more likely to expect an increase in their bicycle related                           Bicycle riding to the shops
                   spending compared to regional (38%) riders.                                          Recreational road cycling
              • While online cycling related purchasing is common,
                   there is a continued role for in-store shopping, with the
                   vast majority of cycling consumers purchasing equipment
                   (72%) and/or accessories (67%) both online and in-store,
                   very few opting for online only shopping (both 3%). In                       Graph 5: Cyclists who cycle at least once a month — type of
                   contrast, three in ten (30%) purchased bicycle equipment                     cycling activity
                   and one in four (25%) purchased bicycle accessories
                   purely in-store.                                                                                  For exercise/fitness                                82%

                                                                                                                   Friends - Social riding                   46%

                                                                                                        Spend time with family/children
                                   5.8m adults spent money
                                                                                                                                                            44%

                                                                                                      Mode of transport (e.g. to work, to
                                   on cycling                                                                          school, to shops)
                                                                                                                                                            41%

                                   in Australia in 2020                                                 For travel and tourism purposes              18%

                                                                                                      Participate in mass cycling events
                                                                                                                                                    12%
                                                                                                                      (including fondos)

                                                                                                       Participate in amateur/club races            11%
                  Graph 3: Breakdown of frequency of cycling in 2020

                     At least once a week                                                                                           Other      2%

                                                                             29% of Adult                            Don't know/unsure         1%
                                                                             Australians are
                     At least once each                                      estimated to
                     fortnight                                               spend on cycling
                                                                  16%
                     At least once a month
                                                                         4%
                                                                             4%
                     Less than once a                   71%                       3%
                     month                                                        1%

                     Don't cycle -
                     purchased for family
                     member
                     Don't spend on               71% of Adult Australians
                                                  did not spend on cycling
                     cycling

              9          The Australian Cycling Economy
A member firm of Ernst & Young Global Limited
Liability limited by a scheme approved under Professional Standards Legislation
Cycling consumer expenditure                                                   Graph 7: Estimated average annual spend by cycling frequency
              breakdown                                                                                           $1,400
                                                                                                                              $1,214
                                                                                                                  $1,200
              As highlighted on Graph 3 on the previous page, an                                                                              $969

                                                                                             Spent per year ($)
                                                                                                                  $1,000
              estimated 29% of the Australian adult population spent                                                                                       $787
              money on cycling related goods or services in 2020. This                                             $800
              includes those that cycle at least once a week and non-                                              $600
              cyclists who likely bought for a child or as a present.                                                                                                    $372
                                                                                                                   $400                                                             $256
              There are multiple ways that cyclists spend in the cycling                                           $200
              economy, including through the purchase of new bikes or
                                                                                                                     $0
              equipment, bike hire, bicycle related tourism, merchandise                                                      At least     At least    At least        Less than Don't do
              and/or bike coaching (see Figure 8).                                                                            once a      once each    once a           once a this type of
                                                                                                                               week       fortnight    month            month       cycling
              There appears to be a direct link between cycling frequency                                                                                                         (purchase
              and expenditure profiles:                                                                                                                                          for child or
                                                                                                                                                                                     as a
              •      Cyclists who rode at least once a week, spent on                                                                                                              present)
                     average 43% more on cycling related items than other
                     participants, and just over 25% more than participants
                     who cycled at least once a fortnight.                                   Figure 8: Estimated average annual spend category and incidence
                                                                                             for those that spent money in the category
              •      Almost 85% of total consumer spending was generated
                     by those that cycle at least once a fortnight.                                                                                                     Avg.
                                                                                                                                                                              Incidence of
                                                                                             Expenditure categories                                                    Spend(
              In terms of cycling expenditure categories, the majority                                                                                                          spend (%)
                                                                                                                                                                         $) 1

              (71%) of consumers spent on bicycle accessories and over
              half (59%) spent on bicycle equipment.                                         Bicycle purchases                                                         $1,066         25%

              Bicycle purchases                                                              Bicycle equipment                                                          $194          59%

              Bicycle purchases represented the largest expenditure                          Bicycle accessories                                                        $133          71%
              category, with an estimated 1.5 million consumers
              purchasing approximately 1.7 million bicycles in 2020. The                     Bicycle repair/servicing charges                                           $150          45%
              average retail cost of bicycles purchased in Australia was                     Bike Hire & Entry Fees                                                     $283          24%
              $900.
                                                                                             Merchandise                                                                $187          15%
              Estimates are materially consistent with the Bicycle
              Industries Australia 2020 calendar year import data (1.4                       Cycling related media and subscriptions                                    $480          13%
              million bikes) and the industry assumption that there are
                                                                                             Bicycle related tourism and services                                      $1,044         19%
              approximately 300k bicycles in stock in shops and
              warehouses. The impact of COVID-19 saw a material                              Other2                                                                     $220          39%
              increase demand for bikes, with financial year 2021 imports
              increasing to 1.75 million.

                                                                                            Graph 8: Where people predominately cycle

                                      1.7m                                                                                               1%
                                                                                                                      2%                               On the road (including on road bike
                                      Bicycles sold                                                                                                    lane)

                                                                                                                                                       On a separated bike path (including
                                      in Australia in 2020                                                            29%                              shared bike paths)
                                                                                                                                              64%      Off-road / on a mountain bike trail
                                                                                                                                                       (including off road sports facilities)
                                                                                                           31%
                                                                                                                                                       Indoor trainer at my house
                  Graph 6: 2020 estimated bicycle purchases by category and retail
                  price range
                                                                                                                                                       Other, please specify

                                                                                                                               63%
                           Children's bicyle                                         470k                                                              Don't know/unsure

              Road Bicycle (incl. time trial,
                    gravel and adult BMX)                                           444k

                                                                                             Graph 9: Household status of those who spend on cycling
              Mountain Bike (incl. off-road
                                                                                    438k
                                   and CX)                                                                         Single - living at home with parents                12%

                      Lifestyle / Commuter                              290k                                                         Single – live alone           10%

                                                                                                            Single - live in shared accommodation
                                                                                                                                                                  6%
                                                                                                                     with other adults (not parents)
                                     Electric      54k
                                                                                                                   Single parent with children at home            8%

                      Retail price range:                                                                                    Couple – children at home                                   46%
Barriers to cycling
              This Study also asked Australians on their barriers to                                        • If cyclists moved from cycling at least monthly to
              cycling. It found:                                                                                 at least once per fortnight as a result of improving
                                                                                                                 bikeways in urban areas, total expenditure could
              • Improving bikeways in urban areas would have the                                                 increase by $90 million annually, equating to $182
                   highest impact on the propensity to cycle:                                                    per cyclist.
                   • 55% of cyclists who currently cycle at least once per                              • An estimated 69% of Australian cycling consumers
                       fortnight would cycle at least 2 additional trips if this                            would be encouraged to ride more if there was an
                       barrier was addressed, indicating they would cycle an                                increased feeling of safety while riding with motor
                       additional 4.0 trips per month on average.                                           traffic. An estimated 60% would be encouraged to
                   • 62% of cyclists who currently cycle at least once per                                  cycle further if there were fewer heavy vehicles on the
                       month would cycle more frequently if this barrier was                                road when they cycle.
                       addressed, indicating they would cycle an additional
                       4.3 trips per month on average.
                   • Based on above and the difference between
                       expenditure profiles estimated as part of this Study,
                       it is estimated that:
                       • If cyclists moved from cycling at least once per
                           fortnight to at least once per week as a result of
                           improving bikeways in urban areas, total
                           expenditure could increase by $118 million
                           annually, equating to $245 per cyclist.

                Figure 9: Number of additional trips per month that would be taken, for cyclists who currently cycle at least once per fortnight and once per
                month, if barriers are addressed

                                                                             Cycling Frequency - At least once each               Cycling Frequency - At least once each
                                                                                           fortnight                                             month
                 Cycling initiative
                                                                           % of cyclists that                                  % of cyclists that
                                                                                                      Additional trips /                                    Additional trips /
                                                                          would take at least 2                               would take at least 1
                                                                                                       month (avg.)1                                         month (avg.)1
                                                                            additional trips2                                   additional trip3

                   Bikeways in urban areas                                        55%                         4.0                       62%                        4.3

                   More dedicated off-road bicycle and rail trails                51%                         4.3                       57%                        4.1

                   Better connected separated bike paths to
                                                                                  51%                         3.9                       56%                        4.0
                   transport hubs or activity hubs

                   If heavy vehicles were removed from urban
                                                                                  43%                         5.0                       34%                        4.7
                   areas

                   Financial incentives to purchase bicycles for
                                                                                  37%                         5.7                       38%                        5.2
                   commuting (i.e. tax incentives)

                   Lower speed limits were in place on local
                                                                                  38%                         4.0                       32%                        4.3
                   streets
                   Better facilities on PT or at major PT
                   stations/hubs (e.g. storage or parking) for my                 35%                         4.3                       38%                        4.6
                   bike
                   Greater investment in mountain bike parks at
                                                                                  24%                         2.8                       34%                        2.7
                   Australian holiday destinations

                                                                      1 Average  trips per cyclist who indicated they would cycle more frequently with outliers removed
                                                                      – outliers defined as those with more than 30 extra trips per month
                                                                      2 Assumes cyclist in this category would need to cycle at least twice more per month to move

                                                                      cycling frequency profiles
                                                                      3Assumes cyclist in this category would need to cycle at least once more per month to move
              11          The Australian Cycling Economy              cycling frequency profiles
A member firm of Ernst & Young Global Limited
Liability limited by a scheme approved under Professional Standards Legislation
Appendix

              12         The Australian Cycling Economy
A member firm of Ernst & Young Global Limited
Liability limited by a scheme approved under Professional Standards Legislation
Appendix A: Data sources
              The table below lists the secondary data sources referenced in the Report and used in the estimation of the economic
              contribution.

                Research                                                          Year of research   Assumption / Application
                Australian Bureau of Statistics — Household and Family                  2019         Household and family projections for Australia,
                Projections, Australia, Released: 14.03.2019                                         states and territories and capital cities in 2020

                Australian Bureau of Statistics — National, state and                   2019         Estimated resident population, by age
                territory population Dec 2020, Released: 17.06.21                                    and sex

                Australian Bureau of Statistics — Regional Statistics by                2021         Local Government Authority (LGA) populations in
                LGA 2020, Data extracted: 27.09.2021                                                 2020

                Australian Bureau of Statistics — Household and Family                  2019         Household and family projections (based on
                Projections, Australia, Released: 14.03.2019                                         different assumptions of living arrangements) for
                                                                                                     Australia, states and territories and capital cities
                                                                                                     in 2020

                Griffith University (Cities Research Institute),                        2019         Share of cycle infrastructure funding by LGA in
                Department of Transport and Main Roads) — Innovative                                 Queensland Transport and Roads Investment
                Cycling Infrastructure Funding Models and their potential                            Program 2018-2022
                in Queensland (Table 19)

                Australian Bicycle Council, National Cycling Strategy:                  2016         State & Territory Cycling Investment
                Implementation Report 2016                                                           2010–2016

                EY, The economic contribution of the global Motor Sport                 2021         Industry Comparison
                industry in 2019, Federation Internationale de                                       Australian motor sport industry economic
                l’Automobile (FIA)                                                                   contribution 2019

                EY, The economic contribution of Australia’s Live                       2020         Industry Comparison
                Entertainment Industry – How has COVID-19 impacted                                   Australian live entertainment industry economic
                the industry?                                                                        contribution 2020

                IER Consulting, Thoroughbred Racing Nationally, 2016–                   2018         Industry Comparison
                17                                                                                   Australian thoroughbred racing industry 2016–
                                                                                                     2017

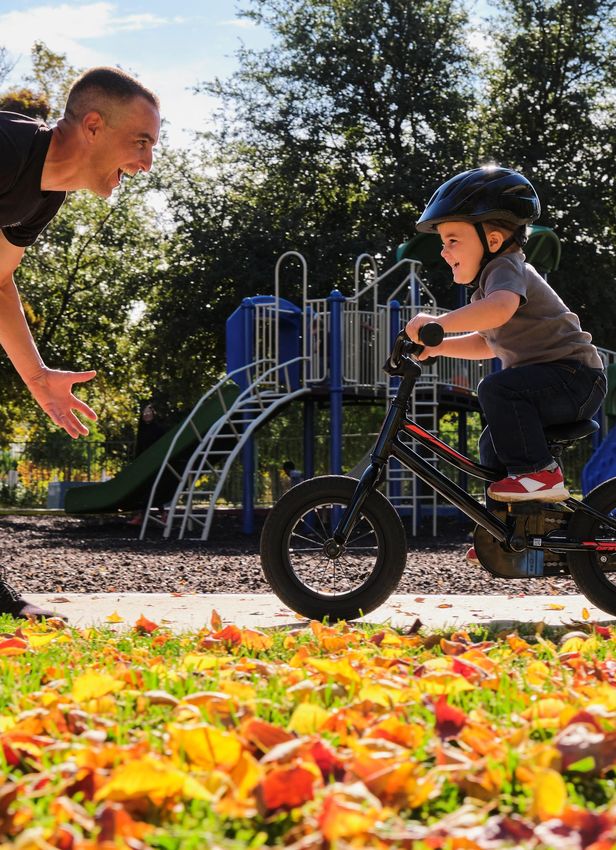
               The images shown throughout this Report were provided by We Ride Australia and this Study’s Corporate
               and Supporting Partners.

              13         The Australian Cycling Economy
A member firm of Ernst & Young Global Limited
Liability limited by a scheme approved under Professional Standards Legislation
EY | Building a better working world

                                                                                  EY exists to build a better working world, helping to
                                                                                  create long-term value for clients, people and
                                                                                  society and build trust in the capital markets.

                                                                                  Enabled by data and technology, diverse EY teams
                                                                                  in over 150 countries provide trust through
                                                                                  assurance and help clients grow, transform and
                                                                                  operate.

                                                                                  Working across assurance, consulting, law,
                                                                                  strategy, tax and transactions, EY teams ask better
                                                                                  questions to find new answers for the complex
                                                                                  issues facing our world today.

                                                                                  EY refers to the global organization, and may refer to
                                                                                  one or more, of the member firms of Ernst & Young
                                                                                  Global Limited, each of which is a separate legal
                                                                                  entity. Ernst & Young Global Limited, a UK company
                                                                                  limited by guarantee, does not provide services to
                                                                                  clients. Information about how EY collects and uses
                                                                                  personal data and a description of the rights
                                                                                  individuals have under data protection legislation are
                                                                                  available via ey.com/privacy. EY member firms do
                                                                                  not practice law where prohibited by local laws. For
                                                                                  more information about our organization, please visit
                                                                                  ey.com.

                                                                                  © 2021 EYGM Limited.
                                                                                  All Rights Reserved.

                                                                                  BMC Agency GA 153324779
                                                                                  ED None

                                                                                  This material has been prepared for general informational purposes
                                                                                  only and is not intended to be relied upon as accounting, tax or other
                                                                                  professional advice. Please refer to your advisors for specific advice.

                                                                                  ey.com

A member firm of Ernst & Young Global Limited
Liability limited by a scheme approved under Professional Standards Legislation
You can also read