30th Annual ROTH Conference March 2018 - Equisolve

Page created by Clinton Barnett
 
CONTINUE READING
30th Annual ROTH Conference March 2018 - Equisolve
30th Annual ROTH Conference
March 2018
30th Annual ROTH Conference March 2018 - Equisolve
Safe Harbor Statement
     This presentation includes "forward-looking statements"                   unpredictable levels of orders; the challenges inherent in
     within the meaning of the U.S. federal securities laws.                   technology development necessary to maintain the
     Statements in this news release that are not statements of                Company's competitive advantage such as adherence to
     historical fact and that concern future results from                      release schedules and the costs and time required for
     operations, financial position, economic conditions,                      finalization and gaining market acceptance of new
     product releases and any other statement that may be                      products; changes in economic conditions and market
     construed as a prediction of future performance or events,                demand; rapid and complex changes occurring in the
     including financial projections and growth in various                     mobile marketplace; pricing and other activities by
     products are forward-looking statements that speak only as                competitors; derivative and warrant liabilities on our
     of the date made and which involve known and unknown                      balance sheet will fluctuate as our stock price moves and
     risks, uncertainties and other factors which may, should one              will also produce changes in our income statement; these
     or more of these risks uncertainties or other factors                     fluctuations and changes might materially impact our
     materialize, cause actual results to differ materially from               reported GAAP financials in an adverse manner,
     those expressed or implied by such statements. These                      particularly if our stock price were to rise; technology
     factors and risks include risks associated with Ignite                    management risk as the Company needs to adapt to
     adoption among existing customers (including the impact                   complex specifications of different carriers and the
     of possible delays with major carrier and OEM partners in                 management of a complex technology platform given the
     the roll out for mobile phones deploying Ignite); actual                  Company's relatively limited resources; and other risks
     mobile device sales and sell-through where Ignite is                      including those described from time to time in Digital
     deployed is out of our control; new customer adoption and                 Turbine's filings on Forms 10-K and 10-Q with the
     time to revenue with new carrier and OEM partners is                      Securities and Exchange Commission (SEC), press releases
     subject to delays and factors out of our control; risks                   and other communications. You should not place undue
     associated with fluctuations in the number of Ignite slots                reliance on these forward-looking statements.         The
     across US carrier partners; the challenges, given the                     Company does not undertake to update forward-looking
     Company’s comparatively small size, to expand the                         statements, whether as a result of new information, future
     combined Company's global reach, accelerate growth and                    events or otherwise, except as required by law.
     create a scalable, low-capex business model that drives                   !
     EBITDA (as well as Adjusted EBITDA); varying and often

                                                            © 2017 Digital Turbine, Inc.                                                    2
30th Annual ROTH Conference March 2018 - Equisolve
Agenda

• Company Overview
• Market Dynamics
• Mobile Delivery Platform
• Operational & Financial Update
• Q&A

                                   © 2017 Digital Turbine, Inc.   3
30th Annual ROTH Conference March 2018 - Equisolve
Platform validated by market leaders

                              Operators                           OEMs
     Partnered with 30+                                                  Active campaigns in over
mobile operators & OEMs                                                  150+ countries
  Ignite has delivered over                                              Adding over
         1,100,000,000                                                   7,500,000
              app preloads                                               new devices per month

     Ignite is installed on                                               Pay performs more than
         130,000,000+                                                     8,000,000
                   devices                                                transactions per year

                                   © 2017 Digital Turbine, Inc.                                     4
30th Annual ROTH Conference March 2018 - Equisolve
© 2017 Digital Turbine, Inc.   5
30th Annual ROTH Conference March 2018 - Equisolve
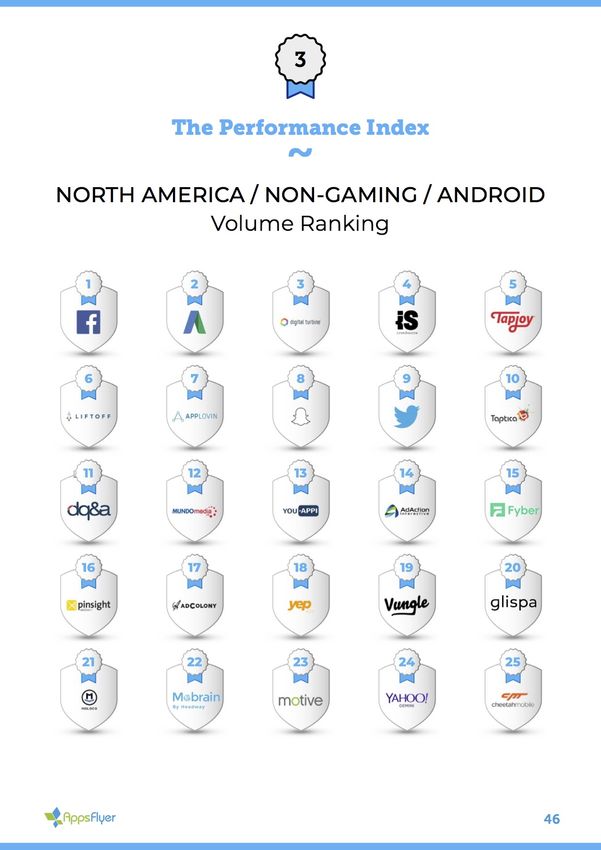
Industry Statistics Highlight the Growing Influence of Digital Turbine’s Platform

§ Digital Turbine currently ranks #3, trailing only Facebook and Google, in the
  AppsFlyer rankings for “fraud-free” non-gaming app installs on Android
  devices in North America.

§ With added reach internationally via partnerships with the likes of America
  Movil in Latin America and Reliance Jio in India, Digital Turbine moved up
  to #4 in AppsFlyer’s universal rankings for non-gaming app installs on all
  Android devices worldwide.

§ While improvement in non-gaming rankings reflects a concerted effort to
  recruit more brand advertisers, Digital Turbine also moved up in the rankings
  for gaming-related app installs, both globally and in North America, during
  2017.

 Source: AppsFlyer Performance Index, March 2018

                                                   © 2017 Digital Turbine, Inc.     6
30th Annual ROTH Conference March 2018 - Equisolve
Smartphones and Apps are the Technology Ecosystem of Our Time
Digital Turbine is uniquely positioned to capitalize on this growing market opportunity

 <        1.49 billion smartphones shipped globally in 2016, with Android’s overall market share reaching 85 percent
 <        The “App Economy” is here to stay – 80%+ of content consumed on smartphones is through apps
 <        Global mobile advertising market surpassed $100 billion in 2016, with the U.S. accounting for $46 billion
          q   Facebook is driving approximately $5.2 billion in quarterly mobile ad revenue, with a significant portion from app install ads

                                                      The Mobile Ad Spend Gap                                                                                                Global Mobile Advertising Market

45%                                                                                                                                             $300
              Time Spent            Ad Spend                                                                                                                    U.S.             Global
40%                                                                                                                                                                                                                         $247
                                                                                                                                                $250
                                                                    39%                                                                                                                                             $217
35%
                                                             36%
                                                                                 $46bn Market Opportunity in                                    $200                                                        $185
30%

                                                                                                                              ($ in billions)
                                                                                         the U.S.

25%                                                                                                                                                                                                $144
                                                                                                  25%                                           $150
20%                                                                              23%
                                                                           22%                                                                                                             $109
                                                                                                        16%

15%                                                                                                                                             $100
               16%                                                                                                                                                                $72

10%                                   13%                                                                                                                                                                                    $87
                                                                                                        12%                                                            $43                                           $78
                                              10%                                                                                               $50                                                          $69
5%                                                                                                                                                      $19                                         $57
                                                                                                                                                                                           $46
       4%                                                                                                                                                                         $32
                                                                                                                                                          $10
0%                                                                                                                                               $0                 $19
          Print                          Radio                     TV       Internet                Mobile                                             2013A      2014A          2015A    2016A    2017P    2018P   2019P   2020P
      Source: Strategy Analytics, Gartner, Statista, KPCB.
                                                                                                        © 2017 Digital Turbine, Inc.                                                                                                7
30th Annual ROTH Conference March 2018 - Equisolve
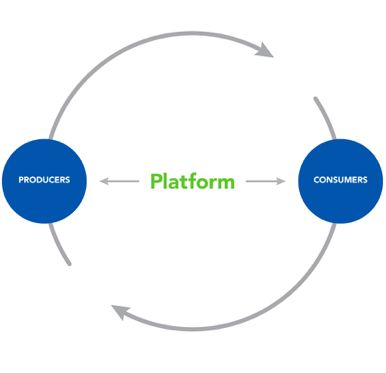
Evolving Market Dynamics
                      Rise of open market
      1
                      Increased number of customers buying off contract
                      and from non-carrier locations.

                      Cracks in duopoly
      2
                      Advertisers looking to diversify spend due to market
                      concentration concerns and fraud fears.

      3               Operators are diversifying their business model
                      Looking for ways to grow new revenue streams, leverage their assets and
                      connect content to customers.

                      Intense Operator and OEM competition
      4
                      OEMs are increasingly competing with carriers.
                      Carriers looking to take control of the customer experience.

      5               App discoverability increasingly difficult
                      The number of apps in stores, increased digital ad fraud, and the high level of
                      noise has made app discoverability increasingly difficult. Advertisers looking
                      for new ways to directly reach customers.
                      End customers seeking native, frictionless, ’on-demand’ experience.

8     © 2017 Digital Turbine, Inc.                                                                      8
30th Annual ROTH Conference March 2018 - Equisolve
Digital Turbine: Building                Connections and Facilitating Transactions
Solving problems and creating opportunities for all parties in today’s app economy

                          End Customers                                    Advertisers          Operators & OEMs

                   App discovery & app install
    Problem                                                Profitable user acquisition       Cut out of the app economy
                            friction

                   § Promote app discovery and foster   § Target and acquire new customers   § Improve profit margins by more
                     improved conversion rates              with unique home screen access     effectively monetizing valuable
                                                                                               “beachfront” app property
      The          § Enhance/personalize the overall    § Provide measurable tracking data
 Digital Turbine     end-user experience by                 to maximize campaign ROI         § Actively engage with subscribers
    Solution         fricitonlessly delivering more                                            to deliver a richer user experience
                     relevant content via proprietary                                          (no longer a “dumb pipe”)
                     data analytics engine

                                                        © 2017 Digital Turbine, Inc.                                                 9
Digital Turbine Mobile Delivery Platform
                                        Modular platform delivers comprehensive solutions tailored to customer need

              Monetization                                                                                     Operational Efficiency
grow revenue through DT’s one-stop                                                                             easily deliver and manage your owned
            campaign management
                                                                                                               and operated apps

           Pay Integration                                                                                     Insight
          Of carrier billing into app                                                                          improved customer insight
                                                                                                               and targeting

      Additional Screens                                                                                       Frictionless Installs
       IoT, TVs, Auto, Tablets, etc.                                                                           ‘Single-Tap’ app installs

                                                                        Media
                                                        one-stop campaign management

                                                             © 2017 Digital Turbine, Inc.                                                             10
Platform businesses drive more shareholder value

                              Number of Platform Companies

                                                                                              App        Ignite     Home
                                                                                            Producers              screens
                                                                                                        Platform

Source: applicoinc.com_2016
                          .

                                                             © 2017 Digital Turbine, Inc.                                    11
Product expansion + Device Growth = Scalable Revenue Growth
           Product Expansion

 Single-Tap
                                    Rev Per
 Open Market
 Folders / Notifications
                                    Device
                                                                               Accelerating Revenue Growth
 Revenue per Slot
 Silent

                                                            =
            # Devices on Platform
                                    # of
                                    Devices

  130+M

                                                                             New product launches + Device growth = Scalable Growth

                                              © 2017 Digital Turbine, Inc.                                                            12
Operational Update
Strong O&O Revenue Growth Amid Growing Advertiser Demand & Expanding Mobile Platform Opportunity
<   Total revenue reached a record of $38.0 million in fiscal Q3 (December) driven by “O&O” revenue growth of 93% Y/Y
     <   Ignite has now been installed on more than 130 million total devices to date; Ignite was installed on more than 23
         million devices in the December quarter alone
     <   Ignite has been successfully deployed on the Samsung S8 and Note 8 with key carriers, including Verizon,
         AT&T/Cricket, and America Movil
     <   “Same-store” bid rate and revenue-per-slot increases showcase strengthening demand for unique homescreen access

<   New platform initiatives are expanding the addressable market opportunity by generating additional sources of high-
    margin revenue while enhancing the end user experience
     <   ‘Single-Tap’ is now live with North American operators and a large social media platform; Single-Tap promotes higher
         conversion rates and enhances the end-user experience by enabling frictionless app installs
     <   Multiple new revenue streams on the platform yield a higher profit-per-device opportunity

<   Promising business development pipeline, as evidenced by recent partnership announcements and impending launches
     <   Recently announced agreement with Qualcomm designed to help foster incremental global opportunity with OEMs and
         unlocked devices
     <   Several high-profile launches, including T-Mobile and Tracfone, are expected to begin to contribute in fiscal 2019
                                                    © 2017 Digital Turbine, Inc.                                                13
Financial Update
    Positive Free Cash Flow* and Strengthened Balance Sheet

<    Strong O&O revenue growth and a strategically-realigned cost structure led to positive free cash flow* in the
     December quarter
       <   Non-GAAP gross profit* increased 96% Y/Y in fiscal Q3, while cash operating expenses* increased 23% Y/Y,
           demonstrating the inherent leverage in the platform business model
       <   Non-GAAP gross margin* increased to 27% in Q3 of fiscal 2018, up from 24% in Q3 of fiscal 2017, as a result of
           an evolving mix shift toward higher-margin O&O business
       <   Free cash flow* totaled $1.4 million for the December quarter

<    Cash & cash equivalents increased to $6.9 million at December quarter-end, up $1.0 million as compared to September
     quarter-end, despite the paydown of $0.6 million on the credit facility during the quarter
<    The notional value of convertible notes outstanding has been reduced via the conversion of approximately $10 million of
     convertible notes to date, thus further reducing leverage on the balance sheet
<    Guidance calls for continued positive cash flow generation in the current March quarter
       <   Adjusted EBITDA* and free cash flow* are expected to be positive in fiscal Q4 and for the full-year fiscal 2018

                                                      © 2017 Digital Turbine, Inc.                                             14
O&O Revenue Growth Being Driven by Proliferation of Ignite
Ignite has been successfully installed on more than 130 million devices to date and is currently being installed at a
rate of approximately 100 million new devices per year

                                            $70                                                                                               90

                                                                             Ignite Installed Devices                                         80
                                            $60
                                                                               Trailing 12-Months
                                                                                                                                              70

                                                                                                                                                   Total Ignite Devices (in millions)
                                            $50
                O&O Revenue (in millions)

                                                                                                                                              60

                                            $40                                                                 Total O&O Revenue             50
                                                                                                                Trailing 12-Months
                                            $30                                                                                               40

                                                                                                                                              30
                                            $20
                                                                                                                                              20
                                            $10
                                                                                                                                              10

                                            $0                                                                                                0
                                                  Mar-16   Jun-16   Sep-16       Dec-16              Mar-17     Jun-17   Sep-17      Dec-17

                                                                                 © 2017 Digital Turbine, Inc.                                                                           15
Evolving Mix Shift Toward Higher Margin O&O Revenue; Scalable Business Model
 O&O revenue of $22.7 million in fiscal Q3 (December) increased more than 90% Y/Y and now represents 60% of
 total revenue, helping to drive expansion in gross profit and cash flow profitability
                                                                                                                                                                    Adjusted EBITDA*
                                                                         $12m                                                   $2m
$40m                                                                                                                                                    $2m

$35m                                                                     $10m                                                   $1m
                                                                                                                                                        $1m
$30m
                                                                         $8m                                                    $m

                                                 Non-GAAP Gross Profit
                                                                                                                                                         $m

                                                                                                                                      Adjusted EBITDA
$25m

$20m                                                                     $6m                                                   -$1m
                                                                                                                                                        -$1m

$15m
                                                                         $4m                                                   -$2m                     -$2m
$10m
                                                                         $2m                                                   -$3m                     -$3m
$5m

 $m                                                                       $m                                                   -$4m                     -$4m
       1Q17 2Q17 3Q17 4Q17 1Q18 2Q18 3Q18                                       1Q17 2Q17 3Q17 4Q17 1Q18 2Q18 3Q18                                         2Q17   3Q17   4Q17   1Q18   2Q18   3Q18
   O&O Revenue   Content Revenue   A&P Revenue                                   Non-GAAP Gross Profit*          Adjusted EBITDA*

                                                                                  © 2017 Digital Turbine, Inc.                                                                                       16
Management Team and Board of Directors
                           Management Team                                                                             Board of Directors

 <   Bill Stone, CEO                                                                           <   Rob Deutschman
                                                                                                    q Chairman of the Board
      q Bill was previously SVP at QUALCOMM Inc. He has served as
                                                                                                    q Managing Director at Cappello Capital
           CEO/President of multiple startups and has extensive
                                                                                                    q Former Managing Director at Saybrook Capital
           experience in carrier relations, mobile, content, marketing and
           distribution, having held executive positions at several carriers                   <   Mohan Gyani
           such as Verizon, Vodafone, and AirTouch.                                                q Former President and CEO of AT&T Wireless Mobility Services
                                                                                                   q Currently on board of Ruckus Wireless and Idea Cellular
                                                                                                   q Prior boards: MTS, Keynote Systems, Safeway
 <   Barrett Garrison, EVP & CFO
      q Barrett served as the Chief Financial Officer of Competitor                            <   Jeff Karish
         Group, Inc., a media and event company in the active                                       q President of Windsor Media
         lifestyle industry,; the Chief Financial Officer of Netspend, a                            q Former Head of Media Strategy & Corporate Development at

         division of TSYS Company, a leading financial technology                                       Yahoo
         company                                                                               <   Chris Rogers
                                                                                                    q Partner at Lumia Capital
 <   Daphna Steinmetz, CTO                                                                          q Former Co-Founder of Nextel Communications and SVP at Sprint

      q Daphna was previously CTO of ThetaRay, VP Strategy and                                          Nextel
        Innovation at Amdocs, Chief Innovation Officer at Comverse,                            <   Paul Schaeffer
        and on the board of Amobee (sold to Singtel).                                               q Co-Founder, Vice Chairman & COO of Mandalay Entertainment
                                                                                                       Group
 <   Nick Montes, EVP Global Business Development                                                   q Former EVP of Sony Pictures

      q Nick served as President of Logia Mobile USA, CEO of Viva
                                                                                               <   Bill Stone, CEO
         Vision, and spent 10 years in senior level sales and marketing
         positions with Verizon Wireless.

 <   Jon Mooney, Head of Asia Pacific
      q Jon was founder and COO of MIA prior to its acquisition by
         Digital Turbine in 2013. He worked previously at T-Mobile and
         Telstra in Europe and Asia Pacific.

                                                                © 2017 Digital Turbine, Inc.                                                                         17
Investment Highlights
                                                                                  Investment Highlights

                Highly-scalable platform business model uniquely positioned in high growth, $100 billion mobile advertising market

      30+ partnerships and long-term distribution deals with top-tier global carriers including Verizon, AT&T, America Movil and Reliance Jio

           Powered >675 million app preloads for thousands of advertisers and access to more than one billion mobile subscribers globally

            >90% revenue growth Y/Y in the O&O business during the just-reported FQ3 led to positive free cash flow* of $1.4 million

               Increasingly diverse revenue mix rapidly shifting to higher margin revenue streams amid expanding market opportunity

                           Several impending high-profile partner launches and promising business development pipeline

 Experienced management team and board with a track record of outstanding business growth at various carriers and technology companies including
                                                  AT&T, Sprint, Nextel, Yahoo, and Sony

                                                         © 2017 Digital Turbine, Inc.                                                              18
Summary Income Statement
                                                                                      Fiscal Year Ending March 31

        ($ in millions, except for per share data)   F3Q17                    F4Q17             F1Q18         F2Q18     F3Q18

        Total Net Revenues                           $22.3                     $22.4            $26.1         $27.9     $38.0
          YoY Growth %                                -7%                       -3%              9%           22%       71%

        Non-GAAP Gross Profit*                        $5.2                      $6.2             $7.2          $8.0     $10.3
          Non-GAAP Gross Margin*                      24%                       28%              28%           29%      27%

        Non-GAAP Adjusted EBITDA*                    ($2.1)                    ($0.7)            $0.2          $0.4     $1.2

        GAAP Net Income (Loss)                       ($2.6)                    ($6.9)           ($4.2)        ($6.5)    ($3.8)
        Non-GAAP Net Income (Loss)*                  ($3.4)                                     ($0.9)        ($0.6)     $0.5

        GAAP EPS                                     ($0.04)                  ($0.10)           ($0.06)       ($0.10)   ($0.05)
        Non-GAAP EPS*                                ($0.05)                                    ($0.01)       ($0.01)    $0.01

        Common Shares Outstanding                     66.6                       66.6            66.6          66.8      72.1

                                                       © 2017 Digital Turbine, Inc.                                               19
Balance Sheet   ($ in 000's)                                                    31-Dec-17

                ASSETS
                Current assets
                    Cash and cash equivalents                                        6,883
                    Restricted cash                                                    331
                    Accounts receivable, net of allowances                          32,494
                    Deposits                                                           155
                    Prepaid expenses and other current assets                          551
                       Total current assets                                         40,414
                Property and equipment, net                                          2,693
                Deferred tax assets                                                    593
                Intangible assets, net                                               2,844
                Goodwill                                                            76,621
                TOTAL ASSETS                                                       123,165

                LIABILITIES AND STOCKHOLDERS' EQUITY
                Current liabilities
                   Accounts payable                                                 28,404
                   Accrued license fees and revenue share                           12,857
                   Accrued compensation                                              3,456
                   Short-term debt, net of debt issuance costs & discounts           1,653
                   Other current liabilities                                         1,844
                        Total current liabilities                                   48,214
                Convertible notes, net of debt issuance costs                        5,751
                Convertible note embedded derivative liability                       5,896
                Warrant liability                                                    3,602
                Other non-current liabilities                                           51
                Total liabilities                                                   63,514

                Stockholders' equity                                                59,651

                TOTAL LIABILITIES AND STOCKHOLDERS' EQUITY                         123,165

                                                 © 2017 Digital Turbine, Inc.                20
*Appendix: Non-GAAP Measures of Performance

<   Non-GAAP gross profit and net income are defined as GAAP gross profit and net income adjusted to exclude the
    effect of stock-based compensation, amortization of intangibles, and changes in the fair value of derivatives and
    warrants related to the September 2016 convertible notes offering.

<   Non-GAAP Adjusted EBITDA is calculated as GAAP net income (loss) excluding interest expense, FX gains (losses),
    income taxes, depreciation and amortization, stock-based compensation, the change in fair value of derivatives, other
    income/(expense), impairment of intangible assets, loss on disposal of fixed assets and loss on extinguishment of debt.

<   Free Cash Flow is calculated as GAAP cash flow from operations less capital expenditures.

<   Cash operating expenses are defined as GAAP operating expenses adjusted to exclude stock-based compensation and
    depreciation.

                                                    © 2017 Digital Turbine, Inc.                                              21
You can also read