3Q 2020 Results Presentation - 2 November 2020 - Investor Relations
←
→
Page content transcription
If your browser does not render page correctly, please read the page content below
3Q 2020 Results
 Presentation
  2 November 2020
Disclaimer
             Certain statements in this presentation concerning our future growth prospects are forward-looking statements, which involve a
             number of risks and uncertainties that could cause actual results to differ materially from those in such forward-looking
             statements. These forward-looking statements reflect our current views with respect to future events and financial performance
             and are subject to certain risks and uncertainties, which could cause actual results to differ materially from historical results or
             those anticipated.

             The risks and uncertainties relating to these statements include, but are not limited to, risks and uncertainties regarding
             fluctuations in earnings, our ability to manage growth, intense competition in the Indonesian retail industry including those
             factors which may affect our ability to attract and retain suitable tenants, our ability to manage our operations, reduced demand
             for retail spaces, our ability to successfully complete and integrate potential acquisitions, liability for damages on our property
             portfolios, the success of the retail malls and retail spaces we currently own, withdrawal of tax incentives, political instability, and
             legal restrictions on raising capital or acquiring real property in Indonesia. In addition to the foregoing factors, a description of
             certain other risks and uncertainties which could cause actual results to differ materially can be found in the section captioned
             "Risk Factors" in our preliminary prospectus lodged with the Monetary Authority of Singapore on 19 October 2007. Although we
             believe the expectations reflected in such forward-looking statements are based upon reasonable assumptions, we can give no
             assurance that our expectations will be attained.

             You are cautioned not to place undue reliance on these forward-looking statements, which are based on the current view of
             management on future events. We undertake no obligation to publicly update or revise any forward looking statements, whether
             as a result of new information, future events or otherwise. The value of units in LMIRT (“Units”) and the income derived from
             them may fall as well as rise. The Units are not obligations of, deposits in, or guaranteed by, LMIRT Management Ltd, as
             manager of LMIR Trust (the “Manager”) or any of its affiliates. An investment in Units is subject to investment risks, including the
             possible loss of the principal amount invested.

             Investors have no right to request the Manager to redeem their Units while the Units are listed. It is intended that Unitholders
             may only deal in their Units through trading on Singapore Exchange Securities Trading Limited. Listing of the Units on the SGX-
             ST does not guarantee a liquid market for the Units.

             This document is for information only and does not constitute an invitation or offer to acquire, purchase or subscribe for the
             Units. The past performance of LMIRT is not necessarily indicative of the future performance of LMIRT.

                                                                                                                                                        2
Financial Highlights
Key Highlights
                                                                                                         QoQ                              YoY
     S$’000                                                   3Q 2020              2Q 2020                                    3Q 2019
                                                                                                       % Change                         % Change
     Gross Rental Income (GRI)                                 15,272                12,627                 20.9               39,308    (61.1)

     Total Gross Revenue1                                      28,872                27,383                 5.4                69,248    (58.3)

     Net Property Income                                       13,146                12,823                 2.5                44,122    (70.2)
     Amount Available for Distribution                             -                     -                    -                17,996     n.m.
     Distribution to Unitholders                                2,049                3,137                 (34.7)              16,196    (87.3)
     DPU (Singapore cents)                                       0.07                 0.11                 (36.4)                0.56    (87.5)

      ❑   GRI recovered 20.9% QoQ as malls reopen for operations during the quarter although at shorter 8-hour operating
          hours and at a regulated 50% capacity, partially offset by a S$1.8 million fall due to the divestments of Pejaten
          Village and Binjai Supermall. Rental and service charge billings aligned to the shorter hours and continue to be
          waived for those tenants who remain closed due to regulation
      ❑   Net property income rose marginally 2.5% QoQ impacted by the lowered revenue from shorter operating hours and
          rental reliefs offered to tenants. After taking into account fixed and financing costs, LMIR Trust recorded nil
          distributable income for 3Q 2020
      ❑   Distributions of S$2.0 million to Unitholders, along with the S$4.9 million paid to perpetual security holders on 24
          September, after taking into considerations restrictions imposed under terms and conditions of the US$250.0 million
          7.25% Guaranteed Senior Notes due 2024

1. Total Gross Revenue includes Gross Rental Income, Carpark Income, Service Charge and Utilities Recovery and Other Rental Income                 4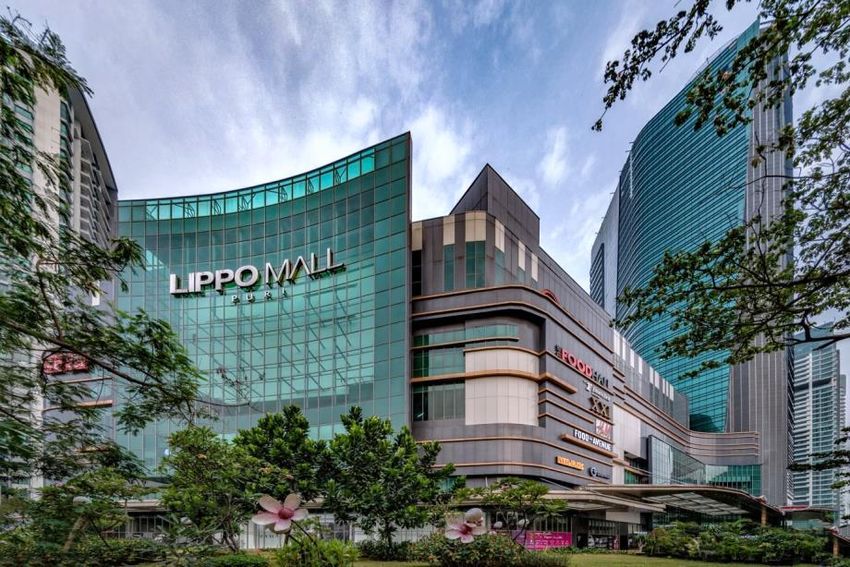
Distribution Restrictions

 ❑   Under the US$250.0 million 7.25% Guarantee Senior Notes due in 2024, LMIR Trust is restricted to
     make any distributions (in the form of Perpetual Coupons or Dividends) unless

      ✓Aggregate leverage is below the MAS gearing limit as prescribed under the Property Funds
          Appendix (currently 50%); and

      ×   Aggregate of distributable income less any distributions made to Perpetual securities holders
          and Unitholders since Note issuance, is greater than zero

           ➢   As at 30 Sept 2020, aggregate of distributable income = 0

 ❑   If such aggregate number is zero, LMIR Trust is only permitted to make distributions of up to US$5.0
     million for the remaining life of the US$ Notes

      ➢   S$4.9 mio paid to Perpetual Security Holders on 24 Sept 2020

      ➢   S$2.0 mio declared as dividends to Unitholders for 3Q2020

                                                                                                            5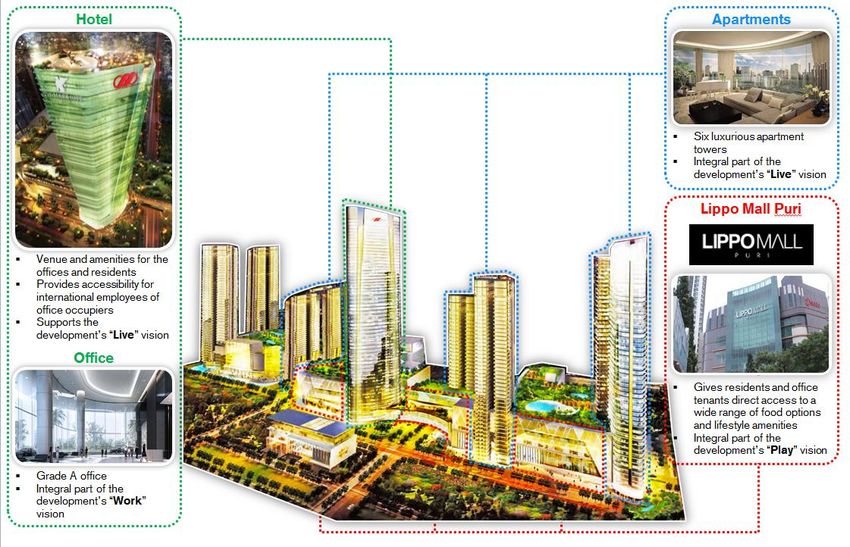
Distribution Restrictions

 ❑   Any further distributions, beyond this US$5.0 million limit, to either Perpetual securities
     holders or Unitholders is subject to

      ➢   Aggregate of distributable income less any distributions made to Perpetual securities
          holders and Unitholders since Note issuance, is greater than zero

      ➢   US$ noteholders' consent; or

      ➢   New equity injection, such as the proposed rights issuance in conjunction with the
          proposed Lippo Mall Puri acquisition transaction.

 ❑   Such restrictions on distributions is a typical feature in high yield US$ Bond issuance and
     is not specific or unique to LMIR Trust

                                                                                                   6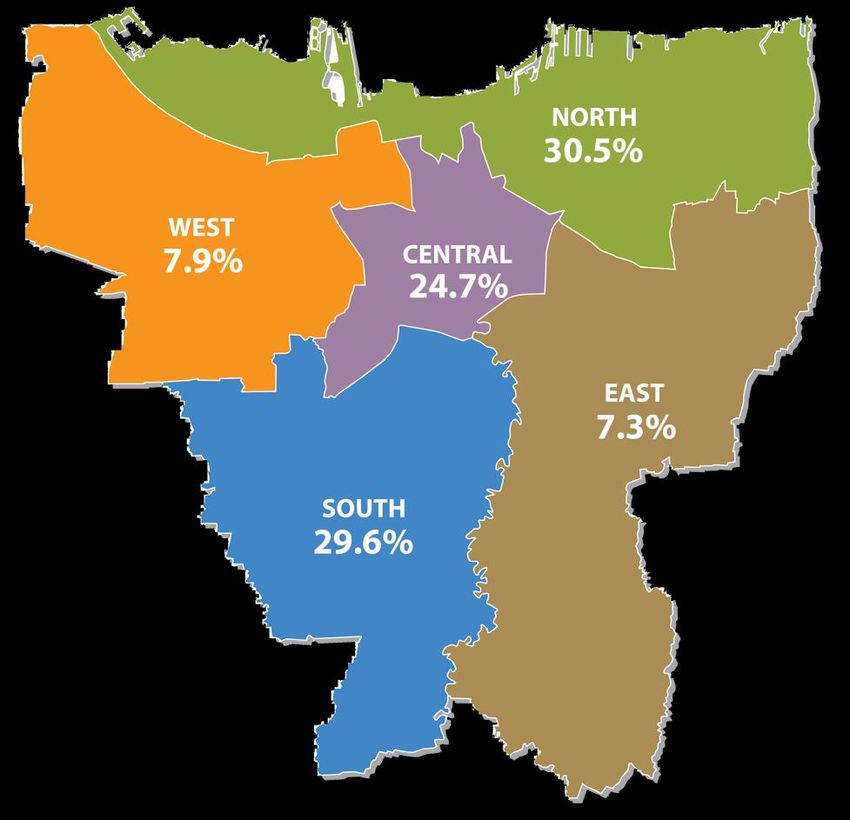
Key Financial Performance
                                                                        S$’000               %                 Rp’million
                                                                                                                                    % Change
                                                             3Q 2020         2Q 2020       Change   3Q 2020             2Q 2020

           Gross Rental Income                                15,272             12,627     20.9    164,029             141,559       15.9
           Carpark Income                                      971                471       n.m.     10,416                 5,571     87.0
           Other Rental Income                                 513                360       42.5     5,462                  3,920     39.3
           Service Charge and Utilities Recovery              12,116             13,925    (13.0)   130,146             152,128      (14.4)
           Total Gross Revenue                                28,872             27,383     5.4     310,053             303,178       2.3

           Property Management Fee                             (549)             (1,020)    46.2     (5,975)            (11,146)      46.4
           Property Operating and Maintenance
                                                             (13,283)        (10,999)      (20.8)   (141,893)          (120,372)     (17.9)
           Expenses
           Other Property Operating Expenses                  (1,894)            (2,541)    25.5    (20,271)            (27,209)      25.5
           Total Property Operating Expenses                 (15,726)        (14,560)       (8.0)   (168,139)          (158,727)      (5.9)

           Net Property Income                                13,146             12,823     2.5     141,914             144,451       (1.8)
           Amount Available for Distribution                       -                -       n.m.
           Distribution to Unitholders                        2,049              3,137     (34.7)
           Distribution Per Unit (cents)1                      0.07               0.11     (36.4)

1. Based on 2.927 billion units in issue as at 30 September 2020                                                                               7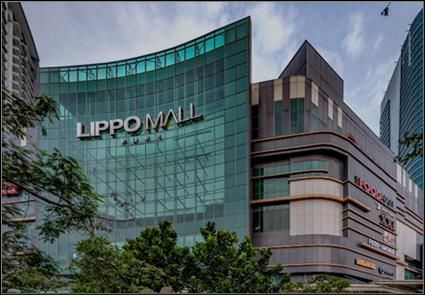
Balance                       S$’million                                            30 September 2020                31 December 2019

Sheet                         Non-Current Assets1
                              Cash and Cash Equivalents
                                                                                            1,458.2
                                                                                             123.1
                                                                                                                           1,712.8
                                                                                                                             109.7
                              Other Current Assets2                                           57.4                           190.5
                              Total Debt                                                     696.2                           721.7
                              Other Liabilities                                              171.3                           215.4
                              Total Equity3                                                  771.2                         1,075.9
                              Gearing Ratio                                                  42.5%                          35.9%
                              Total Units In Issue (million)                                2,926.8                        2,894.9
                              Net Asset Value per unit (in cents)4                           17.57                           28.20

 1.   Included in the Non-Current Assets are the Investment properties of S$1,446.7 million as at 30 September 2020 and S$1,696.8 million as at 31 December
      2019. The carrying values of the properties are stated based on the independent valuation as at 31 July 2020, which was carried out because the
      outbreak of the Covid-19 pandemic has brought about market uncertainties. All respective valuations and property enhancements figures are recorded in
      the financial statements in IDR and translated into SGD using the respective exchange rate as at the end of each period

 2.   As Pejaten Village and Binjai Supermall were divested on 30 July 2020 and 3 August 2020 respectively, Other Current Assets, which used to include these
      two properties held for divestment has dipped from S$190.5 million on 31 December 2019 to S$57.4 million on 30 September 2020

 3.   Total equity is represented by Unitholder’s funds of S$514.2 million and Perpetual Securities of S$257.0 million as at 30 September 2020 and S$816.3
      million and Perpetual Securities of S$259.6 million as at 31 December 2019

 4.   Net Asset Value per unit is calculated as Unitholder’s funds over the units issued at the end of the period

                                                                                                                                                                8
Distribution Details

                 Period: 1 July 2020 to 30 September 2020

                 Total DPU                      0.07 cents

                 - Tax-Exempt                       -

                  - Capital                     0.07 cents

                Record Date                 10 November 2020

               Distribution Payment Date: 26 November 2020

                                                               9
Portfolio Performance
Steady Occupancy Rate

      94.3%           93.7%        92.9%
                                               91.5%           90.9%
                                                                               88.2%                       Portfolio Average
              85.4%                                                                            85.5%
                           84.8%
                                           83.2%
                                                                       80.8%                               Industry Average
                                                       81.1%                           80.8%
                                                                                                   79.5%   (Cushman & Wakefield)

        FY 2016        FY 2017      FY 2018        FY 2019      1Q 2020         2Q 2020         3Q 2020

  ❑   All 21 malls and seven retail spaces having resumed operations as of 3 July 2020
  ❑   During the imposition of PSBB in Jakarta in September/October, seven malls in Jakarta remained
      operational with unchanged visitor capacity of 50%. Entertainment centres and fitness centres remained
      closed while cafes and restaurants were not allowed dine-in services and can only offer delivery or take-
      away

                                                                                                                                   11
Lease Expiry and Renewals
Long Lease Profile
35.5%
• Weighted Average Lease Expiry (by NLA) as
at 30 September 2020: 3.4 years
• Balanced mix of long-term anchor leases and
shorter-term leases for non-anchor tenants
13.6% provide both stability and growth potential
10.7% 9.4% 10.0%
• Average rental reversion YTD Sep: 4.4%
2020 2021 2022 2023 >2024
Lease expiry as at
FY2020* FY2021 FY2022 FY2023 >FY2024
30 September 2020
Number of unit lots expiring 337 888 751 407 1,274
Leased area expiring (sqm) 89,827 78,585 114,230 83,622 298,031
Expiries as % of total NLA
10.7 9.4 13.6 10.0 35.5
as at 30 September 2020
Committed Renewal in 2020
Approximately 52.9% of expired leases or due to expire in 2020 has renewed / committed to renew their leases
* Figures are for leases expiring between October 2020 to December 2020. Leased area are as of 30 September 2020. 12Visitor Traffic 2020
Recovered to approximately 50% from pre-Covid days, but slight dip in September due to PSBB that
prohibited dining-in
Monthly Visitor
YTD September 2020
Traffic Declined due 56.5 mil visitors
to Covid-19
Weekly Visitor Traffic 1,600
Thousands
(6 September 2020 to
1,400
1,410
1,200 1,336 1,299
25 Oct 2020) 1,000 1,140 1,142
1,236
1,169 1,216
Visitor Traffic has 800
31 August to
600
Dipped mid-Sep 400
25 October 2020
onwards due to PSBB 200
9.9 mil visitors
which prohibited 0
Week 1 Week 2 Week 3 Week 4 Week 5 Week 6 Week 7 Week 8
dining-in (ending (ending (ending (ending (ending (ending (ending (ending
6 Sep) 13 Sep) 20 Sep) 27 Sep) 4 Oct) 11 Oct) 18 Oct) 25 Oct)
While the PSBB has impacted visitor traffic, it has since stabilised and since 12 October, dining-in was
allowed at 50% capacity 13Diversified Quality Tenants
Trade Sector Breakdown by Trade Sector Breakdown by
Gross Revenue* Net Lettable Area
7%
15%
Casual Leasing
30%
20% F&B/Food Court
Fashion 36%
Parking
3Q 2020 Department Store 3Q 2020 18%
Supermarket/Hypermarket
Leisure & Entertainment
4%
All Other Sectors
18%
9% 12%
9%
8% 4%
10%
* Exclude other rental income and utilities recovery 14Diversified Quality Tenants
Contribution of Tenants to Gross Revenue
– No single party contributes more than 10% to gross revenue
4.4%
14.6% 5.5%
4.3%
0.7%
2.6%
• As at 30 September 2020, revenue from 1.0%
related-party tenants, including Lippo 1.5%
Karawaci, Matahari, Hypermart, Cinepolis,
etc accounted for 20.0% but none
accounted for more than 10%
• Non-related party tenants comprising
international and local brands accounted
for 65.4%
65.4%
LK Master Leases Matahari Hypermart
Sky Parking Cinepolis Timezone
Other Related-Party Tenants Non-Related Party Tenants Utilities Income
15Debt Maturity Profile
Interest Cover Fixed Rate Weighted Ave. All-in cost All-in cost
Total Debt Gearing
(Excluding Perpetual) Debt Ratio Maturity of Debt (Excluding Perpetual) (Including Perpetual)
S$696.2 m 42.5% 2.6 times 95.1% 2.6 years 5.48% 5.85%
As at 30 September 2020
All existing debt facilities are on
unsecured basis
102.7
342.2
123.1 175.0
S$’m 44.0 67.5 67.5
Cash Balances / 2020 2021 2022 2023 2024
Committed Line
Revolving Credit Term Loans Bonds
Notes: Notes:
1. Increase in cash and cash equivalents as at 30 1. S$44.0 million 3.88% revolving credit facilities
September 2020 due to net proceeds from 2. S$175.0 million 3.15% + SOR term loan due 21 August 2021
divestment of Pejaten Village and Binjai 3. S$67.5 million 3.05% + SOR term loan due 9 November 2022
Supermall in July and August respectively 4. S$67.5 million 3.25% + SOR term loan due 9 November 2023
2. Secured a US$75.0 million (S$102.7 million) 5. US$250.0 million 7.25% bond, swapped to SGD at 6.71% due 19 June 2024
committed line that will be used for repayment of
the S$175.0 million term loan due in 2021 Perpetual: S$140.0 million 7.0% Subordinated Perpetual Securities was issued on 27 September 2016
Perpetual: S$120.0 million 6.6% Subordinated Perpetual Securities was issued on 19 June 2017
16Looking Ahead
Covid-19 Impact Updates

 ❑   As of 3 July, all our retail malls and spaces have resumed operations at shorter 8-hour operations
     rather than 12 hours and malls in core central Jakarta are limited to visitor capacity of 50%

 ❑   With shorter operating hours, rental and service charges are at a pro-rated basis (effectively 33%
     discount) and those sectors that remain closed due to local regulations, continue to have their rental
     waived

 ❑   Additional rental reliefs (e.g. conversion to GTO based rental or additional fixed % discounts) given
     to selected key tenants to support their business recovery

 ❑   During the re-imposition of the PSBB from 14 September till 12 October, the Trust’s seven retail
     malls in Jakarta remained operational with an unchanged visitor capacity limit of 50%. Café and
     restaurants were not allowed to offer dine-in services during this period except for delivery and take-
     away services. Additional rental relief measures were granted to tenants in these affected malls

 ❑   Sponsor continues to demonstrate support for LMIR Trust with fulfillment of its master lease
     obligations in Kuta and Jogya. No discounts have been offered on these leases

                                                                                                               18
Covid-19 Impact Updates
❑ Shopper traffic within Greater Jakarta, has recovered to over 40% from pre-Covid days (slightly
under the 50% capacity limits), while some malls outside Greater Jakarta have recovered to 60-70%
❑ Vehicle traffic continues to recover but remains around 45% of the corresponding period in 3Q 2019
❑ Manager expects retail malls to continue to be subject to shorter operating hours, capacity caps and
ad-hoc restrictions at least until the second quarter of 2021, with corresponding rental reliefs granted
to tenants during this period
❑ In end July 2020, the Trust engaged independent external valuers to perform a desktop valuation of
the portfolio’s investment properties. Current portfolio asset valuation of S$1,446.7 million and
resultant gearing ratio of 42.5% reflects negative impact of Covid-19 on near term rental cashflows
as well as a weakened Rupiah currency
❑ Lippo Mall Puri acquisition would provide a steady stream of income during the current Covid-19
downturn while the rights issue would unlock the distribution restrictions currently imposed by the
US-dollar Notes
19Proposed Acquisition of Lippo Mall Puri
Why are we engaging in this transaction?
Part of strategic plan since early 2019 to improve our portfolio mix and strengthen ourselves for long-term growth
Recycle capital to optimise portfolio by acquiring assets of larger scale, and divesting smaller, mature assets
Proactive portfolio …for greater
management… value creation
Pejaten Village Binjai Supermall Lippo Mall Puri
NLA (sqm) 42,210 23,432 NLA (sqm) 122,862
Completion 2008 2007 Completion 2014
Tenants 152 111 Tenants 333 20What is so great about Lippo Mall Puri?
✓ Located in West Jakarta, an area with good supply-demand dynamics
✓ Only mall in the St Moritz Jakarta Integrated Development, the largest mixed-use property in West Jakarta
✓ Approximately 1.5 million residents and 650,000 workers within a 5km radius
✓ Still in its growth phase Year of Completion July 2014
- good leasing-up opportunities
Valuer With Vendor W/out Vendor
- potential positive rental reversion Support Support
✓ Comes with Vendor Support Cushman1 S$354.9m S$337.0m
Valuations (Rp3,762.0b) (Rp 3,572.0b)
till end-2024
Colliers2 S$374.5 S$347.2m
(Rp3,970.0b) (Rp3,680.0b)
Average S$364.7 S$342.1
(Rp3,866.0b) (Rp3,626.0b)
Gross Floor Area (“GFA”) / 175,146 m2 /
Net Lettable Area (“NLA”) 116,014 m2 (122,862 m2 with P2 Space)
Occupancy Rate / 91.9% (89.9% with P2 Space) @ 30 June 2020 /
No. of Tenants 333
Weighted Average Lease
3.4 years
Expiry (“WALE”) by NLA
1 Cushman & Wakefield VHS Pte Ltd 21
2 Colliers International Consultancy & Valuation (Singapore) Pte LtdWhat is so great about Lippo Mall Puri?
An integrated ecosystem designed for living, working and playing
✓ Part of self-contained “live, work and play”
ecosystem” in St. Moritz, Jakarta
✓ Wide range of F&B options, lifestyle
amenities and entertainment for residents,
office tenants and future hotel guests
✓ More resilient to Covid-19 pandemic impact
due to residential component and close
proximity of other residential areas
✓ Attracted daily average of 5,524 visitors during
the Covid-19 closure from 27 March to 14 June
• LMIR Trust’s other malls: 2,824 daily
average visitors
22What is so great about Lippo Mall Puri?
Excellent transportation connectivity
A4 Paper Guide Line Only mixed-use development in West Jakarta
Tol Airport
Kapuk
Pluit Ancol Well-connected to three Potential transportation hub
Soekarno – Hatta
roads, including two major for the area
JORR W 1
International
Airport
~10
minutes toll roads, providing excellent
access to and from: Set to benefit from Indonesia
Tol Tangerang Tol Kebon Jeruk
Tomang
✓ Soekarno-Hatta government’s ongoing Jakarta
Lippo
Karawaci
Alam
Sutra Sudirman International Airport infrastructure programme
✓ Jakarta CBD
JORR W 2 (Target 2013)
Semanggi
~15
✓ other parts of Jakarta,
minutes
Bintaro Tol Jagorawi
Gatot Subroto
Pondok
Tangerang and Bekasi
Indah
~10
minutes Kemang ✓ other residential
Tol T.B Simatupang
developments in the
A4 Paper Guide Line
surrounding areas
23Why acquire Lippo Mall Puri now?
Favourable supply dynamics in West Jakarta
NLA sq m Vacancy
160,000 16.0%
Completion of Lippo
Jakarta Retail Supply Pipeline (2020-2022)
140,000 14.0%
Mall Puri (116,014 m2)
120,000
12.0%
100,000 30.5%
9.6% 10.0%
80,000 (H1 2020)
8.0% 7.9%
60,000 24.7%
6.0%
40,000
4.0%
20,000 7.3%
0 2.0%
29.6%
-20,000 0.0%
2013 2014 2015 2016 2017 2018 2019 2020F 2021F
Net Supply (LHS) Net Demand (LHS)
Well-managed malls in West Jakarta expected to hold up relatively well
✓ Healthy take-up of retail space with no injection of new supply in 1H2020
✓ Retail space per capita of 0.23 sq m in 1H2020, one of the lowest in Jakarta
(cf. 0.53 sq m in South Jakarta and 0.51 sq m in Central Jakarta)
24Why acquire Lippo Mall Puri now?
Valuation (SGD m)
374.5 ✓ Valuations, and the Purchase Consideration, have been
364.7
354.9 -9.47% reduced (compared to the announcement dated 12 March
2019) taking into account the impact of COVID-19
337.0
347.2 342.1 ✓ Purchase Consideration of approx. S$330.2 million
330.2
represents a 9.47% discount to the average of the two
Independent Valuations (with Vendor Support)
Purchase By Cushman By Colliers Average of the
Consideration two
Without Vendor Support With Vendor Support
NPI Yield
9.71%
+0.06 ppt
9.66%1
✓ NPI yield would improve to 9.66% post-Acquisition 9.65% +0.01 ppt
Existing Portfolio Lippo Mall Puri Post-Acquisition
1 Based on Lippo Mall Puri’s NPI for FY2019
25Why acquire Lippo Mall Puri now?
Price of the asset likely to increase in tandem with
improvement in operating indicators such as
Indonesia: Real GDP Growth,
rental, occupancy and footfall increase
Unemployment and Inflation
According to independent market research from
Savills, Indonesia is poised for recovery in the
mid-term:
i. strong potency for rebound on basis of well-laid
socio-economic foundations
ii. gradual economic recovery and growth optimism
iii. resilient retail market and stable retail rent
outlook in Jakarta
iv. positive rental reversions in the market
v. leasing up opportunities
Source: Focus Economics, Savills Research & Consultancy, August 2020
Delaying the acquisition would be ideal,
but it is unrealistic
26Why acquire Lippo Mall Puri now?
To protect ourselves in the event of further deterioration in sentiments, we have signed a Vendor
Support Agreement
✓ Vendor is committed to lease certain vacant leasable space
✓ Guaranteed NPI of Rp. 340.0 billion per annum from completion till 31 December 2024
✓ Provides additional stability and downside protection as Lippo Mall Puri continues to mature
✓ Mitigates short-term uncertainties arising from the pandemic by providing stable income
✓ Aligns Lippo Mall Puri’s income with that of comparable retail malls in West Jakarta during the
Vendor Support Period
Both Independent Valuers are of the view that the estimated NPI will be achievable by
the underlying revenue after the expiry of the Vendor Support Period
27How is the acquisition in our interest?
Significant growth in AUM and NLA
Assets Under Management1 Net Lettable Area2
(IDR bn) (sq m)
▲13.57%
▲18.57%
22,352
1,028,429
905,567
18,852
Pre-Acquisition Post-Acquisition Pre-Acquisition Post-Acquisition
1 Based on the existing portfolio valuation as at 31 December 2019 and the Purchase Consideration
2 Based on the existing portfolio NLA as at 31 December 2019 and the NLA of Lippo Puri Mall (including post restoration of P2 Space)
28How is the acquisition in our interest?
Acquisition of Lippo Mall Puri, and recent
divestment of Pejaten Village and Binjai Supermall,
are in line with LMIR Trust’s long-term strategy to
recycle capital and continuously improve the
portfolio mix
As LMIR Trust’s flagship asset, the Property will:
✓ enhance positioning and strengthen stability of LMIR
Trust
✓ improve its portfolio mix towards a combination of
mixed-use developments and retail malls that hold
dominant positions in their respective trade areas
29How are we financing it?
Acquisition Cost of S$391.0 million1
Debt Financing Renounceable Non-Underwritten Rights Issue
Up to S$120 million comprising: ✓ Proposed issue of 4,682,872,029 Rights Units
✓ Bank debt ✓ To raise gross proceeds of approx. S$280.0
✓ Vendor Financing of up to S$40 million, of which S$271.0 million to be used to
million depending on amount of partially fund the Acquisition
bank debt drawn down
Sponsor’s irrevocable undertaking in support of LMIR Trust and the Rights Issue
✓ To take up its full pro rata stake in the rights issue
✓ To apply for all the excess rights units not taken up by the other unitholders
1 Excludes the Acquisition Fee of S$1.65 million, which will be paid through the issue of Acquisition Fee Units
30What is the impact of the Rights Issue?
✓ Enlarged market capitalisation, which may lead to Market Capitalisation
improved trading liquidity of the Units on the SGX-St (S$m)
▲83.5%
✓ Aligns Sponsor’s interest with that of LMIR Trust and its 617.6
Unitholders
- grants LMIR Trust a right of first refusal over its
336.6
income-producing retail and/or retail-related real
estate
- reflects the Sponsor’s strong support and confidence
in our LMIR Trust’s growth prospects
2
Pre-Rights Issue1 Post-Rights Issue
✓ Aggregate leverage expected to remain within the
maximum aggregate leverage limit under the Property
Funds Appendix
1 Pre-Rights Issue market capitalisation calculated based on the Closing Price of S$0.115 as of 17 September 2020, multiplied by existing Units
2 Post-Rights Issue market capitalisation calculated based on TERP of S$0.081, multiplied by the aggregation of existing Units and the Rights Units
31Thank You
32Appendix
Property Overview : Retail Malls

                  Bandung Indah                                     Ekalokasari
                                         Cibubur Junction                               Gajah Mada Plaza
                      Plaza                                           Plaza

   Valuation       Rp593.0 billion          Rp258.7 billion        Rp323.7 billion        Rp706.7 billion

               Jalan Merdeka, Bandung,      Jalan Jambore,       Jalan Siliwangi 123,    Jalan Gajah Mada,
   Location
                      West Java          Cibubur, East Jakarta    Bogor, West Java         Central Jakarta

   GFA               75,868 sqm              66,935 sqm              58,859 sqm             79,830 sqm

   NLA               30,288 sqm              34,022 sqm              28,645 sqm             36,535 sqm

   Occupancy           93.1%                    94.7%                  73.1%                  59.1%

   Number of
                        250                      195                     94                    165
   Tenants

                                                                                                             34
Property Overview : Retail Malls
The Plaza
Istana Plaza Mal Lippo Cikarang Sun Plaza
Semanggi
Valuation Rp532.6 billion Rp696.0 billion Rp904.0 billion Rp2,043.0 billion
Jalan MH Thamrin, Jalan Jenderal Jalan Haji Zainul Arifin
Jalan Pasir Kaliki, Bandung,
Location Lippo Cikarang, West Sudirman, South Medan, North
West Java
Java Jakarta Sumatera
GFA 47,533 sqm 39,604 sqm 155,122 sqm 167,000 sqm
NLA 27,471 sqm 28,869 sqm 60,084 sqm 69,556 sqm
Occupancy 76.7% 95.2% 65.5% 93.9%
Number of
163 137 391 378
Tenants
35Property Overview : Retail Malls
Lippo Plaza Palembang Square
Plaza Medan Fair Pluit Village
Kramat Jati Extension
Valuation Rp936.6 billion Rp680.9 billion Rp566.7 billion Rp270.0 billion
Jalan Jenderal Gatot
Jalan Pluit Indah Raya, Jalan Raya Bogor Km Jalan Angkatan 45/POM IX,
Subroto No.30, Medan
Location Penjaringan, North 19, Kramat Jati, East Palembang, South
Petisah, Medan, North
Jakarta Jakarta Sumatera
Sumatera
GFA 141,866 sqm 150,905 sqm 65,446 sqm 23,825 sqm
NLA 68,512 sqm 86,591 sqm 32,951 sqm 18,027 sqm
Occupancy 95.4% 83.7% 91.8% 88.5%
Number of
442 304 112 30
Tenants
36Property Overview : Retail Malls
Tamini Square Palembang Square Lippo Mall Kemang Lippo Plaza Batu
Valuation Rp261.7 billion Rp683.0 billion Rp2,383.0 billion Rp225.8 billion
Jalan Angkatan 45/POM Jalan Diponegoro No.
Jalan Raya Taman Mini, Jalan Kemang VI, South
Location IX, Palembang, South RT 07RW05, Batu City,
East Jakarta Jakarta
Sumatera East Java
GFA 18,963 sqm 50,000 sqm 150,932 sqm 34,340 sqm
NLA 17,475 sqm 30,504 sqm 57,473 sqm 18,558 sqm
Occupancy 97.3% 94.7% 89.2% 74.6%
Number of
13 137 217 51
Tenants
37Property Overview : Retail Malls
Lippo Plaza Lippo Plaza Kediri Town
Palembang Icon Lippo Mall Kuta
Kendari Jogja Square
Valuation Rp710.0 billion Rp716.3 billion Rp339.5 billion Rp541.9 billion Rp364.5 billion
Jalan Hasanudin No. 2,
Jalan POM IX, Jalan Kartika Plaza, Jalan MT Haryono Jalan Laksda Adi
RT/22 RW/06,
Location Palembang, South District of Kuta, No.61-63, Kendari, Sucipto No. 32 –
Balowerti Subdistrict,
Sumatera Badung, Bali South East Sulawesi 34, Yogyakarta
Kediri, East Java
GFA 50,889 sqm 48,467 sqm 34,784 sqm 66,098 sqm 28,688 sqm
NLA 28,538 sqm 20,350 sqm 20,204 sqm 24,414 sqm 16,610 sqm
Occupancy 95.1% 88.5% 99.7% 91.1% 93.7%
Number of
179 64 44 38 67
Tenants
38Property Overview : Retail Spaces
Malang Town
Depok Town Square Grand Palladium1 Java Supermall
Square
Valuation Rp145.7 billion Rp83.5 billion Rp129.2 billion Rp160.9 billion
Jalan Kapt, Maulana Jalan MT Haryono,
Jalan Margonda Raya, Jalan Veteran,
Location Lubis, Medan, North Semarang, Central
Depok, West Java Malang, East Java
Sumatera Java
GFA 13,045 sqm 13,730 sqm 11,082 sqm 11,065 sqm
NLA 12,824 sqm 12,305 sqm 11,082 sqm 11,065 sqm
Occupancy 99.5% 0.0% 98.8% 100.0%
Number of
3 0 1 3
Tenants
1. Grand Palladium: The Business Association of the malls is in the midst of consolidating all the strata title holders to refurbish the mall 39Property Overview : Retail Spaces
Mall WTC Matahari Metropolis Town Plaza Madiun
Square
Valuation Rp107.5 billion Rp134.5 billion Rp217.2 billion
Jalan Raya Serpong, Jalan Hartono Raya,
Jalan Pahlawan, Madiun,
Location Tangerang, Banten Greater Tangerang, Banten Great
East Java
Jakarta Jakarta
GFA 11,184 sqm 15,248 sqm 16,094 sqm
NLA 10,753 sqm 14,861 sqm 11,340 sqm
Occupancy 80.3% 66.2% 95.6%
Number of
3 4 19
Tenants
40Unitholders
Trust Holdings of Units Distributions
Structure
Management fees Trustee’s fees
The
Manager Trustee
Management Acts on behalf of
services Unitholders
Ownership of ordinary Dividends and/or
and redeemable redemption
preference shares proceeds
Singapore
Subsidiaries
Ownership and Dividends, interest income and
shareholders’ loans principal repayment of
shareholders’ loans
Property
Property management fees
Indonesia
Rental payments
Manager Tenants
Subsidiaries
Property management Tenancy
agreements agreements
100% Ownership
Property management services & Tenants of the
coordinator facilities management services retail properties
Retail
Property
Singapore Indonesia
41You can also read