3Q FY2021 Business Update - Ascendas Reit 19 October 2021
←
→
Page content transcription
If your browser does not render page correctly, please read the page content below

Ascendas Reit
                    3Q FY2021
                    Business Update
                    19 October 2021
Aperia, Singapore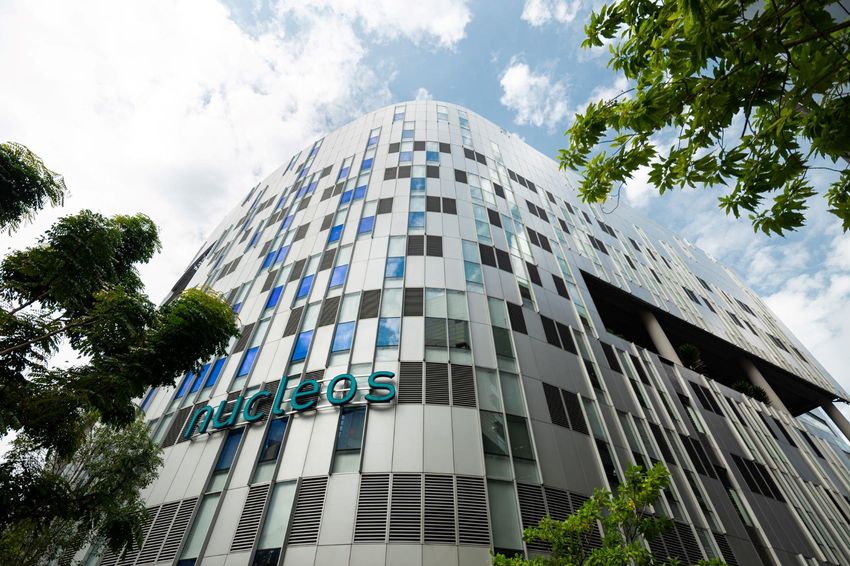
Disclaimers
 •    This presentation may contain forward-looking statements. Actual future performance, outcomes and results may differ materially from those
      expressed in forward-looking statements as a result of a number of risks, uncertainties and assumptions. Representative examples of these factors
      include (without limitation) general industry and economic conditions, interest rate trends, cost of capital and capital availability, availability of real
      estate properties, competition from other developments or companies, shifts in customer demands, shifts in expected levels of occupancy rate,
      property rental income, charge out collections, changes in operating expenses (including employee wages, benefits and training, property operating
      expenses), governmental and public policy changes and the continued availability of financing in the amounts and the terms necessary to support
      future business.

 •    You are cautioned not to place undue reliance on these forward-looking statements, which are based on the current view of management regarding
      future events. No representation or warranty express or implied is made as to, and no reliance should be placed on, the fairness, accuracy,
      completeness or correctness of the information or opinions contained in this presentation. Neither Ascendas Funds Management (S) Ltd (“Manager”)
      nor any of its affiliates, advisers or representatives shall have any liability whatsoever (in negligence or otherwise) for any loss howsoever arising,
      whether directly or indirectly, from any use of, reliance on or distribution of this presentation or its contents or otherwise arising in connection with this
      presentation.

 •    The past performance of Ascendas Reit is not indicative of future performance. The listing of the units in the Ascendas Reit (“Units”) on the Singapore
      Exchange Securities Trading Limited (the “SGX-ST”) does not guarantee a liquid market for the Units. The value of the Units and the income derived
      from them may fall as well as rise. Units are not obligations of, deposits in, or guaranteed by, the Manager. An investment in the Units is subject to
      investment risks, including the possible loss of the principal amount invested. Investors have no right to request that the Manager redeem or purchase
      their Units while the Units are listed on the SGX-ST. It is intended that holders of Units may only deal in their Units through trading on the SGX-ST.

 •    This presentation is for information only and does not constitute an invitation or offer to acquire, purchase or subscribe for the Units.

As c en d a s Rei t                                                                                                                               3Q FY2021 Bus i nes s Updat e   2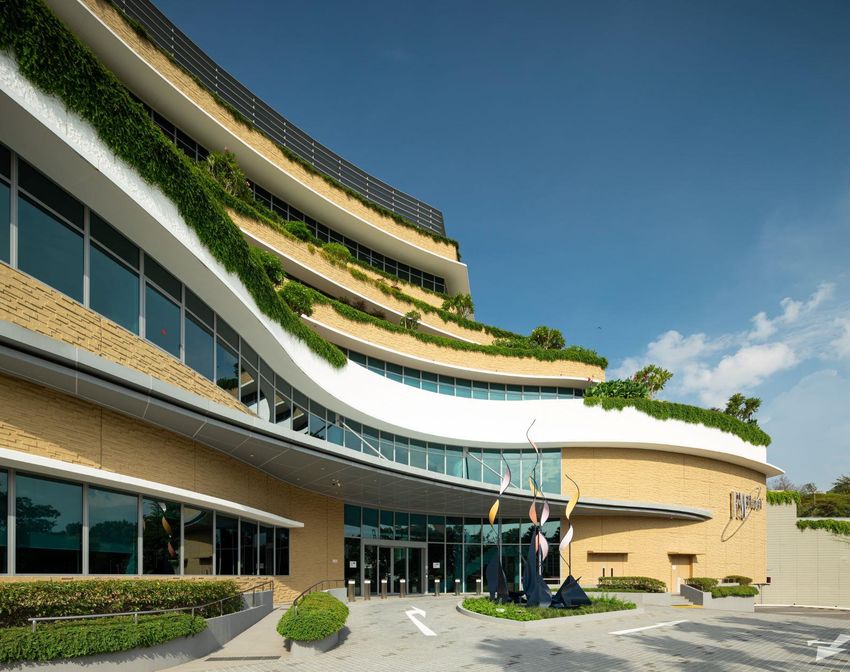
Agenda

                              04
                              Key Highlights

                              07
                              Investment Management

                              11
                              Capital Management

                              15
                              Asset Management

                              30
                              COVID-19 Update & Market Outlook

                              35
                              Appendix: Portfolio Resilience & Sustainability

FM Global Centre, Singapore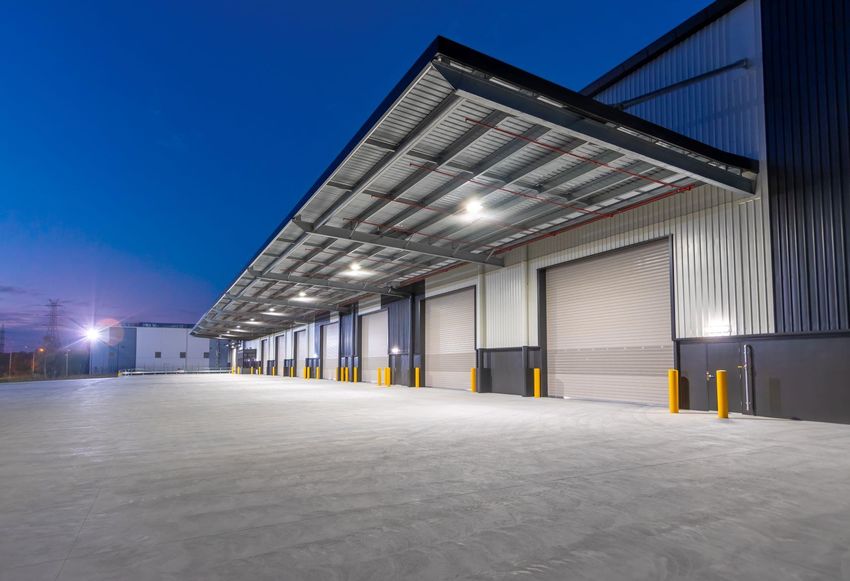
3Q FY2021 Business Update

                                            Key Highlights
1-7 Wayne Goss Drive, Brisbane, Australia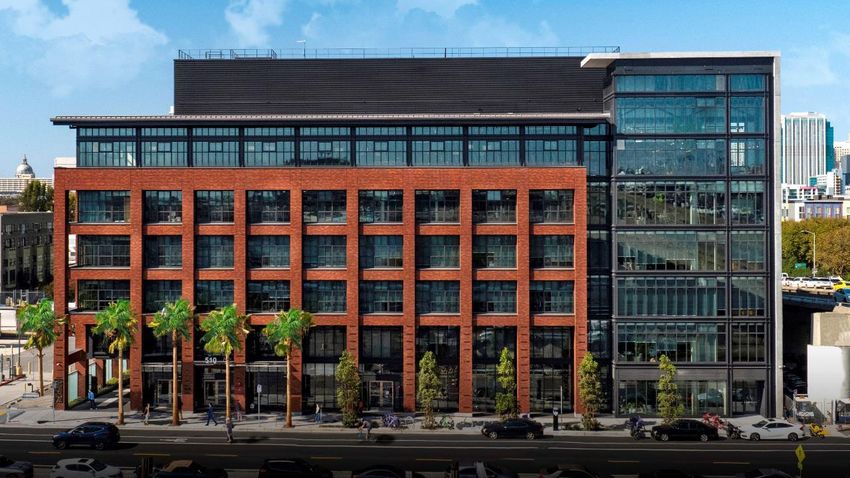
Key
 Highlights
 Investment                  Capital                       Asset
 Management                  Management                    Management
 Completed the development   Healthy Aggregate Leverage    Portfolio Occupancy
 of Grab Headquarters        37.4%                         91.7%
                             30 June 2021: 37.6%           30 June 2021: 91.3%
 (S$184.6m)

 Divested two Australian     High Level of Natural Hedge   Portfolio Rental Reversion
 logistics properties        >80%                          +3.7%
                             30 June 2021: >80%            2Q FY 2021: +8.9%
 (S$104.5m)

As c en d a s Rei t                                                              3Q FY2021 Bus i nes s Updat e   5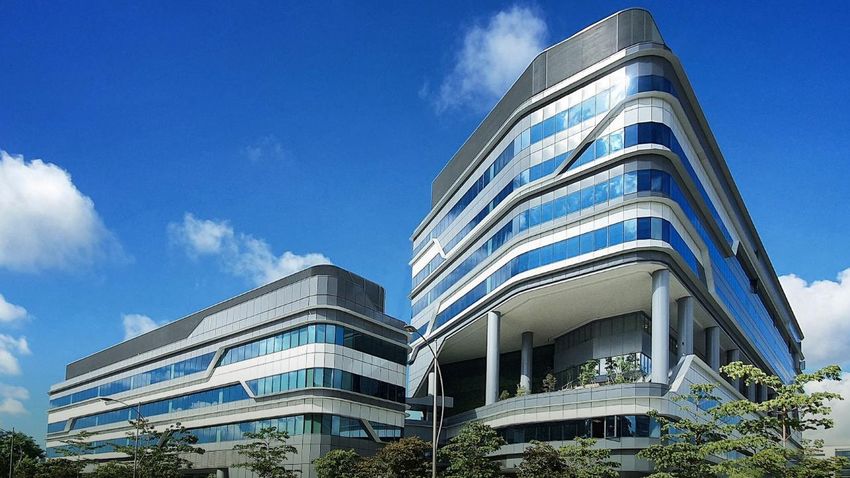
Sustainability and Governance Achievements 2021

                                                SIAS Investors’ Choice Awards 2019
                                                Sustainability Award – Runner Up (REITs & Business Trust Category)
                                               GRESB(1) Public Disclosure 2021
                                               Achieved A rating and ranked 1st amongst industrial Singapore REIT peers

                                               GRESB(1) Public Disclosure 2020
                                               Achieved A rating and ranked 1st amongst industrial S-REIT peers
                                                SIAS Investors’ Choice Awards 2021
                                                Corporate Governance Award – Runner Up (REITs & Business Trust Category)

                                               Singapore Governance and Transparency Index 2021
                                               Ranked 3rd (REITs and Business Trust Category)

 (1) GRESB is an investor-led organisation providing standardised and validated Environmental, Social and Governance data.

As c endas Rei t                                                                                                             3Q FY2021 Bus i nes s Updat e   6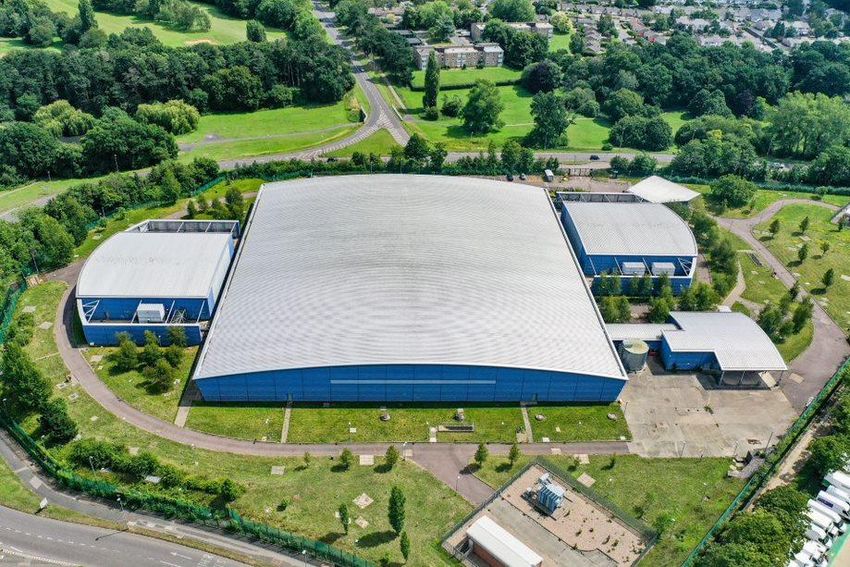
3Q FY2021 Business Update

                                                     Investment
                                                    Management

510 Townsend Street, San Francisco, United States
Investment & Divestment Highlights
 ▪ Completed S$184.6m of development and S$104.5m of divestments
 ▪ Investment Properties stands at S$16.0b

   3Q FY2021                                                            City/Country                    Sub-segment      Sale Price (S$ m)      Completion Date

  Completed Development                                                                                                        184.6

  Grab Headquarters                                                      Singapore                      Business Space         184.6               30 Jul 2021

  Completed Divestments                                                                                                        104.5

  82 Noosa Street and
                                                                     Brisbane, Australia                    Logistics          104.5(1)             9 Jul 2021
  62 Stradbroke Street

   (1)   S$ amount based on illustrative exchange rate of A$1.00: S$1.029 as announced on 3 Jun 2021.

As c endas Rei t                                                                                                                             3Q FY2021 Bus i nes s Updat e   8
Development (Completed in 3Q):
Grab Headquarters, Singapore

  Total Development Cost                                                      S$184.6 m

  Land Tenure                                                                 Approx. 28 years remaining

  Gross Floor Area                                                            42,310 sq m

  Net Lettable Area                                                           42,310 sq m

  Occupancy Rate (from Aug 2021)                                              100%

  Weighted Average Lease Expiry (WALE) (as
                                                                              11 years
  at Aug 2021
                                                                                                                            Grab Headquarters, Singapore
  Tenant                                                                      Grab
                                                                                                               The Property :
  NPI Yield (1)                                                               6.0%
                                                                                                               ▪ Built-to-suit development comprising two tower blocks
  Handover Date                                                               30 Jul 2021                        (9 storeys and 4 storeys) connected via a sky bridge
                                                                                                               ▪ Achieved Green Mark GoldPlus certification
  (1)   The NPI yield is derived using the NPI expected in the stabilised year of operation of the property.   Location:
                                                                                                               ▪ Well-located within one-north, a vibrant business park
                                                                                                                 and an icon of Singapore’s knowledge economy
                                                                                                               ▪ A one-minute drive away from the Ayer Rajah
                                                                                                                 Expressway and a 10 minutes’ drive to the Central
                                                                                                                 Business District

As c endas Rei t                                                                                                                       3 Q FY2 0 2 1 Bu s i n es s Up d a t e   9
Divestment (Completed in 3Q):
82 Noosa Street and 62 Stradbroke Street, Brisbane, Australia

                                                                                                   82 Noosa Street, Brisbane                                                  62 Stradbroke Street, Brisbane

  Property Description & Location                                               Two standalone warehouses located in Heathwood                                Two standalone warehouses located in Heathwood
   Sales Price(1)(2)                                                                                                                      S$104.5 m (A$101.6 m)
                                                                                      SIRE (Strategic Industrial Real Estate), an Arrow Capital Partners vehicle in cooperation with Altis
   Buyers
                                                                                                                               Property Partners
   Book Value/Valuation(3) (as at 31 Dec 2020)                                                                A$53.0 m                                                                      A$37.5 m
   Acquisition Year / Purchase Price                                                                     2015 / A$66.0 m                                                               2015 / A$35.9 m
   Land Tenure                                                                                                Freehold                                                                      Freehold
   Net Lettable Area                                                                                        38,000 sqm                                                                    24,555 sqm
   Occupancy Rate (as at 30 Jun 2021)                                                                            100%                                                                          61.7%
   Completion Date                                                                                                                                   9 Jul 2021

  (1)   In accordance to Ascendas Reit’s Trust Deed, the Manager is entitled to a divestment fee of 0.5% of the sale price of the properties.
  (2)   Based on an illustrative exchange rate of A$1.000: S$1.029 as announced on 3 Jun 2021.
  (3)   The valuations were commissioned by the Manager and the Trustee and was carried out by Knight Frank Australia Pty Ltd using the capitalisation approach and discounted cash flow approach.

As c endas Rei t                                                                                                                                                                                     3Q FY2021 Bus i nes s Updat e   10
3Q FY2021 Business Update
Capital Management
Welwyn City Garden, London, United KingdomHealthy Balance Sheet
As at As at
30 Sep 2021 30 Jun 2021
Aggregate Leverage (1)(2) 37.4% 37.6%
▪ Aggregate leverage is healthy at
Unencumbered Properties as % of 37.4% (1)(2)
93.0% 93.0%
Total Investment Properties (3)
▪ Robust financial metrics that exceed
Interest Cover Ratio (4) 4.9 x 4.6 x bank loan covenants by a healthy
margin
Net Debt / Annualised EBITDA (5) 7.9 x 8.2 x
▪ A3 credit rating facilitates good
Weighted Average Tenure of Debt access to wider funding options at
3.5 3.7
(years) competitive rates
Fixed rate debt as % of total debt 78.4% 75.2% ▪ Available debt headroom of ~S$4.2 b
to reach MAS’s aggregate leverage
Weighted Average all-in Debt Cost 2.4% 2.4% limit of 50.0%
Issuer Rating by Moody’s A3 A3
(1) In accordance with Property Funds Appendix, Ascendas Reit’s proportionate share of its joint ventures’ borrowings and deposited property values are included when computing the aggregate leverage. The ratio of total
gross borrowings to total net assets is 66.2%.
(2) Excludes the effects of FRS 116 for properties held before 31 March 2019.
(3) Total investment properties exclude properties reported as finance lease receivable.
(4) Based on the trailing 12 months EBITDA (excluding effects of any fair value changes of derivatives and investment properties, and foreign exchange translation), divided by the trailing 12 months interest expense and
borrowing-related fees.
(5) Net debt includes lease liabilities arising from FRS 116, 50% of perpetual securities, offset by cash and fixed deposits, while annualised EBITDA does not pro-rate for full year EBITDA from new acquisitions.
As c endas Rei t 3Q FY2021 Bus i nes s Updat e 12Well-spread Debt Maturity Profile
▪ Well-spread debt maturity with the longest debt maturing in FY2030
▪ Average debt maturity healthy at 3.5 years
▪ To date, green financing totaling S$1.2 b (1) accounts for about 18% of total borrowings
9%
5%
1400 36%
Diversified
1200 Financial
1000 945 Resources
S$ million
851 860 881
800 687 293 50%
633
373 438
600 556 485
283 651 25
398 371 -
400 555 154
200 413 485 100
350 333 325 371
200 254 -
132 100
0 - - - - - - - - -
FY2021 FY2022 FY2023 FY2024 FY2025 FY2026 FY2027 FY2028 FY2029 FY2030
Committed Revolving Credit Facilities Medium Term Notes Green Debt
Term Loan Facilities Revolving Credit Facilities
(1) Includes Green Perpetual Securities of S$300m.
As c endas Rei t 3Q FY2021 Bus i nes s Updat e 13High Natural Hedge
▪ Maintained high level of natural hedge for Australia (75.9%), United States (88.4%), the United Kingdom (70.3%) and
Europe(100.0%) to minimise the effects of any adverse exchange rate fluctuations.
A$ Natural Hedge US$ Natural Hedge £ Natural Hedge € Natural Hedge
75.9% 88.4% 70.3% 100.0%
A$2.1 b US$1.6 b
(S$ 2.1 b) (S$ 2.1 b) US$1.4 b
A$1.6 b (S$ 1.8 b)
S$ billion
(S$ 1.6 b)
£0.7 b
(S$ 1.3 b)
£0.5 b
(S$ 0.9 b)
€0.3 b €0.3 b
(S$ 0.5 b) (S$ 0.5 b)
Total Australia Total Australia Total United Total United Total United Total United Total Europe Total Europe
Assets Borrowings States Assets States Kingdom Assets Kingdom Assets Borrowings
Borrowings Borrowings
As c endas Rei t 3 Q FY2 0 2 1 Bu s i n es s Up d a t e 143Q FY2021 Business Update
Asset
Nucleos, Singapore
ManagementOverview of Portfolio Occupancy
97.5% 95.8% 97.5% 98.2% 98.2% 97.5%
91.4% 92.8% 92.0% 91.7% 91.3% 91.9%
88.5% 87.9% 88.8%
Sep-21
Jun-21
Sep-20
Singapore Australia United States United Kingdom / Europe Total
Gross Floor (2) (3)
3,094,298 788,652 350,536 590,393 4,823,879
Area (sqm)(1)
(1) Gross Floor Area as at 30 Sep 2021.
(2) Gross Floor Area for Australia portfolio refers to the Gross Lettable Area/Net Lettable Area.
(3) Gross Floor Area for United Kingdom/Europe portfolio refers to the Gross Internal Area.
As c endas Rei t 3Q FY2021 Bus i nes s Updat e 16Singapore
Occupancy
▪ Improved to 88.5% mainly due to:
➢ Higher occupancy at (i) 21 Changi South Ave 2 (Logistics) (30 Sep 2021: 100%; 30 Jun 2021: 36.1%),
(ii) Techplace I (Industrial) (30 Sep 2021: 96.5%; 30 Jun 2021: 90.4%) (iii) 9 Woodlands Terrace
(Industrial) (30 Sep 2021: 100%; 30 Jun 2021: 0%)
➢ Handover of Grab Headquarters (Business Space) to Grab in Jul 2021 (Sep 2021: 100%)
As at 30 Sep 2021 30 Jun 2021 30 Sep 2020
Total Singapore Portfolio GFA (sqm) 3,094,298 (1) 3,051,988(1) 2,985,406(1)
Singapore Portfolio Occupancy (same store) (2) 88.2% 87.7% 88.7%
Singapore MTB Occupancy (same store) (3) 85.8% 85.3% 86.3%
Occupancy of Investments completed in the last 12
96.0%(4)(5) 98.2%(4) 94.5%
months
Overall Singapore Portfolio Occupancy 88.5% 87.9% 88.8%
Singapore MTB Occupancy 85.2% 84.8% 86.5%
(1) Excludes 25 & 27 Ubi Road 4 and iQuest@IBP which were decommissioned for redevelopment since Jun 2019 and Jan 2020 respectively.
(2) Same store portfolio occupancy rates for previous quarters are computed with the same list of properties as at 30 Sep 2021, excluding new investments completed in the last 12 months and divestments.
(3) Same store MTB occupancy rates for previous quarters are computed with the same list of properties as at 30 Sep 2021, excluding new investments completed in the last 12 months, divestments and changes in classification of certain
buildings from single-tenant to multi-tenant buildings or vice-versa.
(4) Refers to Galaxis.
(5) Refers to Grab Headquarters.
As c endas Rei t 3 Q FY2 0 2 1 Bu s i n es s Up d a t e 17Australia
Occupancy
▪ Improved to 97.5% mainly due to:
➢ A new lease secured at 1 Distribution Place (Logistics, Sydney) (30 Sep 2021:100%, 30 Jun 2021: 53.7%)
➢ Divestment of 62 Stradbroke Street (Logistics, Brisbane) in Jul 2021 (30 Jun 2021: 61.7%)
As at 30 Sep 2021 30 Jun 2021 30 Sep 2020
Total Australian Portfolio GFA (sqm) 788,652 851,207 828,195
Australian Portfolio Occupancy
97.3% 95.4% 97.5%
(same store)(1)
Occupancy of Investments completed in the last
100%(2) 100%(2) 100%
12 months
Overall Australian Portfolio Occupancy 97.5% 95.8% 97.5%
(1) Same store portfolio occupancy rates for previous quarters are computed with the same list of properties as at 30 Sep 2021, excluding new investments completed in the last 12 months.
(2) Takes into account the rental guarantee provided by the vendor at 254 Wellington Rd, Mulgrave, in Melbourne and 1-5 Thomas Holt Drive, in Sydney.
As c endas Rei t 3Q FY2021 Bus i nes s Updat e 18United States
Occupancy
▪ Declined to 91.4% mainly due to lower occupancy at Perimeter Three (Business Space, Raleigh) (30 Sep 2021:83.2%,
30 Jun 2021: 100%)
As at 30 Sep 2021 30 Jun 2021 30 Sep 2020
Total United States Portfolio GFA (sqm) 350,536(1) 357,065 313,059
United States Portfolio Occupancy
90.2% 91.9% 92.0%
(same store)(2)
Occupancy of Investments completed in the
100%(3) 100%(3) N.A.
last 12 months
Overall United States Portfolio Occupancy 91.4% 92.8% 92.0%
(1) Decrease in GFA is due to the decommissioning of space at Greenbrier Court, Portland.
(2) Same store portfolio occupancy rates for previous quarters are computed with the same list of properties as at 30 Sep 2021, excluding new investments completed in the last 12 months.
(3) Refers to 510 Townsend Street and 505 Brannan Street, in San Francisco
As c endas Rei t 3Q FY2021 Bus i nes s Updat e 19United Kingdom / Europe
Occupancy
▪ Occupancy remained healthy at 98.2%
As at 30 Sep 2021 30 Jun 2021 30 Sep 2020
Total UK/Europe Portfolio GFA (sqm) 590,393 590,393 509,907
UK/Europe Portfolio Occupancy
98.3% 98.3% 97.5%
(same store)(1)
Occupancy of Investments completed in the last
97.9%(2) 97.9%(2) N.A.
12 months
Overall UK/Europe Portfolio Occupancy 98.2% 98.2% 97.5%
(1) Same store portfolio occupancy rates for previous quarters are computed with the same list of properties as at 30 Sep 2021, excluding new investments completed in the last 12 months.
(2) Refers to the 11 data centres located in UK/Europe.
As c endas Rei t 3Q FY2021 Bus i nes s Updat e 20Singapore
Sources of New Demand in 3Q 2021
3.8% 4.5%
2.8% 3.1%
9.2% 6.5% 0.9% 13.8% 8.1% 1.0%
0.3% 0.7%
13.0%
14.5% By Gross
14.3% By NLA Rental
Income 20.6%
25.3%
16.0%
23.9% 17.7%
Biomedical and Agri/Aquaculture Logistics & Supply Chain Management Engineering
Lifestyle, Retail and Consumer Products IT & Data Centers Distributors & Trading Company
Electronics Education and Media Financial & Professional Services
Energy, Chemicals and Materials
As c endas Rei t 3Q FY2021 Bus i nes s Updat e 21Portfolio Rental Reversions
▪ Average portfolio rent reversion of leases renewed in 3Q FY2021 and YTD FY2021 was 3.7% and 5.4% respectively.
▪ Rental reversion for FY2021 is expected to be in the positive low single-digit range in view of current market uncertainties.
% Change in Renewal Rates for Multi-tenant Buildings (1) 3Q FY2021 2Q FY2021 3Q FY2020
Singapore 3.6% 3.4% -2.8%
Business Spaces 3.7% 3.7% 4.5%
High-Specifications Industrial and Data Centres 5.1% 4.8% -3.3%
Light Industrial and Flatted Factories 1.1% 1.3% -1.4%
Logistics & Distribution Centres 4.6% 4.9% -16.2%
Integrated Development, Amenities & Retail 1.4% -3.1% 0.0%
Australia -(2) -(2) -(2)
Business Spaces -(2) -(2) -(2)
Logistics & Distribution Centres -(2) -(2) -(2)
United States 15.0% 26.3% 11.5%
Business Spaces 15.0% 26.3% 11.5%
United Kingdom/Europe -(2) -(2) -(2)
Data Centres -(2) -(2) N.A.
Logistics & Distribution Centres -(2) -(2) -(2)
Total Portfolio : 3.7% 8.9% -2.3%
(1) Percentage change of the average gross rent over the lease period of the renewed leases against the preceding average gross rent from lease start date. Takes into account renewed leases that were signed in their respective
and average gross rents are weighted by area renewed.
(2) There were no renewals signed in the period for the respective segments.
As c endas Rei t 3Q FY2021 Bus i nes s Updat e 22Weighted Average Lease Expiry
By Gross Revenue
▪ Portfolio Weighted Average Lease Expiry (WALE) stood at 3.8 years
WALE (as at 30 Sep 2021) Years
Singapore 3.4
Australia 3.6
United States 4.8
United Kingdom/Europe 5.7
Portfolio 3.8
As c endas Rei t 3Q FY2021 Bus i nes s Updat e 23Portfolio Lease Expiry Profile Breakdown of expiring leases for
FY2021 and FY2022
As at 30 Sep 2021
7%3%
▪ Portfolio WALE of 3.8 years 7%
28%
12%
7% 32%
▪ Lease expiry is well-spread, extending beyond FY2035 2%
7%
▪ About 2.7% of gross rental income is due for renewal in the remaining of FY2021 FY2021 FY2022
5%
▪ Weighted average lease term of new leases (1) signed in 3Q FY2021 was 3.4 years 30%
16%
and contributed 2.6% of 3Q FY2021 total gross revenue 15% 13%
7% 9%
25%
% of Gross Rental Income (Total Portfolio)
20.9%21.2%
20% Business Space
High-Specifications Industrial and Data Centres
15% 13.7% Light Industrial and Flatted Factories
11.6% Multi-tenant Buildings
17.2% 17.2% Logistics & Distribution Centres
9.4% Single-tenant Buildings
10%
10.0%
Integrated Development, Amenities & Retail
4.3%
9.6% Logistics & Business Space (Australia)
3.9% 4.2%
5%
2.7% 2.2% 2.4% 2.3% Logistics & Data Centres (UK/Europe)
1.9%
3.7% 4.1% 3.6%
5.0%
1.5%
0.8% 0.7%
1.0% 1.4% 4.2%
1.2%
2.6% 1.3% 0.0% 0.2% Business Space (US)
2.0% 2.4% 1.4% 1.6% 0.6% 1.9%
0.1% 1.0% 1.0% 0.8% 1.0%
0%
FY28
> FY35
FY21
FY22
FY23
FY24
FY25
FY26
FY27
FY29
FY30
FY31
FY32
FY33
FY34
FY35
(1) New leases refer to new, expansion and renewal leases. Excludes leases from new acquisitions.
As c endas Rei t 3Q FY2021 Bus i nes s Updat e 24Breakdown of expiring leases
for FY2021 and FY2022
Singapore: Lease Expiry Profile 3%
As at 30 Sep 2021
33%
35%
▪ Singapore portfolio WALE of 3.4 years FY2021
▪ Lease expiry is well-spread, extending beyond FY2035
▪ About 3.5% of gross rental income is due for renewal in the remaining of FY2021 9% 20%
30%
26.9%
6%
23.9%
% of Gross Rental Income (Singapore)
25%
20%
20% 44%
FY2022
Multi-tenant Buildings - SG 12%
15% 23.2%
13.0%
20.7% 12.3% Single-tenant Buildings - SG
18%
10%
11.2% 5.9% Business and Science Parks
11.7%
5% 3.5% 4.1%
2.8% High-Specifications Industrial and Data Centres
1.3% 1.0% 2.0% 2.1% 1.2% 1.9%
3.7%
1.0% 4.1% 0.3%
3.5% 3.2%
0.6% 1.8%
3.1% 0.3% 1.4% 2.1% 0.0% 0.3% 0.0% Light Industrial and Flatted Factories
1.3% 0.6% 0.6% 0.7% 1.2% 1.5%
0%
FY21
FY22
FY23
FY24
FY25
FY26
FY27
FY28
FY29
FY30
FY31
FY32
FY33
FY34
FY35
FY35
Logistics & Distribution Centres
>
Integrated Development, Amenities & Retail
As c endas Rei t 3Q FY2021 Bus i nes s Updat e 25Australia: Lease Expiry Profile Breakdown of expiring leases
As at 30 Sep 2021 for FY2021 and FY2022
▪ Australia portfolio WALE of 3.6 years 7%
▪ Lease expiry is well-spread, extending beyond FY2030
▪ 1.5% of Australia’s gross rental income is due for renewal in the remaining of
FY2021 FY2021
25%
21.0% 93%
% of Gross Rental Income (Australia)
20% 18.6% Multi-tenant building - AUS
16.3% Single-tenant building - AUS
15.3%
10.2% 6.5%
22%
15%
12.2%
7.0% FY2022
10% 12.6%
15% 63%
10.1% 5.7%
12.1%
5% 10.7% 4.0%
8.3% 2.4% 2.9%
1.5% 5.7%
3.7% 0.1% 4.0%
1.5% 2.1% 0.0% 2.9%
2.3%
0%
FY23
FY21
FY22
FY24
FY25
FY26
FY27
FY28
FY29
FY30
FY31
Sydney Melbourne Brisbane
As c endas Rei t 3Q FY2021 Bus i nes s Updat e 26Breakdown of expiring leases
United States: Lease Expiry Profile for FY2021 and FY2022
As at 30 Sep 2021
▪ United States portfolio WALE of 4.8 years
36%
▪ Lease expiry is well-spread, extending beyond FY2032 FY2021
▪ 0.6% of United States’s gross rental income is due for renewal in the remaining of
FY2021 64%
% of Gross Rental Income (United States)
25%
22.0%
21.0%
20% 3.9% 21%
Multi-tenant building - US
Single-tenant building - US
10.4%
15%
12.4% FY2022
11.2% 55%
10% 8.5% 23%
7.2% 18.1%
7.5%
11.6%
4.4% 11.2%
5% 10.6% 7.2%
2.8% 3.2% 3.4%
6.3%
0.6% 2.8% 3.1% 3.2% 0.0% 0.1% 3.4%
0.6% 1.3% 0.8% 0.9%
0% San Diego Raleigh Portland
FY25
FY21
FY22
FY23
FY24
FY26
FY27
FY28
FY29
FY30
FY31
FY32
FY33
As c endas Rei t 3Q FY2021 Bus i nes s Updat e 27United Kingdom/Europe: Lease Expiry Profile Breakdown of expiring leases
for FY2021 and FY2022
As at 30 Sep 2021
▪ United Kingdom/Europe portfolio WALE of 5.7 years
▪ Lease expiry is well-spread, extending beyond FY2034
▪ 1.7% of United Kingdom/Europe’s gross rental income is due for renewal in FY2021
remaining of FY2021
25%
22.1% 100%
21.4%
% of Gross Rental Income
2.2%
(United Kingdom/Europe)
20%
8.7% Multi-tenant building - UK/EUR
Single-tenant building - UK/EUR
15%
12.8%
43%
FY2022
9.8% 57%
10% 19.2% 7.8%
11.9% 13.4% 5.9%
4.6%
5% 3.2% 3.3% 3.4% 9.8%
2.9%
1.7% 0.7% 1.9% 1.9% 5.9% 1.8%
3.2% 1.8% 3.3% 3.4%
0.7% 2.5% 1.9% 1.9% 1.8% 0.0%
1.0% 1.0% 1.2% United Kingdom The Netherlands
0%
>FY34
FY34
FY21
FY22
FY23
FY24
FY25
FY26
FY27
FY28
FY29
FY30
FY31
FY32
FY33
As c endas Rei t 3Q FY2021 Bus i nes s Updat e 28Improving Portfolio Quality
Ongoing Projects
Estimated
City/Country Estimated Total Cost (S$m)
Completion Date
Acquisitions Under Development 251.2
Lot 7, Kiora Crescent, Yennora Sydney, Australia 21.1(1) 4Q 2021(2)
500 Green Road, Crestmead Brisbane, Australia 69.1(3) 4Q 2021
MQX4, Macquarie Park Sydney, Australia 161.0(4) Mid-2022
Redevelopments 119.3
UBIX (formerly 25 & 27 Ubi Road 4) Singapore 35.0 1Q 2022
iQuest@IBP Singapore 84.3 4Q 2023
Asset Enhancement Initiatives 18.8
Changi Logistics Centre Singapore 11.3 2Q 2022
Hansapoint Singapore 7.5 1Q 2022
TOTAL: 389.3
(1) Based on exchange rate of A$1.00: S$0.8996 as at 31 May 2020
(2) Delayed from 3Q2021
(3) Based on exchange rate of A$1.000: S$0.9830 as at 30 Sep 2020
(4) Based on exchange rate of A$1.000: S$0.9628 as at 31 Jul 2020
As c endas Rei t 3Q FY2021 Bus i nes s Updat e 293Q FY2021 Business Update
COVID-19 Update &
Market Outlook
Grab Headquarters, Singapore
30COVID-19 Update
FY2020 YTD FY2021
▪ Minimal financial Singapore: UK:
impact ▪ In Sep 2021, a Rental Waiver Framework was introduced ▪ The protection against landlord’s
requiring landlords to provide a 2-week rental support to SMEs eviction of tenants due to the non-
➢ S$17.8 m in rent rebates
and specified Non-Profit Organisations (NPOs) affected by the payment of rent was extended till 25
(1.7% of total gross
tightened safe management measures during Phase 2 March 2022
revenue) was recognised
(Heightened Alert) (P2HA)(1) Landlords may offset the ▪ The protection against the
➢ Tenants who received rent mandatory relief with any relief provided since May 2021 Commercial Rent Arrears Recovery
rebates were mainly SME
▪ In May-Jun 2021, 0.5 months of rebates amounting to S$0.7 m act where landlords can seize goods
tenants in Singapore and
were already provided to support F&B/Retail tenants in owned by the tenant in lieu of rent(3)
F&B operators in overseas
Singapore affected by P2HA measures was extended till 25 March 2022.
markets
Australia (New South Wales):
▪ Did not retain any
distributions ▪ Landlords are restricted from terminating /enforcing leases if
qualifying SME tenant does not pay rent, outgoings or trade;
landlords to provide rental relief (waiver/ abatement) for
impacted leases, prohibited from increasing rent and obligated
to renegotiate rent of the impacted leases(2)
▪ Eligible landlords can claim for land tax relief if rent reduction
was provided(2)
(1) Qualifying SMEs and NPOs must have annual revenues not exceeding S$100 million in FY2019 and suffered at least a 20 per cent drop in average monthly revenue during both P2HA periods, among other criteria. For more
details: Rental Waiver Framework for Businesses Impacted by Phase 2 (Heightened Alert) (mlaw.gov.sg)
(2) Qualifying SME tenant refers to an impacted lessee who qualifies for 1 or more of the NSW Government’s COVID-19 Grants and whose turnover in the 2020-21 financial year was less than A$50m. For more details on Retail &
Other Commercial Leases (COVID19) Amendment Regulation 2021: https://legislation.nsw.gov.au/view/pdf/asmade/sl-2021-451
(3) Unless the tenant has more than 554 days’ worth of rent arrears. For more details on UK’s legislations: Supporting businesses with commercial rent debts: policy statement - GOV.UK (www.gov.uk)
As c endas Rei t 3Q FY2021 Bus i nes s Updat e 31Market Outlook
▪ In its Oct 2021 World Economic Outlook, the International Monetary Fund (IMF) revised its global growth forecast for
2021 to 5.9% from 6.0% (Jul-21 estimate). Supply chain bottlenecks and the resurgence of the pandemic moderated the
outlook for both advanced and developing economies.
Singapore
▪ In Singapore, the economy expanded 6.5% y-o-y in 3Q 2021, underpinned by growth in all key industries
(manufacturing, construction and the services producing industries). The economy is expected to grow by between 6.0%
and 7.0% in 2021.
➢ In the near term, leasing demand is expected to stay relatively muted as most companies remain cautious with their
business and expansion plans due to market uncertainties globally.
➢ In May-Jun 2021, half a month of rent rebates amounting to S$0.7 m were provided to support F&B and retail tenants
affected by the heightened COVID-19 measures in Singapore. Landlords are mandated to provide a two-week rent rebate
to qualifying tenants, which may be offset by any relief provided since May 2021 (for details see slide 29)
➢ The recently completed Grab Headquarters will strengthen Ascendas Reit’s business space portfolio and tenant base.
➢ With business space properties accounting for 50% of its S$10.0 b total investment properties in Singapore, Ascendas Reit
remains well positioned to tap on demand from new economy sectors such as biomedical sciences and information and
communications technologies.
Source for Singapore GDP and GDP growth forecast: MTI
As c endas Rei t 3Q FY2021 Bus i nes s Updat e 32Market Outlook
Australia
▪ The Australian economy expanded 9.6% y-o-y in 2Q 2021. However, the recovery was interrupted by the outbreak of
the Delta strain of COVID-19 from Jun 2021. Nevertheless, GDP growth is still projected to expand by 3.5% in 2021.
➢ Portfolio continues to deliver stable performance due to the good locations of its properties in Sydney, Melbourne and
Brisbane, its WALE of 3.6 years and the average rent escalations of approximately 3% per annum.
➢ Total investment in Australia is expected to grow to S$2.4 b from S$2.1 b after taking into account three properties (worth
S$251.2 m) that are under development. These are two logistics properties located in Sydney and Brisbane, and one
suburban office property located in Macquarie Park, Sydney, all three of which are expected to complete within the next 12
months.
United States
▪ In 2Q 2021, the US economy grew 12.2% y-o-y as the reopening of establishments and continued government
response helped lift the economy to recovery. US GDP is expected to expand by 6.0% y-o-y in 2021.
➢ As companies evaluate their real estate footprint post pandemic, leasing activity is expected to remain slow.
➢ Nevertheless, Ascendas Reit’s S$2.1 b of investment in the US is underpinned by the good locations of its properties
within key US technology cities, its long WALE of 4.8 years and the high proportion of leases with rent escalation clauses
of between 2.5% and 4.0% per annum.
Source for Australia GDP: Australian Bureau of Statistics; Source for Australia GDP growth forecast: IMF
Source for US GDP: US Bureau of Economic Analysis; Source for GDP growth forecast: IMF
As c endas Rei t 3Q FY2021 Bus i nes s Updat e 33Market Outlook
United Kingdom / Europe
▪ Following the easing of COVID-19 restrictions, the UK economy rose 23.6% y-o-y. It is expected to grow by 6.8% y-o-y
in 2021. France, the Netherlands and Switzerland also experienced a resurgence of COVID-19 cases and
implemented various forms of restrictions in the early part of 2021. However, their economies are expected to rebound
in 2021 following the easing of COVID-19 containment measures, steady rollout of vaccinations and strong policy
support.
➢ Overall, the UK/Europe portfolio which is worth S$1.8 b, has a long WALE of 5.7 years which will help to mitigate any
uncertainties. Key trends such as the strong e-commerce adoption and digitalisation of activities, are expected to support
demand for logistics and data centre space.
Conclusion
▪ Whilst the global economic outlook for 2021 is expected to be brighter compared to 2020, the pace of business
recovery is likely to vary across sectors and geographies. The Manager will continue to exercise prudence, maintain a
strong balance sheet and proactively manage its S$16.0 b portfolio to deliver sustainable returns for its Unitholders.
Source for UK GDP: Office for National Statistics; Source for UK GDP growth forecast: IMF
Source for France and the Netherlands: European Commission (May 2021 European Economic Forecast report). Source for Switzerland: State Secretariat for Economic Affairs (SECO)
As c endas Rei t 3Q FY2021 Bus i nes s Updat e 343Q FY2021 Business Update
Appendix: Portfolio Resilience &
Sustainability
254 Wellington Road, Melbourne, AustraliaUnited Kingdom/Europe,
Diversified Portfolio 12%
By Value of Investment Properties
Singapore,
62%
▪ As at 30 Sep 2021, total investment properties stood at United States, Total Investment
13% Properties(5)
S$16.0 b (207 properties(1)) ~S$16.0 b
▪ Diversified geographically:
▪ Singapore portfolio: S$10.0 b Australia,
13%
▪ Australia portfolio: S$2.1 b
▪ United States portfolio: S$2.1 b
▪ United Kingdom/Europe portfolio: S$1.8 b
Business Space,
▪ Diversified by asset class: Data Centre,
50%
9%
▪ Business Space(2): 50%
▪ Logistics & Distribution Centre(3): 21% Total Investment
Properties(5)
▪ Industrial(4): 20% ~S$16.0 b
▪ Data Centre: 9%
(1) Excludes 3 properties in Singapore which are under redevelopment. Industrial ,
(2) Business Space includes business & science park properties/offices (Singapore 32%, US 13%), suburban offices (Australia 5%). 20% Logistics,
(3) Comprises logistics properties in Singapore (7%), Australia (8%) and UK (6%).
(4) Comprises high specifications industrial properties (10%), light industrial properties & flatted factories (5%) and integrated development, amenities & retail 21%
(5%) in Singapore.
(5) Multi-tenant buildings account for 69.0% of Ascendas Reit’s total investment properties (by asset value) as at 30 Sep 2021.
As c endas Rei t 3Q FY2021 Bus i nes s Updat e 36Customers’ Industry Diversification
By Monthly Rental Income
▪ Diversified customer base across more than 20 industries
Data centres 11.2%
Information & Communications Technology 11.2%
Engineering 11.0%
Logistics & Supply Chain Management 10.7%
Biomedical Sciences 9.3%
Financial Services 7.5%
Electronics 6.7%
Government 6.2%
Distributors & Trading Company 4.9%
Retail 4.1%
Food 3.6%
Media 3.0% More than
Professional Services
e-Commerce
2.7%
2.5% 20 industries
Chemical 2.2%
Textile & Garments 1.0%
Energy/Utilities 0.6%
Real Estate 0.5%
Education 0.4%
FMCG 0.4%
Hospitality & Leisure 0.2%
Agriculture 0.1%
IO/NGOs/NPOs 0.1%
Conglomerate 0.04%
Natural Resources 0.02%
As c endas Rei t 3Q FY2021 Bus i nes s Updat e 37Quality and Diversified Customer Base
▪ Total customer base is at approximately 1,530 tenants.
▪ Top 10 customers (as at 30 Sep 2021) account for about 18.7% of monthly portfolio gross revenue.
▪ On a portfolio basis, weighted average security deposit is about 5.0 months of rental income.
Top 10 Customers of Ascendas Reit by Monthly Gross Revenue (as at 30 Sep 2021)
3.5% geographical location(s) of property
2.8%
2.3%
2.1%
1.6% 1.6%
1.4%
1.2%
1.1% 1.1%
Singapore Stripe, Inc. DSO National SEA Group Pinterest, Inc. DBS Bank Ltd Carefusion Citibank, N.A Equinix, Inc. J.P. Morgan Chase
Telecommunications Laboratories Manufacturing, LLC Bank, N.A.
Ltd
As c endas Rei t 3Q FY2021 Bus i nes s Updat e 38Galaxis, 4.1% Aperia, 3.6%
Diversified Portfolio 12, 14 & 16 Science Park Drive, 2.7%
Croydon, 2.1%
ONE @ Changi City, 2.7%
1, 3 & 5 Changi Business Park Crescent, 2.1%
Nucleos, 2.1% 510 Townsend Street, 2.0%
Kim Chuan Telecommunication Complex, 1.9% Neuros & Immunos, 1.7%
TelePark, 1.7% Pioneer Hub, 1.6%
40 Penjuru Lane, 1.5% TechPlace II, 1.4%
The Aries, Sparkle & Gemini, 1.4% 1-5 Thomas Holt Drive, 1.4%
Techview, 1.4% Corporation Place, 1.3%
DBS Asia Hub, 1.3% 505 Brannan Street, 1.2%
Techlink, 1.2% The Galen, 1.2%
Nexus@one-north, 1.1% TechPlace I, 1.1%
No single property TechPoint, 1.1% Paul van Vlissingenstraat, 1.0%
Welwyn Garden City, 1.0% The Kendall, 1.0%
accounts for more than 80 Bendemeer Road, 0.9% 31 International Business Park, 0.9%
Siemens Centre, 0.9% Grab Headquarters, 0.9%
4.1% of Ascendas Reit’s 10020 Pacific Mesa Boulevard, 0.9% 197-201 Coward Street, 0.9%
FoodAxis @ Senoko, 0.8% Infineon Building, 0.8%
monthly gross revenue
10 Toh Guan Road, 0.8% 138 Depot Road, 0.8%
Hansapoint, 0.7% Nordic European Centre, 0.7%
Cintech III & IV, 0.7% The Capricorn, 0.7%
Giant Hypermart, 0.7% Cressex, 0.7%
5200 East and West Paramount Parkway, 0.7% 7 Grevillea Street, 0.7%
Perimeter 1, 0.6% 5005 & 5010 Wateridge, 0.6%
LogisTech, 0.6% Changi Logistics Centre, 0.6%
Perimeter 3, 0.6% Courts Megastore, 0.6%
Cateringweg, 0.6% 108 Wickham Street, 0.6%
Others, 32.9%
As c endas Rei t 3Q FY2021 Bus i nes s Updat e 39Sustainability Committees
Strategic Oversight & Implementation of Strategies
CapitaLand’s Sustainability The Manager’s
Management Structure Sustainability Committee (Established in 2020)
Chairman: CEO
Committee Members:
Management Team Members
• Portfolio Management
• Investment
• Finance, Risk and Sustainability Board of the
• Capital Markets & Investor Relations Manager
Management and implementation of Ascendas
Reit’s sustainability objectives and strategies
The Manager’s
Sustainability Working Committee
Working Committee Members:
Representatives from Various Functions
(Headed by Chief Financial Officer)
As c endas Rei t 3Q FY2021 Bus i nes s Updat e 40Ascendas Reit’s ESG Targets
Targets Timeline
• Green Certification for new acquisitions/developments to meet a minimum
green rating target set(1)
o Singapore – Green Mark GoldPLUS award
-
o Overseas – certification by a green rating system administered by a national
government ministry/agency or a World Green Building Council (WGBC)
Environmental recognised Green Building Council(2)
• All existing properties to achieve a minimum green rating (3) By 2030
• Power the common facilities’ electricity usage at 3 properties (4) located at one-
By 2022
north, Singapore, with renewable energy
• Zero incidents resulting in staff permanent disability or fatality
• To ensure that at least 92% of vendors(5) attain a Level 3 in bizSAFE and
Social Perpetual targets
above
• To achieve zero cases of validated discrimination
• To achieve zero lapses in corporate governance, corruption/employee
misconduct
Governance • Train all licensed employees on compliance with relevant governance policies Perpetual targets
• Achieve full compliance with Personal Data Protection Act (PDPA)
requirements
(1) Refers to Ascendas Reit’s owned and managed properties. If this is not achievable immediately, capital expenditure will be set aside to enhance the properties to attain green certifications in the future.
(2) Includes certifications for new building construction, core & shell, design and as-built etc.
(3) Refers to Ascendas Reit’s’s owned and managed properties
(4) Refers to Neuros & Immunos, Nexus@one-north and Nucleos.
(5) Refers to vendors appointed by the procurement team for Ascendas Reit’s Singapore property management services.
As c endas Rei t 3Q FY2021 Bus i nes s Updat e 41Green Initiatives
Green Financing Renewable Energy
▪ Established Green Finance Framework in ▪ Largest no. of public Electric Vehicle
FY2020 (EV) charging points in Singapore by a S-
▪ Total of ~S$1.2 b comprising Green Bond, REIT: 76
Green Perpetual Securities, Green Loans ▪ One of the largest combined rooftop
solar installations in Singapore for a
▪ Green Interest Rates Swap (~S$200 m) real estate company: >10,000 MWh of
solar power generated annually from solar
farms on 7 of our properties.
Green Buildings Leveraging Technology
▪ Largest number of BCA Green Mark ▪ Smart Urban Co-Innovation Lab located at
properties amongst S-REITs: 35(1) The Galen, is Southeast Asia’s first
▪ Total portfolio comprises 43(1) Green industry-led innovation lab for smart
certified properties cities solutions development
▪ LogisTech is the first industrial building in
▪ Brings together industry leaders to co-
Singapore awarded Green Mark
create and test innovations within the
Platinum Super Low Energy (SLE) status
Singapore Science Parks
Note: Info as at 30 Sep 2021
(1) Includes three single-tenant properties in Singapore
As c endas Rei t 3Q FY2021 Bus i nes s Updat e 42Committed to Reduce Carbon Footprint
▪ In 2020, common facilities’ electricity usage at Neuros & Immunos was 100% powered by renewable energy
generated from solar farms installed on the roofs of Ascendas Reit’s properties
▪ By 2022, Ascendas Reit aims to power the common facilities’ electricity usage at 3 properties located at one-north
(including Neuros & Immunos) with renewable energy
Neuros & Immunos, Singapore Nexus @one-north, Singapore Nucleos, Singapore
Achieved in 2020 By 2021 By 2022
Power 1,300 four-room Avoid 2.4 mil kg of
HDB flats for a year Carbon Dioxide
As c endas Rei t 3Q FY2021 Bus i nes s Updat e 43Green Buildings
Recent Acquisitions and Development
1 & 3 Thomas Holt Drive, Sydney,
510 Townsend Street, San Francisco, US 505 Brannan Street, San Francisco, US 254 Wellington Road, Melbourne, Australia Galaxis, Singapore
Australia
5-Star Green Star Design & 1 THD: 5.5-Star NABERS Energy
LEED Platinum (Building Design & Construction) BCA Green Mark Platinum
As-Built 3 THD: 4.5-Star NABERS Energy
Under Under Under Under
Completed in
Development Development Development Development
3Q 2021
Grab’s Headquarters, Singapore MQX4, Sydney, Australia 500 Green Road, Brisbane, Australia UBIX, Singapore iQuest@IBP, Singapore
6-Star Green Star Design & As-Built BCA Green Mark GoldPLUS
5-Star Green Star Design & As- BCA Green Mark Platinum
BCA Green Mark GoldPLUS and 5.5 Star NABERS Energy
(target)
Built (target) (target)
(target)
Note: Info as at 30 Sep 2021
As c endas Rei t 3Q FY2021 Bus i nes s Updat e 44Thank you
You can also read