4.6 INITIAL SCREENING OF PUBLIC TRANSPORT SCENARIOS
←
→
Page content transcription
If your browser does not render page correctly, please read the page content below
CREATS Phase I Final Report Vol. III: Transport Master Plan
                                                      Chapter 4: PUBLIC TRANSPORT SYSTEM

4.6 INITIAL SCREENING OF PUBLIC TRANSPORT SCENARIOS

4.6.1 Objective
    The objective of this chapter is to test and to compare the performance of various rail
    transport scenarios which are proposed for the integrated transport master plan. The
    scenarios have the following main objectives :

    • Reduce traffic congestion and travel duration

    The most efficient way to reduce traffic congestion is to encourage modal transfers
    from road transit to high capacity public transport modes (Mass Rapid Transit, Light
    Rail Transit, tram, conventional rail), which are speedier and more comfortable than
    current bus vehicles. Building an integrated public transport network based on a strong
    MRT system is the most effective way to cope with increasing traffic congestion.
    Considering that Greater Cairo is one of the most dense cities in the world, its scarce
    vacant space should in general be devoted to mass public transport systems, which
    consume the least space per passenger. Space consumption has a direct influence on
    the economy of cities. Unrestrained car traffic in dense cities invariably leads to severe
    traffic congestion, which is counterproductive and has high social costs. Cities that
    have managed to upgrade their public transportation networks in pace with the growth
    of population and wealth have largely managed to avoid the worst traffic congestion.
    In order to improve the economy of Cairo there should thus be given strong priority to
    public transportation. In fact, Cairo is an ideal case, for the high population density
    and demand allows for introducing many additional MRT lines with considerable
    financial potential.

    In Cairo an urban highway lane provides a maximum capacity of 2,200 cars/hour,
    which corresponds to 3,300 passengers/hour considering an average vehicle
    occupancy rate of 1.5 person. In comparison, under optimal conditions metro line 1 in
    Cairo can carry up to 74,000 passengers/hours/direction, which is equivalent to a
    highway of 22 lanes.

    • Improve the environment

    The proposed scenarios must contribute to improving the environment in Greater
    Cairo by reducing car and bus vehicle travel, and thus the related pollutant emissions.
    Electrified modes, such as the MRT, tramway and train do not pollute within the city,
    and are therefore not directly harmful to the health and well-being of the population. In
    cities, air pollution causes respiratory problems, especially among babies and
    children, which can lead to a shorter life span; and noise is a main reason for stress.

                                           4 - 73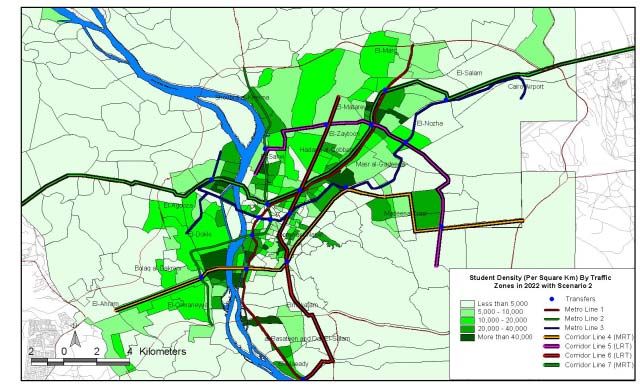
CREATS Phase I Final Report Vol. III: Transport Master Plan
Chapter 4: PUBLIC TRANSPORT SYSTEM

      • Extend public transport services to the new settlements

      The new public transport network has to comply with the land use evolution as
      forecast by the master plan. The new settlements and cities under development must
      be served by cost-efficient public transport modes. Among priority projects are rail
      links to 6th of October City, 10th of Ramadan City and New Cairo.

      • Improve the transport conditions of the poor

      The public transport network has to serve in priority the poor urban areas, where the
      non-motorized population cannot perform long distance trips without public transport.

      • Improve transport accessibility to the main trip generators

      In order to serve a maximum number of travelers, the public transport network must
      serve directly the main trip generators such as dense population and employment
      sectors, most important educational areas and other urban activity centers.

      • Adapt the transport supply to the demand

     The public transport network must cope with the existing and future transport demand
     structure in order to avoid public transport transfers to the car for the same
     origin/destination trips. Furthermore, the cost-efficiency of public transport projects
     (MRT, LRT, tramway and bus priority lanes) should be increased.

      The number of daily motorized trips is forecast to be multiplied by 1.8 between 2001
      and 2022, following a multiplication of 2.6 times between 1973 and 2001 (Tables
      4.6.1 and 4.6.2). The transport supply has to cope with this important past and future
      increase in the transport demand in order to save the city from total congestion.

      Table 4.6.1 Evolution in the Number of Motorized Trips between 1973 and 1998
        SYSTRA Study area                                        1973              1998
        GCMA Population (million) (*)                            5.67               9.92
        Average motorized mobility per person                    0.60               0.91
        GCMA Daily motorized trips (million)                      3.4               9.0
      (*) Above six year
      Data source: Household surveys, 1973 and 1998, by Systra

             Table 4.6.2 Evolution in the Number of Trips between 2001 and 2022
        JICA Study area                                          2001             2022
        Population (million)                                     14.4             20.7
        Average mobility per person                              0.95             1.16
        Daily trips (million)                                    13.7             24.0
      Data source: JICA Study Team

                                                     4 - 74
CREATS Phase I Final Report Vol. III: Transport Master Plan
                                                     Chapter 4: PUBLIC TRANSPORT SYSTEM

    The transport demand in 2022 has been calculated by the project team's CREATS
    model for each origin and destination drawing from the results of the household
    survey and the socioeconomic framework. Similar to the findings of the
    SYSTRA-DRTPC 1998 study, the main trip demand flows are still oriented from the
    suburban areas through the central area of Greater Cairo.

4.6.2 Methodology
    The main transport corridors, which need to be served by efficient public transport
    systems in the year 2022, are identified according to their aptitude of meeting the
    following main criteria :

    • Serve high-density population, employment and student locations.

    • Satisfy the transport demand structure (main traffic flows by origin and
      destination). On this basis the adequate systems (MRT, LRT, conventional rail or
      busways) are proposed according to the required capacities in each corridor.

    • Serve low-income areas in order to provide accessible transport for those who
      cannot afford an automobile.

    • Interconnect with existing MRT lines.

    • Avoid physical constraints such as the Nile River, facilities, buildings and
      infrastructures.

    Four scenarios are developed in this chapter with regard to the above five criteria.
    Following an iterative process evaluation based on the testing and refinement of the
    four scenarios, a core public transport network will be elaborated. In the following
    chapter 4.7, the core network will be subject to a more comprehensive evaluation.

    • Scenario 1 takes into account only the committed projects and is the "reference"
      scenario.

    • Scenario 2 involves a comprehensive public transport network, called the "do
      maximum" scenario, which fully serves all the identified transport corridors in
      2022, based on a MRT and LRT network commonly referred to as the Systra plan.

    • Scenarios 3 and 4 will be determined successively following an analysis of the
      performances of the MRT/LRT network proposed in scenario 2 with regard to the
      above criteria. These scenarios will retain the best features of scenario 2 and will
      suggest other system alternatives according to the required capacities. It should be
      noted that these scenarios also aim at limiting the capital costs.

    Each scenario option will be analyzed and compared in order to select the best corridor
    lines and systems for the optimized core network described in Section 4.7. Please note
    that various bus systems and priority concepts are concurrently integrated in order to
    verify their performance in relation to rail systems.

                                          4 - 75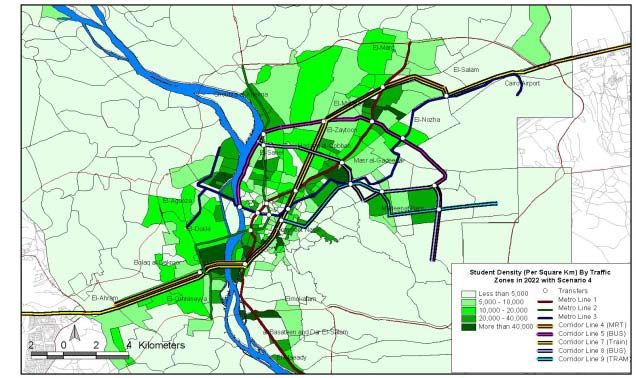
CREATS Phase I Final Report Vol. III: Transport Master Plan
Chapter 4: PUBLIC TRANSPORT SYSTEM

      The development of the scenarios primarily focuses on the introduction of adequate
      high capacity systems (MRT, LRT and busways) on the identified corridors. In
      parallel, the tramway and ENR networks can either be upgraded to an LRT system or
      adapted in order to feed the main high capacity network.

      In order to better evaluate the various public transport systems' aptitude of satisfying
      the demand in different corridor alignments described in the following chapters, the
      main characteristics of the relevant systems are recalled below.

      Ö Busway, Buslanes, Trunk Busway

      y Capacity : Up to 20,000 passengers / hour / direction
      y Maximum speed : 80 km/h
      y Commercial speed : 20-30 km/h
      y Alignment : At grade right-of-way, variable crossing

      Ö Modern tramway

      y Capacity : Up to 10,000 passengers / hour / direction
      y Maximum speed : 50-80 km/h
      y Commercial speed : 20-25 km/h
      y Alignment : At grade right-of-way, mixed crossing

      Ö Light Rail Transit (LRT)

      y Capacity : Up to 30,000 passengers / hour / direction
      y Maximum speed : 80-100 km/h
      y Commercial speed : 20-35 km/h
      y Alignment : At grade right-of-way, viaduct, tunnel

      Ö Mass Rapid Transit (MRT)

      y Capacity : 30-90,000 passengers / hour / direction
      y Maximum speed : 100-150 km/h
      y Commercial speed : 35-60 km/h
      y Alignment : Right-of-way, viaduct, tunnel

      Metro lines 1 and 2 in Cairo belong to the MRT category as they can carry up to
      74,000 and 63,000 passengers/hour/direction respectively under optimal operating
      conditions. However, due to the short distances between stations, the commercial
      speeds of lines 1 and 2 correspond to that of a LRT system. For more details please
      refer to the Technical Report (3) : Urban Public Transport Perspectives.

                                               4 - 76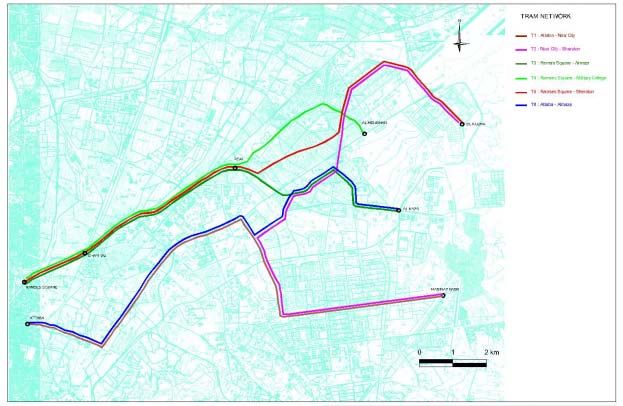
CREATS Phase I Final Report Vol. III: Transport Master Plan
                                                     Chapter 4: PUBLIC TRANSPORT SYSTEM

    In Section 4.7, medium and short term plans will be developed on the basis of the
    refined scenario in 2022, accounting for implementation phasing of the various
    proposed systems.

4.6.3 Scenario 1 : Committed network
(1) Network Description

    The first scenario consists of only the projects which are under construction or certain
    to be realized. They are called the "committed projects" and involve the realization of
    MRT line 3, extension of MRT line 2 to Moneeb, and the construction of a tramway
    line between Helwan station on MRT line 1 to Helwan University (Table 4.6.3 and
    Figure 4.6.1).

    In this scenario, the existing ENR network and other tramway lines remain unchanged.

    This first scenario will be used as a reference scenario; each following scenarios will
    be compared to this scenario in order to evaluate their respective performances.

                          Table 4.6.3 Committed MRT Network
                                 Section                 Length                 Status
       Metro line 1     Helwan – New El Marg             44.0 km               Existing
       Metro line 2     Shobra El Kheima – Giza          18.9 km               Existing
                        suburban
         Extension      Giza suburban – Moneeb            2.1 km        Scheduled: 2004-2005
                        Total                            21.0 km
       Metro line 3     Imbaba / Mohandiseen –           33.0 km               2007-2012
                        Heliopolis / Cairo Airport

                                          4 - 77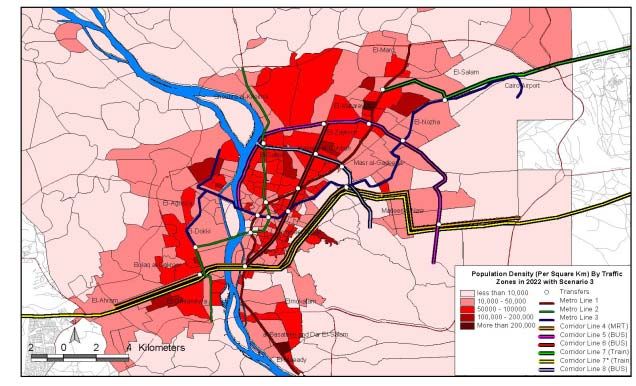
CREATS: Phase I Final Report Vol. III: Transport Master Plan
Chapter 4: PUBLIC TRANSPORT SYSTEM

                                                               Figure 4.6.1 Scenario 1 "Committed Projects"

                                                4 - 78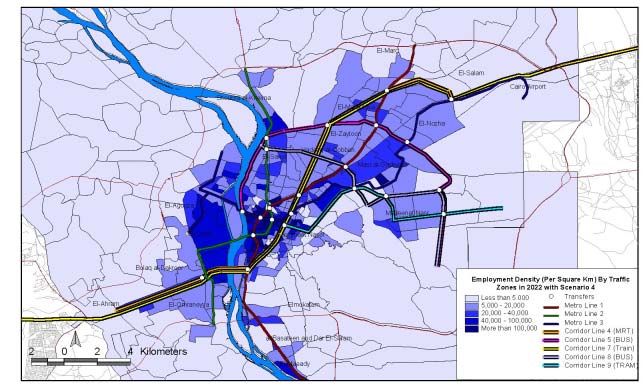
CREATS Phase I Final Report Vol. III: Transport Master Plan
                                                       Chapter 4: PUBLIC TRANSPORT SYSTEM

y MRT supply indicators

The headways of MRT lines 1,2 and 3 are set to 2 minutes during the peak period (Table
4.6.4).

                 Table 4.6.4 Scenario 1, MRT Supply Indicators in 2022
       Line               Mode           Terminals              Peak headway   Average speed
                                     yNew El Marg
          1          MRT                                           2 min           34 km/h
                                     yHelwan
                                     yShobra el Kheima
          2          MRT                                           2 min           38 km/h
                                     yGiza - Moneeb
                                     yCairo Airport
          3          MRT             yImbaba (branch 1)            2 min           38 km/h
                                     yBoolaq (branch 2)
Source: JICA Study Team

y Tramway supply indicators

The tramway headway is constant during both base and future years (Table 4.6.5).

              Table 4.6.5 Scenario 1, Tramway Supply indicators in 2022
   Line                 Line Name                    Length (km)     Average   Average peak
                   (origin / destination)                          comm. speed hour headway
                                                                     (km/h)        (min)
     1    El Nozha – Ramses Sq.                         15.93           17           12
     2    Al Merghani – Ramses Sq.                     12.40            17           12
     3    Abd El Aziz Fahmy – Ramses Sq.                11.32           17           12
     4    10th Region – Ramses Sq.                      18.16           15           20
     5    Al Maza – Ramses Sq.                          12.50           17           20
     6    Al Maza – Al Matareya Sq.                     6.70            15           15
    34    Sheraton – Abaseya                            11.97           15           33
    35    Al Matareya – Abaseya                         9.65            15           13
    36    Al Matareya – 10th region                    14.35            15           17
    36'   Al Matareya Station - 8th Region              11.33           15           22
    40    Tebeen – Helwan                               11.13           15           38
    40'   Tebeen - Al Ezba                               9.90           15           40
    41    15 May – Tebeen                              16.68            15           35
    42    15 May – Helwan                               13.68           15           31
     5    Esmailia Square – Esko                       10.19            15           36
    12    10th Region – Alf Maskan                      13.99           15           22
    32    10th Region – Al Sheraton                     16.34           15           19
    33    Abaseya – Alf Maskan                           9.50           15           50
       New Helwan – Helwan univ. line                   3.60            15           50
            Total and averages                         229.32          15.4          26
Source: JICA Study Team

                                            4 - 79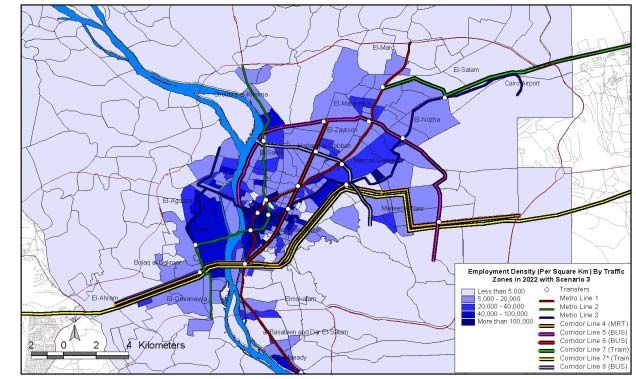
CREATS Phase I Final Report Vol. III: Transport Master Plan
Chapter 4: PUBLIC TRANSPORT SYSTEM

      The rolling stock required for the short Helwan extension's operations will be
      compensated by a decrease in supply of the other tramway lines in this sector.

      y ENR supply indicators

      The suburban train service will also remain unchanged in this scenario (Table 4.6.6).

                Table 4.6.6 Scenario 1, Suburban Train Supply Indicators in 2022
      Line                Line Name                     Length      Average speed     Peak hour
             (origin, intermediate, destination)         km            (km/h)       headways (min)
        1    Cairo-Qalyob                                14.0            25              40
        2    Cairo-Qalyob-Qanater                        23.5            42              30
        3    Cairo-Qalyob-Shebeen                        32.0            38              30
        4    Marg-Shebeen El Qanater                     20.0            54              30
        5    Ain Shams-El Robaiky                        45.0            14              60
        6    Cairo-Imbaba-Manashi                           20.0         34              30
        7    Cairo-Maraziek                                 37.0         22              70
        8    Giza Suburban-6th of October City              67.0         30               -
                    Totals and Averages                     258.5        32              41
      Source: JICA Study Team

 (2) Population, Employment and Student Densities

      The results below are shown in Figures 4.6.2 through 4.6.4 in following pages.

      In 2022, MRT lines 1 and 2 continue to serve many densely populated areas in Cairo.
      Namely, Boolaq and Giza on the West bank. On the East bank, they serve the important
      Ain Shams and Shobra districts in addition to the Gisr Al-Suweis St. axis. However,
      between Ain Shams and Shobra there is an very dense area of Cairo which is not served,
      i.e. on either side of the Port Said street axis, as far as Mostorod Bahtim on the West side.

      Other very important sectors which are not served in the reference scenario are :
      Al-Haram St., Ain Shams East, southern part of Downtown and the western part of Nasr
      City.

      Line 3 serves the high-density areas of Imbaba and Abaseya on its West and central
      sections. It should be noted that on the East section after Ain Shams to the airport, line 3
      crosses relatively low-density areas. This raises a question about the importance of this
      section compared to other alternative corridors, and will be studied in more detail in the
      demand analysis.

      As to the ENR network, lines 1 (Cairo-Qalyob) and 6 (Cairo-Imbaba-El Manashi) serve
      the highly populated areas of Shobra on the East bank, and Imbaba and Giza on the West

                                                   4 - 80
CREATS Phase I Final Report Vol. III: Transport Master Plan
                                                   Chapter 4: PUBLIC TRANSPORT SYSTEM

bank. The headways and regularities of the ENR lines would have to be improved
considerably in order to satisfy the needs for urban travel.

With the exception of the five tramway lines of the Heliopolis network serving Ramses
Square passing through Abaseya, the tramway network in Cairo is confined to areas with
relatively low population densities, i.e. in Heliopolis and Helwan.

In terms of employment densities, MRT line 2 has an important role as it serves the very
dense areas of Doqi, Al-Malik Faisal St., CBD and Shobra Al-Kheima. Line 1 serves an
important work area in Maadi, CBD and Abaseya. Line 3 has the strongest role as it
serves an important job sector stretching from Heliopolis to the airport in addition to
Giza-Doqi and CBD.

Lines 1 and 6 of the ENR network cross the high employment sectors of Mohandiseen,
CBD, Shobra and Qalyob.

The tram network in Heliopolis also has an important role for serving high employment
density areas, namely Downtown and Heliopolis.

Important job sectors, which are not served by a high capacity system in the reference
scenario, are namely : Old Cairo, Giza and Al-Haram St.

As for the student densities, El Azar is the only important sector which is not already
served by MRT lines 1, 2 and 3.

Table 4.6.7 summarizes the number of the inhabitants, jobs and student students served
within a distance of 800 meters from the MRT lines.

    Table 4.6.7 Scenario 1, Socioeconomic Performance of Each Line in 2022
       Line               Population        Employed        Students    Total Ratio (*)
         1                  1 073 525           475 617         362 667      0.18
         2                    892 245           496 638         314 165      0.17
         3                  1 130 199           729 072         402 710      0.23
   Total network            3 095 969         1 701 327       1 079 542
  TOTAL study area         20 721 175         6 966 250       5 771 269
(*) Total ratio = Pop./total pop. + Emp./total emp. + Stu./total stu.

The ratio allows to determine which line has the best performance for all three
socioeconomic factors. As it can be seen, line 3 obtains the highest ratio and is the best
line in terms of number of population, employed and students served.

                                        4 - 81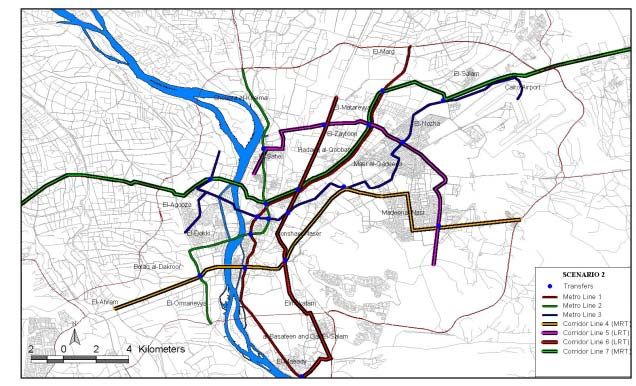
CREATS: Phase I Final Report Vol. III: Transport Master Plan
Chapter 4: PUBLIC TRANSPORT SYSTEM

                                                               Figure 4.6.2 Scenario 1 and Population Densities

                                             4 - 82
CREATS: Phase I Final Report Vol. III: Transport Master Plan
Chapter 4: PUBLIC TRANSPORT SYSTEM
Figure 4.6.3 Scenario 1 and Employment Densities
4 - 83CREATS: Phase I Final Report Vol. III: Transport Master Plan
Chapter 4: PUBLIC TRANSPORT SYSTEM
Figure 4.6.4 Scenario 1 and Student Densities
4 - 84CREATS Phase I Final Report Vol. III: Transport Master Plan
Chapter 4: PUBLIC TRANSPORT SYSTEM
(3) Transport demand
The average daily public transport trips expected in 2022 are shown in Table 4.6.8 by
modes.
Table 4.6.8 Scenario 1, Demand Simulations in 2022
Average daily passengers (million)
Modal Split Modal Split
Mode 2001 2022 % Increase
(%) (%)
Formal PRT (*) 4.299 32.3 3.354 19.1 -22
Informal PRT (**) 6.696 50.2 6.591 37.5 -2
TOTAL PRT 10.995 82.5 9.945 56.5 -10
MRT 2.021 15.2 6.238 35.5 209
ENR 0.132 1.0 0.887 5.0 570
TOTAL TRAM 0.171 1.3 0.509 2.9 197
Ferry 0.010 0.1 0.017 0.1 74
TOTAL 13.329 100.0 17.596 100.0
(*) CTA and GCBC (**) Shared taxis and private mini buses. PRT: Public Road Transport.
In the reference scenario between 2001 and 2022, the most important change in the
transport demand in Cairo is a 570% increase of the ENR ridership. This strong increase
is predictable as the ENR network offers increasingly attractive travel speeds on
important corridors to the CBD while the speeds on the roads decrease significantly. In
fact, a general shift from private to public transport can be expected due to the important
drop in the average speed on the network, as the number of cars drivers increase due to
an increased wealth.
The MRT traffic will increase by 209% while the traffic of the road based public
transport modes will drop by 10%. The MRT will increase its market share, at the
expense of regular CTA buses, which will offer lower commercial speeds, but also at the
expense of the shared taxi and the private car. Among others, line 3 diverts an important
traffic along the heavy Gisr Al-Suweis St. shared taxi corridor. This is a positive
evolution since the shared taxi is an important cause of the traffic congestion due to its
low capacity (in terms of carried passenger per m²). It should however be underlined that
the road network will be totally saturated in the meantime due to the increased private car
traffic.
The trip volume of the MRT will continue to increase because of the attractiveness of
this mode, which is the fastest in Greater Cairo. Nevertheless, the comfort and safety will
degrade due to a high concentration of passengers reaching 8 per square meter. The
headway should therefore be increases to the maximum authorized as well as the MRT
capacity, e.g. with double-deck rolling stock on line1.
The trip volume forecasts for the 3 MRT lines proposed in scenario 1 are shown in the
following Table 4.6.9.
4 - 85CREATS Phase I Final Report Vol. III: Transport Master Plan
Chapter 4: PUBLIC TRANSPORT SYSTEM
Table 4.6.9 Scenario 1, MRT Daily Trips Demand in 2022
Boarding Pass-km Pass/km Max loaded Section one-way
Line
Pass(million) (million) (1,000) section traffic
1 2.40 27.27 54.9 Hadayek 742 000
2 1.76 11.77 83.8 Mubarak 630 000
3 2.07 16.35 69.0 Esaf 590 000
TOTAL 6.23 55.39 - - -
Source: JICA Study Team
The peak hour capacities of the MRT lines 1, 2 and 3 should be at least 10% of the above
one-way traffic volumes in order to cope with the demand. As MRT systems can cater
30-60,000 pass/hour/direction with single-deck rolling stock, this means that the MRT
lines 1 and 2 with current operations will be unable to meet the demand during the peak
hours in 2022. On this basis, we can conclude that all three lines require high capacity
MRT systems, among which line 1 should definitely be a double-decker. Without
improved maintenance and supply measures, the operation of the lines 1 and 2 will be
disturbed.
In terms of utilization
measured in passengers per
km of line, MRT line 2
obtains excellent results. In
fact, all three lines, exceed
by far the current levels for
the most heavily loaded
MRT systems in the world.
The highest currently is the
Hong Kong metro with 53.2
thousand passengers per km.
Metro lines 1 and 2 in Cairo
currently operate with
maximum loads of
approximately 35 thousand
passengers per km.
From Figure 4.6.5 it can be
seen that all sections of the
MRT lines are heavily and Source: JICA Study Team
reasonably uniformly Fig 4.6.5 Scenario 1 Bandwidth Diagram in 2022
loaded, except for the
branch of line 3 connecting to the airport.
From the spider diagram in Figure 4.6.6 we can see the important public transport flows
(or "desire lines") which are not served by the three MRT lines, and which should be
taken into consideration in the following scenarios. They are as follows :
4 - 86CREATS Phase I Final Report Vol. III: Transport Master Plan
Chapter 4: PUBLIC TRANSPORT SYSTEM
• Along the 26th July corridor until metro line 3
• Along Al-Malik Faysal and Al-Haram Streets, and between this area and the
intersection between 26th July corridor and the Desert Road
• Abaseya – Shobra and Abaseya – Al-Qal'a
• Heliopolis – Shobra Al-Kheima.
Source: JICA Study Team
Figure 4.6.6 Scenario 1 Spider Diagram in 2022
(4) Low Income Areas
A special attention must be given to serving the low-income areas of Cairo with a high
capacity transport system. In this way, it is ensured that no people are actually hindered
from being active due to the lack of a car.
In 2022, a very important range of low-income areas, with high population and job
densities, are totally neglected in the reference scenario. These areas have a very strong
potential for a high capacity system and concern : Mostorod Bahtim and Al-Zawiya in
the northern part of Cairo, and to a lesser extent - due to lower job densities – the
southern part of Downtown and Mokkatam (Figure 4.6.7).
4 - 87CREATS Phase I Final Report Vol. III: Transport Master Plan
Chapter 4: PUBLIC TRANSPORT SYSTEM
Source: JICA Study Team
Figure 4.6.7 Scenario 1, Household Density by Income Levels in 2022
(5) Interfaces
In addition to the interfaces with line 1 and 2 in CBD, the MRT line 3 has been developed
in due consideration of providing a connection with the tramway network in Heliopolis,
thus strengthening both systems. The tramway becomes both complementary to line 3
for serving CBD, and for feeding it for longer trips, in addition to ensuring local trips in
Heliopolis and Nasr City.
4.6.4 Scenario 2 : “Do Maximum Scenario”
In addition to the five main criteria for developing the scenarios, scenario 2 takes into
account the following objectives :
y Implement the most cost-effective rail systems (MRT or LRT) on the identified
transportation corridors in order to reduce as fast as possible the road congestion in an
environmentally sustainable way.
y Decrease the headways of MRT lines 1 and 2 to two minutes in order to reduce the
current congestion observed on these lines.
4 - 88CREATS Phase I Final Report Vol. III: Transport Master Plan
Chapter 4: PUBLIC TRANSPORT SYSTEM
y Rehabilitate the existing tramway network in complement with the MRT network.
y Improve the existing suburban rail services.
y Create new track or strongly rehabilitate the existing rail track in order to link
effectively and speedily the 6th of October and 10th of Ramadan cities.
y Reorganize the road based public transport network (buses and shared taxi) in
coherence with the proposed rail network.
(1) Network Description
y The MRT/LRT network
Following the analysis of scenario 1 with regard to socioeconomic and structural demand
issues, additional mass rapid transport corridors are proposed :
- Corridor line 4: a diametrical corridor crossing the central area and linking peripheral
activity centers (Nasr city) with the CBD and opposite peripheral sectors (Giza El
Ahram).
- Corridor line 5 : a circumferential corridor linking peripheral activity centers (Nasr
city, Heliopolis, Shobra El Kheima) and connecting to and relieving the radial MRT
lines in the central area of Cairo.
- Corridor line 6 : a diametrical corridor linking a peripheral area (Port Said street) and
activity centers (CBD, Al Azar) with the peripheral activity center of Maadi. This
corridor also relieves the MRT line 1 which is congested in the central section.
- Corridor line 7 : a suburban link between 6th of October and 10th of Ramadan cities
which crosses the center of Cairo.
These corridors ensure connections between the main activity centers and the central
area, and involves 4 new lines with regard to the reference scenario. There will be 6 lines
in total as shown in Table 4.6.10, also commonly referred to as the Systra plan.
Table 4.6.10 Scenario 2, MRT/LRT Network Description in 2022
Line Type Length Starting at Passing through Ending at
1 MRT 44 km New El Marg CBD area Helwan
Shobra el Kheima
2 MRT 23 km CBD area Giza – Moneeb
(ring road)
Imbaba (branch 1)
3 MRT 33 km Cairo Airport CBD- Mohandiseen
Boolaq (branch 2)
Abaseya-Roda
C4 MRT 27 km Nasr City Giza Pyramids
Island
C5 LRT 22 km Nasr City Heliopolis Shobra el Kheima
C6 LRT 20 km Maadi CBD (East) Port Said Street
C7 MRT 96 km 6th of October Cairo 10th of Ramadan
Source: JICA Study Team
4 - 89CREATS Phase I Final Report Vol. III: Transport Master Plan
Chapter 4: PUBLIC TRANSPORT SYSTEM
Drawing from the recommendations of the Systra study, these corridor lines 4, 5 and 6
will initially be tested as respectively MRT and two LRT systems, with corresponding
service levels in the CREATS model. Corridor line 7 is described in more detail in the
paragraph concerning the ENR suburban network. In this scenario, the total line length
of the rail network amounts to 265 kilometers, including MRT lines 1 and 2 (Figure
4.6.8).
4 - 90CREATS: Phase I Final Report Vol. III: Transport Master Plan
Chapter 4: PUBLIC TRANSPORT SYSTEM
Figure 4.6.8 Scenario 2 Network in 2022
4 - 91CREATS Phase I Final Report Vol. III: Transport Master Plan
Chapter 4: PUBLIC TRANSPORT SYSTEM
y MRT/LRT supply indicators
The MRT/LRT network supply characteristics of scenario 2 are shown in Table 4.6.11.
Table 4.6.11 Scenario 2, MRT/LRT Supply Indicators in 2022
Headway Average
Line Mode Terminals Length
(Peak period) speed
y New El Marg
1 MRT 44 km 2 min 34 km/h
y Helwan
y Shobra el Kheima
2 MRT 23 km 2 min 38 km/h
y Giza - Moneeb
y Cairo Airport
3 MRT y Imbaba (branch 1) 33 km 2 min 38 km/h
y Boolaq (branch 2)
y Nasr City
C4 MRT 27 km 2 min 38 km/h
y Giza Pyramids
y Nasr City
C5 LRT 22 km 2 min 28 km/h
y Shobra el Kheima
yMaadi
C6 LRT 20 km 2 min 28 km/h
yPort Said Street
y 6th of October
C7 MRT 96 km 10 min 80 km/h
y 10th of Ramadan
Total and averages 265 km 3.1 min 41 km/h
Source: JICA Study Team
y The tramway network
The tramway network in Cairo is currently operated on 18 lines with 89 km of tracks. A
low service level and extensive ineffectual common sections of lines characterize each
line.
Rehabilitation of the existing tramway network, notably the segregated tracks, should be
considered as a good opportunity to obtain an efficient and modern mode of transport at
a low cost.
In the frame of a tramway network reorganization, all the scenarios (except Number 1)
recommend rehabilitation and segregation of the tramway tracks as well as priority at
crossings during operations. As a result, the tramway will offer higher commercial
speeds, reach a higher level of availability and increase its ridership.
The reorganization of the tramway network has the following objectives :
• serve and connect the main peripheral trip generators;
• feed the MRT/LRT network from dense areas not directly served by these systems
and to complement the overall transport network of GC; and,
4 - 92CREATS Phase I Final Report Vol. III: Transport Master Plan
Chapter 4: PUBLIC TRANSPORT SYSTEM
• relieve the MRT network along the main corridors where the demand exceeds the
supply, e.g. the present case for line 1 between Matareya and Tahrir. The tramway
network has to serve short distance trips whereas the MRT has to serve long-distance
ones.
The proposed tramway network is based on a rationalization of the existing lines in order
to make it faster and more attractive. The headways of the lines should be low enough to
serve a maximum number of passengers and to ensure the regularity of the system so that
a timetable is unnecessary. As with the MRT, people should know that a tramway is
always available within short time. In this regard, the headway should not exceed 10
minutes during the day.
Tramway lines should be protected against car traffic with a physical barrier, such as the
construction of a curb all along the tracks. At crossings, where no physical barrier is
possible, traffic lights should be implemented and their efficiency ensured by police
officers.
Following the reorganization and rationalization of the existing lines, the proposed
tramway network is shown in Table 4.6.12.
Table 4.6.12 Scenario 2, Tramway Network Description in 2022
Line Length (km) Starting at Ending at
T1 14.30 Attaba Nasr City
T2 15.90 Sheraton Nasr City
T3 13.20 Ramses Almaza
T4 11.20 Ramses Military college
T5 13.00 Ramses Sheraton
T6 10.20 Attaba Almaza
T7 11.10 Helwan Tebbin
T8 13.70 Helwan 15th May
T9 3.90 Helwan Helwan University
Source: JICA Study Team
The proposed tramway lines can be classified according to their functional
characteristics :
y Feeder tramway lines to the MRT lines from remote areas : T1 and T2 connect to M3;
T3 connects to M3 and M1; T7, T8 and T9 connect to M1 Helwan terminal.
y Main tramway lines serving important areas not served by the MRT : T8,T1 and T2.
y Tramway lines coping with the short distance demand and relieving congested MRT
lines : T3, T4 and T5.
4 - 93CREATS Phase I Final Report Vol. III: Transport Master Plan
Chapter 4: PUBLIC TRANSPORT SYSTEM
In this scenario, new tracks are planned along El Azhar Street, which is consistent with
the rehabilitation of the El Azhar street area and the demolition of the El Azhar viaduct.
The tramway network of scenario 2 is shown in Figures 4.6.9 and 4.6.10.
y Tramway supply indicators
The tramway network supply characteristics are shown in Table 4.6.13.
Table 4.6.13 Scenario 2, Tramway Supply Indicators in 2022
Average comm. Average peak hour
Line Line Name Length (km)
Speed (km/h) headway (min)
Attaba
T1 14.30 22 km/h 4 min
Nasr City
Sheraton
T2 15.90 22 km/h 4 min
Nasr City
Ramses
T3 13.20 22 km/h 4 min
Almaza
Ramses
T4 11.20 22 km/h 4 min
Military college
Ramses
T5 13.00 22 km/h 4 min
Sheraton
Attaba
T6 10.20 22 km/h 4 min
Almaza
Helwan
T7 11.10 22 km/h 6 min
Tebbin
Helwan
T8 13.70 22 km/h 6 min
15th May
Helwan
T9 3.90 22 km/h 6 min
Helwan University
Total and averages 106.5 km 22 km/h 4.7 min
Source: JICA Study Team
4 - 94CREATS: Phase I Final Report Vol. III: Transport Master Plan
Chapter 4: PUBLIC TRANSPORT SYSTEM
Figure 4.6.9 Scenario 2 Tram Network in Heliopolis in 2022
4 - 95CREATS Phase I Final Report Vol. III: Transport Master Plan
Chapter 4: PUBLIC TRANSPORT SYSTEM
Figure 4.6.10 Scenario 2, Tram Network in Helwan in 2022
4 - 96CREATS Phase I Final Report Vol. III: Transport Master Plan
Chapter 4: PUBLIC TRANSPORT SYSTEM
y The ENR suburban network
A project, which is currently under investigation by ENR, will be tested in this scenario,
the "wings" line. It concerns a MRT connection between 6th of October and 10th of
Ramadan cities, which runs from Cairo station and follows the existing railway until
Imbaba, then turns right at the 26th of July corridor. This line connects with MRT lines 1
and 2 at Mubarak Station and MRT line 3 at Imbaba (see corridor line 7 in Table 4.6.14).
Consequently, the existing line 5 (Ain Shams – El Robaiky) is upgraded to line 7, and
line 8 (Cairo – 6th of October) is cancelled.
This scenario also takes into account the rehabilitation of the other existing suburban
lines with an important upgrading of the headway to 10 minutes.
Table 4.6.14 Scenario 2, Suburban Rail Network Description in 2022
Line Length (km) Starting at Ending at
R1 14.0 Cairo Qalyob (to Alexandria)
R2 23.5 Cairo Qalyob / Qanater El Khayreya
R3 32.0 Cairo Qalyob / Shebeen El Qanater
R4 20.0 El Marg Shebeen El Qanater
Corridor line 7 96.0 6th of October City 10th of Ramadan
R6 20.0 Cairo Imbaba / El Manashi
R7 37.0 Cairo El Maraziek
Total 242.5
Source: JICA Study Team
y ENR supply indicators
The suburban rail network supply characteristics of scenario 2 are shown in Table 4.6.15.
Table 4.6.15 Scenario 2, Suburban Rail Supply Indicators in 2022
Line Line Name Length Average speed Peak hour
(origin, intermediate, destination) (km) (km/h) headways
(min)
R1 Cairo / Qalyob (to Alexandria) 14.0 40 10
R2 Cairo / Qalyob / Qanater El Khayreya 23.5 40 10
R3 Cairo / Qalyob / Shebeen El Qanater 32.0 40 10
R4 El Marg / Shebeen El Qanater 20.0 40 10
C7 6th of October / 10th of Ramadan 96.0 80 10
R6 Cairo / Imbaba / El Manashi 20.0 40 10
R7 Cairo / El Maraziek 37.0 40 10
Totals and Averages 242.5 46 10
Source: JICA Study Team
4 - 97CREATS Phase I Final Report Vol. III: Transport Master Plan
Chapter 4: PUBLIC TRANSPORT SYSTEM
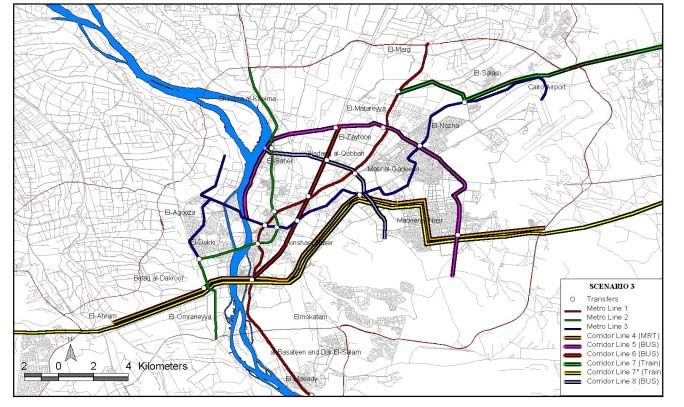
(2) Population, Employment and Student Densities
In the reference scenario we identified various sectors in Greater Cairo with high
population, employment and student densities which were not served by the 3 MRT lines
(Figures 4.6.11, 4.6.12 and 4.6.13).
The corridors of public transport systems 4, 5 and 6 have been defined accordingly in
due respect of the remaining criteria.
The corridor line 4 serves the important Al-Haram St. corridor which has high
population and job densities, but crosses a low density sector South of Downtown and
West of Nasr City. In Nasr City, an important job sector is served, but this is also
achieved with the next proposed line 5 corridor. This is the circumferential line which
crosses important population and job sectors in Heliopolis, Mostorod Bahtim and Shobra
El Kheima.
Corridor line 6 corridor serves the high-density population end employment corridor
along the Port Said street axis and Mostorod Bahtim. This line also successfully crosses
the Downtown sector which has a high population and student density as well as low
incomes.
Table 4.6.16 summarizes the number of inhabitants, jobs and student students served
within a distance of 800 meters from the network corridors.
Table 4.6.16 : Scenario 2, Socio-economic Performance of Each Line in 2022
Line Population Employed Students Total Ratio (*)
1 1 073 525 475 617 362 667 0.18
2 1 021 347 566 672 358 488 0.19
3 1 130 199 729 072 402 710 0.23
C4 578 280 205 454 249 730 0.10
C5 803 023 232 542 210 639 0.11
C6 2 050 359 637 537 567 155 0.29
C7 2 155 915 773 200 473 338 0.46
Total network 8 812 648 3 620 094 2 624 727
TOTAL study area 20 721 175 6 966 250 5 771 269
(*) Total ratio = Pop./total pop. + Emp./total emp. + Stu./total stu.
As seen from the ratios, corridor lines 6 - and especially line 7 serving the new cities -
are very interesting options. For both lines, the number of population served is above all
very important. Corridor lines 4 and 5 show moderate results.
Please note that the above data of corridor line 7 include the population, employed and
students in the new cities 6th of October and 10th Ramadan.
4 - 98CREATS: Phase I Final Report Vol. III: Transport Master Plan
Chapter 4: PUBLIC TRANSPORT SYSTEM
Figure 4.6.11 Scenario 2 and Population Densities in 2022
4 - 99CREATS: Phase I Final Report Vol. III: Transport Master Plan
Chapter 4: PUBLIC TRANSPORT SYSTEM
Figure 4.6.12 Scenario 2 and Employment Densities in 2022
4 - 100CREATS: Phase I Final Report Vol. III: Transport Master Plan
Chapter 4: PUBLIC TRANSPORT SYSTEM
Figure 4.6.13 Scenario 2 and Student Densities in 2022
4 - 101CREATS Phase I Final Report Vol. III: Transport Master Plan
Chapter 4: PUBLIC TRANSPORT SYSTEM
(3) Transport Demand
The results of the demand simulation for the scenario 2 are shown in Table 4.6.17.
Table 4.6.17 Scenario 2, Demand Simulations in 2022
Average daily passengers (million)
Mode
Modal Split Modal Split
2001 2022 % Increase
(%) (%)
Formal PRT (*) 4.299 32.3 2.445 13.3 -43
Informal PRT (**) 6.696 50.2 5.287 28.7 -21
TOTAL PRT 10.995 82.5 7.732 42.0 -30
MRT/LRT 2.021 15.2 9.076 49.3 349
ENR 0.132 1.0 1.124 6.1 749
TOTAL TRAM 0.171 1.3 0.460 2.5 169
Ferry 0.010 0.1 0.003 0.0 -67
TOTAL 13.329 100.0 18.396 100.0
(*) CTA and GCBC (**) Shared taxis and private mini buses. PRT : Public Road Transport.
The positive tendencies for the public transport network observed in the reference
scenario will be considerably reinforced in scenario 2. The ENR ridership will increase
even more thanks to, on the one hand, the introduction of a MRT system on corridor line
7, which connects 6th of October City with 10th of Ramadan via CBD, and on the other
hand, the general upgrading of the network's headways to 10 minutes. These
improvements lead to an increased ridership in public transport of 992,000
passengers/day compared to the reference scenario.
The MRT/LRT increases its modal share so as to become the most important public
transport mode in Greater Cairo.
The tram network looses ridership to corridor line 5 which intersects the MRT line 3 in
the middle of the Heliopolis area. In the meantime, however, the tram network gains
considerably more in ridership due to the general increase in mobility in both Helwan
and Heliopolis.
The trip volume forecasts for the seven MRT/LRT lines proposed in scenario 2 are
shown in Table 4.6.18.
4 - 102CREATS Phase I Final Report Vol. III: Transport Master Plan
Chapter 4: PUBLIC TRANSPORT SYSTEM
Table 4.6.18 Scenario 2, MRT/LRT Daily Trips Demand in 2022
Boarding Pass-km Pass/km Section one-way
Line Max loaded section
Pass(million) (million) (1,000) traffic
1 2.504 25.344 58.2 Murbarak 608,000
2 1.681 11.395 73.1 Murbarak 538,000
3 1.875 13.999 62.5 Imbaba 530,000
C4 1.254 10.169 46.4 El Haram 393,000
C5 0.945 5.492 47.3 El Matareya 292,000
C6 0.817 4.987 43.0 Magles El Shaab 230,000
C7 0.547 12.998 6.1 6th of October 222,790
TOTAL 9.623 84.383 - - -
Source: JICA Study Team
Compared to the reference scenario, line 1 has better operational results, with a higher
demand and utilization per km and lower peak hour traffic.
In terms of utilization, MRT line 2 remains the most heavily loaded, each line, with the
exception of C7, performing better than current levels for MRT systems in the world. In
comparison, MRT lines 1 and 2 currently have a high utilization around 35 thousand
passengers/km.
In order to cope with the peak hour traffic on the most heavily loaded sections, the
proposed corridor line 4 will require a MRT system running at 3 minutes headway, and
the corridor lines 5, 6 and 7 will require LRT systems.
The bandwidth diagram output from the CREATS model, shows the load on each MRT
and LRT proposed corridor projects. It clearly indicates that there is a stronger potential
for creating a corridor which combines the West section of line 4, i.e. essentially the
Al-Haram St., with the North section of line 6 (Figure 4.6.14).
The link to 6th of October and 10th of Ramadan is tested as a MRT line in this scenario. It
shows strong potential on the West section along the 26th July corridor identified in
scenario 1. On the far West section to 6th of October, and the East section between Ain
Shams and 10th of Ramadan, the loads do not appear sufficient for a MRT system. This is
confirmed in the previous analysis concerning the daily trips demand as the total number
of daily trips on this line is too low for a MRT. A more conventional type of suburban
express rail system should be considered instead. It should provide sufficient capacity to
cater approximately 20,000 passengers/hour/direction during the peak on the most
loaded section in 6th of October. As it can be seen from Figure 4.6.15, The MRT/LRT
network in scenario 2 satisfies all the main public transport flows in Greater Cairo.
4 - 103CREATS Phase I Final Report Vol. III: Transport Master Plan
Chapter 4: PUBLIC TRANSPORT SYSTEM
Source: JICA Study Team
Figure 4.6.14 MRT Bandwidth Diagram of Scenario 2 in 2022
Source: JICA Study Team
Figure 4.6.15 Scenario 2 Spider Diagram in 2022
4 - 104CREATS Phase I Final Report Vol. III: Transport Master Plan
Chapter 4: PUBLIC TRANSPORT SYSTEM
(4) Low Income Areas
The central section of corridor line 4, and almost the totality of line 6, serve the poor
income areas of Cairo and should be considered as interesting options. The west section
of corridor line 7, between Imbaba and 6th of October City crosses a vast low-income
area which could obtain direct access into Cairo.
(5) Interfaces
The highest level of supply in urban transportation is obtained when all modes are
considered together as a single network. Creating as many interfaces as possible and
coherency between the modes is essential for obtaining an effective network. Table
4.6.19 summarizes the interfaces of the proposed corridor lines.
Table 4.6.19 Interfaces of Scenario 2 in 2022
Line Number of connections by line(1) Total
1 2 x M2, 1 x M3, 1 x C4, 1 x C5, 1 x C6, 4 x C7 10
2 2 x M1, 1 x M3, 1 x C4, 1 x C5, 1 x C7 6
3 1 x M1, 1 x M2, 1 x C4, 1 x C5, 1 x C6, 2 x C7 7
C4 1 x M1, 1 x M2, 1 x M3, 1 x C5, 1 x C6 5
C5 1 x M1, 1 x M2, 1 x M3, 1 x C4, 1 x C6, 1 x C7 6
C6 1 x M1, 1 x M3, 1 x C4, 1 x C5, 1 x C7 5
C7 4 x M1, 1 x M2, 2 x M3, 1 x C5, 1 x C6 9
TOTAL 48
(1) For example, Metro Line 3 has one connection (joint station) point each with Metro Line 1, Metro Line 2,
Corridor Line 4, Corridor Line 5 and Corridor Line 6, as well as two connections with Corridor Line 7. The total
number of connections with other rail lines is seven (refer Figure 4.6.8 for depiction of lines).
Source: JICA Study Team
In most cases, the CBD can be reached from all parts of GC directly with no transfer, or
with only one transfer among the public modes. This shows the good performance of the
whole PT network.
(6) Physical Constraints
All of the proposed corridor lines follow the main road corridors in Cairo with the least
interference with underground facilities and buildings. Furthermore on various sections
they employ already existing tracks or right-of-ways.
4.6.5 Scenario 3
(1) Network Description
y The MRT/LRT/busway network
4 - 105CREATS Phase I Final Report Vol. III: Transport Master Plan
Chapter 4: PUBLIC TRANSPORT SYSTEM
Following an analysis of the performance of the various proposed transport corridors and
systems in scenario 2, we arrive at the following adaptations for The MRT/LRT network:
• The branch 2 of line 3 is extended to Behooth station on the line 2.
• The South section of Corridor line 6 is curtailed so as to connect it to line 1 and West
of corridor line 4 at Sayeda-Zeinab.
• Corridor line 5 is extended to 15th of May Bridge.
• As a part of a step-down process, corridor lines 5 and 6 are tested as busways instead
of LRT systems.
• Corridor line 7 is replaced by 7* which connects the 6th of October to 10th of Ramadan
via the South part of Cairo in the same corridor as line 4.
• In the same time, the MRT system in this corridor is replaced with a conventional
suburban train.
• The East section of corridor line 7 from Ain Shams to 10th of Ramadan is maintained.
• A new corridor line C8 with a busway system is introduced from Nasr City to Shobra
in order to satisfy the demand observed on this axis.
The proposed scenarios are summarized in Table 4.6.20 and depicted in Figure 4.6.16.
Table 4.6.20 Scenario 3, Network Description in 2022
Line Type Length Starting at Passing through Ending at
1 MRT 44 km New El Marg CBD area Helwan
2 MRT 23 km Shobra el Kheima CBD area Giza – Moneeb
Imbaba (branch 1)
3 MRT 34 km Cairo Airport CBD- Mohandiseen
Behoos (branch 2)
Abaseya-Roda
C4 MRT 27 km Nasr City Giza Pyramids
Island
15the of May
C5 Busway 24 km Nasr City Heliopolis
Bridge
C6 Busway 10 km Sayeda-Zeinab CBD (East) Port Said Street
Express Abaseya-Roda
C7* 102 km 6th of October 10th of Ramadan
train Island
C8 Busway 9 km Nasr City Abaseya Shobra
Source: JICA Study Team
4 - 106CREATS: Phase I Final Report Vol. III: Transport Master Plan
Chapter 4: PUBLIC TRANSPORT SYSTEM
Figure 4.6.16 Scenario 3 network in 2022
4 - 107CREATS Phase I Final Report Vol. III: Transport Master Plan
Chapter 4: PUBLIC TRANSPORT SYSTEM
y MRT/LRT/busway supply indicators
The MRT network supply characteristics of scenario 3 are shown in Table 4.6.21.
Table 4.6.21 Scenario 3 : Network Supply Indicators in 2022
Headway Average
Line Mode Terminals Length
(Peak period) speed
y New El
1 MRT 44 km 2 min 34 km/h
y Marg Helwan
y Shobra el Kheima
2 MRT 23 km 2 min 38 km/h
y Giza – Moneeb
y Cairo Airport
3 MRT y Imbaba (branch 1) 34 km 2 min 38 km/h
y Behoos (branch 2)
y Nasr City
C4 MRT 27 km 2 min 38 km/h
y Giza Pyramids
y Nasr City
C5 Busway 24 km 2 min 32 km/h
y 15th of May Bridge
y Sayeda-Zeinab
C6 Busway 10 km 2 min 20 km/h
y Port Said Street
Express y 6th of October
C7* 102 km 10 min 80 km/h
train y 10th of Ramadan
y Nasr City
C8 Busway 9 km 4 min 20 km/h
y Abaseya
TOTAL and AVERAGE 273 km 3.3 min 37.5 km/h
y The tramway network
The tramway network in this scenario is identical to the one in scenario 2.
y The ENR suburban network
Due to a small load on corridor line 7 from 6th of October to 10th of Ramadan in scenario
2, the corridor is downgraded to a conventional suburban train on the Ain Shams – 10th
of Ramadan link.
Corridor line 7* replaces the current line 8 from Cairo to 6th of October city.
The scenario 3 takes into account the rehabilitation of the existing suburban lines with a
decrease of the headway to 10 minutes (Table 4.6.22).
4 - 108CREATS Phase I Final Report Vol. III: Transport Master Plan
Chapter 4: PUBLIC TRANSPORT SYSTEM
Table 4.6.22 Scenario 3 Suburban Rail Network Description in 2022
Line number
Length (km) Starting at Ending at
R1 14.0 Cairo Qalyob (to Alexandria)
R2 23.5 Cairo Qalyob / Qanater El Khayreya
R3 32.0 Cairo Qalyob / Shebeen El Qanater
R4 20.0 El Marg Shebeen El Qanater
Corridor line 7 46.0 Ain Shams 10th of Ramadan
R6 20.0 Cairo Imbaba / El Manashi
R7 37.0 Cairo El Maraziek
Corridor line 7* 102.0 6th of October 10th of Ramadan
Total 294.5
Source: JICA Study Team
y ENR supply indicators
The suburban rail network supply characteristics of scenario 3 are shown in Table 4.6.23.
Table 4.6.23 Scenario 3 Suburban Rail Supply Indicators in 2022
Peak hour
Line Name Length Average speed
Line headways
(origin, intermediate, destination) (km) (km/h)
(min)
R1 Cairo / Qalyob (to Alexandria) 14.0 40 10
R2 Cairo / Qalyob / Qanater El Khayreya 23.5 40 10
R3 Cairo / Qalyob / Shebeen El Qanater 32.0 40 10
R4 El Marg / Shebeen El Qanater 20.0 40 10
C7 Ain Shams / 10th of Ramadan 46.0 50 10
R6 Cairo / Imbaba / El Manashi 20.0 40 10
R7 Cairo / El Maraziek 37.0 40 10
C7* 6th of October / 10th of Ramadan 102.0 80 10
Totals and Averages 294.5 46 10
Source: JICA Study Team
(2) Population, Employment and Student Densities
Although the corridor line 6 has been reduced and the corridor line 7 has been diverged,
the most important socioeconomic areas are still served.
The introduction of corridor line 8 allows for serving important population, employment
and student areas along Madraset Al-Mamaleek St., Manshiyyt Al-Gamel St. and Seket
El-Waily St.
4 - 109CREATS Phase I Final Report Vol. III: Transport Master Plan
Chapter 4: PUBLIC TRANSPORT SYSTEM
Table 4.6.24 summarizes the number of inhabitants, jobs and student students served
within a distance of 800 meters from the network lines.
Table 4.6.24 Scenario 3, Socio-economic Performance of Each Line in 2022
Mode Population Employed Students Total Ratio (*)
1 1 073 525 475 617 362 667 0.18
2 892 245 496 638 314 165 0.17
3 1 166 745 781 772 499 754 0.26
C4 578 280 205 454 249 730 0.10
C5 842 480 290 889 239 547 0.12
C6 835 346 372 286 194 355 0.13
C7 1 142 029 389 900 212 145 0.15
C7* 1 991 519 873 890 709 120 0.34
C8 560 259 199 064 221 334 0.09
Total network 9 082 429 4 085 509 3 002 818
TOTAL study area 20 721 175 6 966 250 5 771 269
(*) Total ratio = Pop./total pop. + Emp./total emp. + Stu./total stu.
Neither corridor lines 4 nor 7* are optimal in terms of socioeconomic performance due
to the eastern section of these corridors which cross low density areas in the vicinity of
Emtedad Ramses St. In the following scenario, these sections will be avoided.
Corridor lines 3 and 5 shows a slightly better performance due to the extensions to
Behoos station and to 15th of May Bridge respectively.
Figures 4.6.17, 4.6.18 and 4.6.19 depict socio-economic relationships vis-à-vis major
transport lines.
4 - 110CREATS: Phase I Final Report Vol. III: Transport Master Plan
Chapter 4: PUBLIC TRANSPORT SYSTEM
Figure 4.6.17 Scenario 3 and Population Densities
4 - 111CREATS: Phase I Final Report Vol. III: Transport Master Plan
Chapter 4: PUBLIC TRANSPORT SYSTEM
Figure 4.6.18 Scenario 3 and Employment Densities
4 - 112CREATS: Phase I Final Report Vol. III: Transport Master Plan
Chapter 4: PUBLIC TRANSPORT SYSTEM
Figure 4.6.19 Scenario 3 and Student Densities
4 - 113CREATS Phase I Final Report Vol. III: Transport Master Plan
Chapter 4: PUBLIC TRANSPORT SYSTEM
(3) Transport Demand
The results of the demand simulation for the scenario 3 are shown in Table 4.6.25.
Table 4.6.25 Scenario 3, Demand Simulations in 2022
Average daily passengers (million)
Mode
Modal Split Modal Split
2001 2022 % Increase
(%) (%)
Formal PRT (*) 4.299 32.3 3.181 16.7 -26
Informal PRT (**) 6.696 50.2 6.269 33.0 -6
TOTAL PRT 10.995 82.5 9.451 49.7 -14
MRT/LRT 2.021 15.2 8.066 42.5 299
ENR 0.132 1.0 0.802 4.2 505
TOTAL TRAM 0.171 1.3 0.677 3.6 296
Ferry 0.010 0.1 0.004 0.0 -62
TOTAL 13.329 100.0 18.998 100.0
(*) CTA and GCBC (**) Shared taxis and private mini buses. PRT : Public Road Transport.
Public road transport obtains a higher market share (+7.7%) compared to scenario 2 due
to the introduction of a busway on corridor lines 5 and 6 instead of LRT systems. In the
same time the market share of the MRT/LRT systems drops by 6.8%. The ENR network
naturally obtains a lower ridership due to the curtailment of corridor line 7. Since the
corridor line 5 is changed into a busway system with less ridership, the tramway network
in Heliopolis obtains better results than in the previous scenario. The trip volume
forecasts for the corridor lines proposed in scenario 3 are shown in Table 4.6.26.
Table 4.6.26 Scenario 3, Network Daily Trips Demand in 2022
Boarding Pass-km Pass/km Section one-way Max loaded
Line
Pass(million) (million) (1,000) traffic section
1 2.613 29.069 60.8 Mubarak 677,550
2 1.880 10.388 81.7 Mubarak 584,420
3 1.934 12.442 64.5 Zamalek 320,000
C4 1.639 14.060 60.7 El Haram 683,460
C5 0.504 2.298 22.9 El khalafawy 205,430
C6 0.126 0.463 12.6 Ahmed Maher 68,700
C7 0.080 1.190 2.0 Kilo 11 42,170
C7* 0.012 0.005 0.1 Nasr City 7,340
C8 0.134 0.426 14.9 Hadayek El Qoba 85,570
Source: JICA Study Team
• The three MRT lines obtain even better results in this scenario, on the one hand, due
to the curtailment of corridor line 7, which alleviated line 1 on the central section, and
4 - 114CREATS Phase I Final Report Vol. III: Transport Master Plan
Chapter 4: PUBLIC TRANSPORT SYSTEM
on the other hand, the extension of line 3 to Behoos station which favors both line 3
and line 2 in connection. The extension of corridor line 5 to 15th of May Bridge in
connection with line 3 also increases the ridership of the latter.
• Corridor line 4 obtains even better results due to the connection with corridor lines 7*
and 8.
• The attempt to connect 6th of October City with 10th of Ramadan through the South of
Cairo (line C7*) has proved to be a bad solution compared to the corridor running
parallel to metro line 1 in the previous scenario.
• In scenario 2, corridor line 5 was tested as a LRT and obtained a ridership in the upper
limit, i.e. 30,000 on the most loaded section. In this scenario the demand is too
important to be satisfied by a busway system.
• The curtailment of the South section of corridor line 6 and its transformation into a
busway gives reasonably good results since the peak hour ridership is around 7,000
passengers/hour/direction.
• The section of corridor line 7 between Ain Shams and 10th of Ramadan evidently will
not require more than a busway.
• Finally, corridor line 8 provides good results for a high capacity busway system
running at low headways.
The bandwidth diagram (Figure 4.6.20) is similar to the one of scenario 2, except that
corridor lines 5 and 6 no longer appear as they are now tested as busways. Furthermore,
the links to 6th of October and 10th of Ramadan are now tested as conventional ENR lines
running parallel to corridor line 4 via Giza and Nasr City.
The West section of Corridor line 4 shows even stronger loads in this scenario.
4 - 115CREATS Phase I Final Report Vol. III: Transport Master Plan
Chapter 4: PUBLIC TRANSPORT SYSTEM
Source: JICA Study Team
Figure 4.6.20 MRT Bandwidth Diagram of Scenario 3 in 2022
We shall now consider the spider diagram of scenario 3 (Figure 4.6.21). It should be
noted that in this scenario, the important 26th July corridor is no longer served due to
the relocation of the rail link to 6th of October. As the daily trips demand is also very
weak for this new corridor line 7*, the relocation option will not be considered in the
following scenarios.
Again, there is a considerable flow between Al-Malik Faysal and Al-Haram Streets
area and the intersection between 26th July corridor and the Desert Road. As this is a
peripheral, local type of demand flow and not quite strong enough to justify a MRT
or LRT, it should preferably be satisfied by a local busway service.
Another peripheral demand flow appears stronger in this scenario in the East of Cairo
from Al-Maadi along the Ring Road to Al-Marg.
4 - 116CREATS Phase I Final Report Vol. III: Transport Master Plan
Chapter 4: PUBLIC TRANSPORT SYSTEM
Source: JICA Study Team
Figure 4.6.21 Scenario 3 Spider Diagram in 2022
(4) Low Income Areas
The extension of corridor line 5 to 15th of May Bridge is useful in terms of serving
low-income areas in the city center.
Due to a relatively low ridership, the South section of corridor line 6 was curtailed. It
should however be considered to maintain this line in due consideration of serving an
important low-income areas in El-Mokkatam and Dar El-Salam.
(5) Interfaces
This scenario is very interesting in terms of interfaces, on the one hand, due to the
extensions of lines C5 and M3, and on the other hand, due to the introduction of corridor
line 8 (Figure 4.6.27).
(6) Physical Constraints
Again, all of the proposed corridor lines follow the main road corridors in Cairo with the
least interference with underground facilities and buildings. Furthermore on various
sections they employ already existing tracks or right-of-ways.
4 - 117CREATS Phase I Final Report Vol. III: Transport Master Plan
Chapter 4: PUBLIC TRANSPORT SYSTEM
Table 4.6.27 Interfaces of Scenario 3 in 2022
Line Number of connections by line(1) Total
1 2 x M2, 1 x M3, 1 x C4, 1 x C5, 2 x C6, 1 x C7, 1 x C7*, 1 x C8 10
2 2 x M1, 2 x M3, 1 x C4, 1 x C5, 1 x C7*, 1 x C8 8
3 1 x M1, 2 x M2, 1 x C4, 2 x C5, 1 x C6, 1 x C7, 1 x C7*, 1 x C8 10
C4 1 x M1, 1 x M2, 1 x M3, 1 x C5, 1 x C6, 4 x C7*, 1 x C8 10
C5 1 x M1, 1 x M2, 2 x M3, 1 x C4, 1 x C6, 1 x C7*, 1 x C8 8
C6 1 x M1, 1 x M3, 1 x C4, 1 x C5, 1 x C7*, 1 x C8 6
C7 1 x M1, 1 x M3 2
C7* 1 x M1, 1 x M2, 1 x M3, 4 x C4, 1 x C5, 1 x C6, 1 x C8 10
C8 1 x M1, 1 x M2, 1 x M3, 1 x C4, 1 x C5, 1 x C6, 1 x C7* 7
TOTAL 71
(1) For example, Corridor Line 7 has one connection (joint station) point each with Metro Line 1 and Metro Line
3. The total number of connections with other rail lines is two (refer Figure 4.6.16 for depiction of lines).
Source: JICA Study Team
4.6.6 Scenario 4
(1) Network Description
y The MRT/LRT/busway network
This scenario is an adaptation and variation of scenario 3 :
• Corridor line 6 is combined with corridor line 4 as a MRT system in order to test
another alternative with the best sections of these lines.
• Corridor line 7 is attempted to run parallel with corridor line 4 while serving 6th of
October from the South of Cairo and 10th of Ramadan from the North.
• Corridor line 8 provided good operational results as a busway but was not interesting
from a socioeconomic point of view. The South section of this corridor is therefore
modified so as to serve better Nasr City.
• Finally, a new tramway line is attempted with corridor line 9, along existing tracks,
from Nasr City and connecting with line 3 and corridors 4 and 7 at Bab El-Shaaria
station.
The proposed scenario is summarized in Table 4.6.28, and Figure 4.6.22.
4 - 118CREATS Phase I Final Report Vol. III: Transport Master Plan
Chapter 4: PUBLIC TRANSPORT SYSTEM
Table 4.6.28 Scenario 4, Network Description in 2022
Line Type Length Starting at Passing through Ending at
1 MRT 44 km New El Marg CBD area Helwan
2 MRT 23 km Shobra el Kheima CBD area Giza – Moneeb
Imbaba (branch 1)
3 MRT 33 km Cairo Airport CBD- Mohandiseen
Boolaq (branch 2)
C4 MRT 26 km Giza Pyramids CBD (East) Ain Shams
C5 Busway 24 km Nasr City Heliopolis 15th of May Bridge
C7 Train 96 km 6th of October CBD (East) 10th of Ramadan
C8 Busway 17 km Nasr City Abaseya Shobra
C9 Tram 15 km Nasr City Shobra CBD (East)
Source: JICA Study Team
• MRT/LRT/busway supply indicators
The MRT network supply characteristics of scenario 4 are shown in Table 4.6.29.
Table 4.6.29 Scenario 4 Network Supply Indicators in 2022
Headway Average
Line Mode Terminals Length
(Peak period) speed
y New El
1 MRT
y Marg Helwan
44 km 2 min 34 km/h
y Shobra el Kheima
2 MRT
y Giza – Moneeb
23 km 2 min 38 km/h
y Cairo Airport
3 MRT y Imbaba (branch 1) 33 km 2 min 38 km/h
y Boolaq (branch 2)
y Port Said Street
C4 MRT 26 km 2 min 38 km/h
y Giza Pyramids
y Nasr City
C5 Busway 24 km 4 min 20 km/h
y 15th of May Bridge
Express y 6th of October
C7 96 km 10 min 80 km/h
train y 10th of Ramadan
y Nasr City
C8 Busway 17 km 4 min 20 km/h
y Shobra
y Nasr City
C9 Tram 15 km 4 min 22 km/h
y CBD (East)
Total and averages 278 km 3.5 min 36 km/h
Source: JICA Study Team
4 - 119You can also read