Mapping the European Soy Supply Chain - Embedded Soy in Animal Products Consumed in the EU27+UK - WWF
←
→
Page content transcription
If your browser does not render page correctly, please read the page content below
Mapping the European
Soy Supply Chain
Embedded Soy in Animal Products
Consumed in the EU27+UK
Barbara Kuepper, Manon Stravens
January 2022
About this report
This report has been commissioned by World Wide Fund for Nature European Policy Office.

About Profundo
With profound research and advice, Profundo aims to make a practical contribution to a
sustainable world and social justice. Quality comes first, aiming at the needs of our clients.
Thematically we focus on commodity chains, the financial sector and corporate social
responsibility. More information on Profundo can be found at www.profundo.nl.

Authorship
This report was researched and written by Barbara Kuepper, with contributions from Manon
Stravens. Correct citation of this document: Kuepper, B. and M. Stravens (2022, January), Mapping
the European Soy Supply Chain – Embedded Soy in Animal Products Consumed in the EU27+UK,
Amsterdam, The Netherlands: Profundo.
Front page cover photograph by Kelly Sikkema - Unsplash.

Disclaimer
Profundo observes the greatest possible care in collecting information and drafting publications
but cannot guarantee that this report is complete. Profundo assumes no responsibility for errors in
the sources used, nor for changes after the date of publication. The report is provided for
informational purposes and is not to be read as providing endorsements, representations or
warranties of any kind whatsoever. Profundo will not accept any liability for damage arising from
the use of this publication.
Contents
Summary ..................................................................................................................................................... 1
Glossary of key terms .................................................................................................................................. 2
Introduction ................................................................................................................................................. 3
                       Global soy production and trade.......................................................................................... 5
       1.1             Global soy production ................................................................................................................... 5
       1.2             Global soy trade ............................................................................................................................. 6
                       Soy production and use in EU27+UK ................................................................................. 11
       2.1             Soy production ............................................................................................................................. 11
       2.2             Imports of soybeans, soybean meal and soybean oil ............................................................... 11
       2.3             Exports of soybeans, soybean meal and soybean oil................................................................ 12
       2.4             Soy available for use in the EU27+UK countries ........................................................................ 14
       2.5             Soy use in animal feed ................................................................................................................ 14
                       Embedded soy in animal products and consumption in EU27+UK ..................................... 19
       3.1             Consumption of animal products ............................................................................................... 19
       3.2             Consumption of embedded soy in the EU27+UK ....................................................................... 21
       3.3             Embedded soy consumption per iconic product ....................................................................... 23
References ................................................................................................................................................ 24

List of figures
Figure 1               Key soy processing stages ........................................................................................................... 3
Figure 2               Soybean and soybean meal exports by key producers (2010/11 to 2019/20) .......................... 8
Figure 3               Regional distribution of soy imports (2019/20)......................................................................... 10
Figure 4               Soy imports and exports EU27+UK (2011 to 2020) ................................................................... 13
Figure 5               Source materials for proteins for feed use in the EU27+UK (2019/20) ................................... 15
Figure 6               Estimated soybean meal content in compound feed in ten EU27+UK countries .................... 16
Figure 7               Shares of different animal products in total feed soy use in the EU27+UK (2020) ................. 18

List of tables
Table 1                Soy production and crushing per country/region (2019/20) ...................................................... 5
Table 2                Soy exports per country/region (2019/20) .................................................................................. 7
Table 3                Soy imports per country/region (2019/20) .................................................................................. 9
Table 4                EU27+UK soy production (2020) ................................................................................................ 11
Table 5                Soy imports to the EU27+UK (2020)........................................................................................... 12
Table 6                Soy exports from the EU27+UK (2020) ...................................................................................... 13
Table 7                Soy available for use in the EU27+UK (2020) ............................................................................ 14
Table 8                Estimated soy content in different feeds in the EU27+UK (2020) ............................................ 17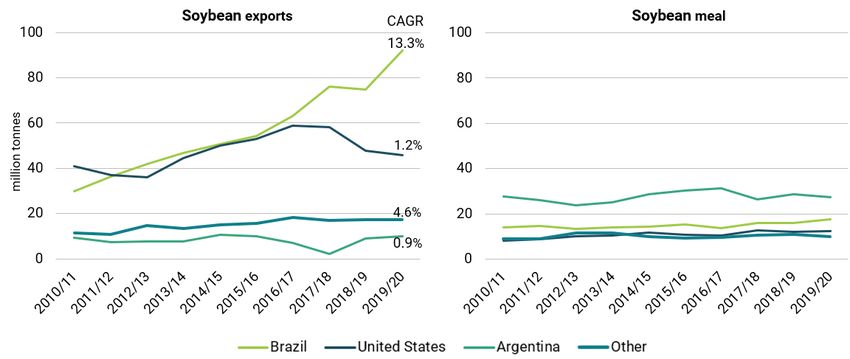
Table 9    Production, net export, consumption of animal products in the EU27+UK (2020) .................. 19
Table 10   Per capita consumption of animal products in the EU27+UK (2020) ...................................... 20
Table 11   Soy consumption in the EU27+UK (2020) .................................................................................. 21
Table 12   Per capita soy consumption in the EU27+UK (2020) ................................................................ 22
Table 13   Embedded soy consumption per iconic product in the EU27+UK in 2020 ............................... 23
Summary
Soy is used in the production of a wide range of products but is nonetheless hardly visible to
European consumers. This research aims to provide the necessary underlying data to better
understand the soy flows on the EU27+UK market, including basic data on soy production and
trade worldwide, as well as detailed data on soy use in the consumption of animal products in
2020.
The global soybean harvest reached a volume of 340 million tonnes in the harvest season
2019/20. This corresponds with a total area of 123 million hectares. Over 80% of all soy produced
globally originates from the United States, Brazil and Argentina combined, which are also the
largest exporting countries. Globally, imports of soybeans, soybean meal and soy oil amounted to
a combined 238 million tonnes. Largest importing countries/regions are China, the EU27+UK and
other Asian countries.
Domestic soy production in the EU27+UK has shown considerable growth rates over recent years;
however, it remains far too low to fulfil the demand for the high-quality protein crop. While
domestic output reached 2.7 million tonnes in 2020, the total used soy volume including net
imports amounted to 30.3 million tonnes of soybean meal, 1.8 million tonnes of soybeans and 2.7
million tonnes of soybean oil. The large volume of soybean meal as well as small volumes of
beans and oil can be assigned to different categories of animal feed. Based on average content
shares, the calculated embedded soy content per kg of animal product (retail weight) consumed in
the EU27+UK is highest for broilers (956 grams), farmed fish (951 grams), and pork (415 grams).
Embedded soy shares in concentrated dairy products like cheese and milk powder are also high.
Based on these calculations, an average EU27+UK citizen consumes an estimated 60.6 kg of soy
per year. With 54.9 kg, the largest share of soy products is embedded in the consumption of
animal products like meat, dairy, eggs, and farmed fish. The direct use of soybeans and soybean
oil for food adds another 3.5 kg, while the consumption of soybean oil in industrial products like
biodiesel amounts to an estimated 2.3 kg per capita.

                                                                                            Page | 1
Glossary of key terms
Carcass weight: The weight of an animal after being partially butchered. Average conversion
factors are applied to calculate the → retail weight of meat products.
Compound feed: A mixture of different raw materials and supplements fed to farm animals.
Crushing ratio: The processing of soybeans results in the two main subproducts, meal and oil,
where the crushing ratio describes the weight share of soybean meal and soybean oil resulting
from the crushing of a certain volume of beans. The crush result can vary between 73% of soybean
meal for high-protein meal and 80% for low-protein meal, depending on the inclusion of hulls. In this
analysis, an average crushing ratio of 78.5% soybean meal and 18.5% soybean oil is applied. The
remainder is accounted for by hulls and small amounts of other products.
Embedded soy: The soy footprint of an animal product based on the → soy used during its
production. The concept of embedded soy allows to quantify the volume of soy linked to a certain
product volume despite no physical soy being present in the end-product.
EU27+UK: The analysis is considering data for the 27 Member States of the European Union and
the United Kingdom.
Home mixing: Mixing of feedstuffs on-farm including farm-grown and bought-in materials.
Protein content: The protein content of soybean meal differs depending on whether the hulls are
included in the resulting meal (44% protein meal (low protein or ‘low-pro’)) or kept separate (48%
protein meal (high protein or ‘hi-pro’)) as well as on the growing region.
Retail weight: Average conversion factors are applied to estimate the retail weight equivalent from
→ carcass weight. This includes, e.g., the removal of bone and fat.
Soy: In this research soy is used as a general term for soybeans and the products resulting from
soybean crushing and processing, namely soybean meal and soybean oil. In the Harmonized
System (HS), soybeans are traded under HS code 1201; soybean meal (also referred to as oil-cake,
ground or in the form of pellets) under HS code 2304; and soybean oil under HS code 1507.
Customs data suggests that soy protein concentrate (SPC) for feed use is mostly traded under HS
code 2304, albeit in much smaller volumes than soybean meal. SPC may also show up under other,
less specific HS codes.
Soy consumption: The embedded soy consumed by EU27+UK citizens in various animal products,
including meat, dairy, eggs and farmed fish, as well as direct soy consumption in food and
industrial products.
Soy content: The average share of physical soy in different types of animal feed.
Soy production: Soy cultivated and harvested in production countries.
Soy trade: Export and import of soy in the form of soybeans, soybean meal and soybean oil.
Soy use: The physical soy used in different types of animal feed.
Page | 2Introduction
Soy is used in the production of a wide range of products but is nonetheless hardly visible to
European consumers. Virtually all the soymeal resulting from the crushing process is used in
animal feed. A small share of uncrushed beans (full fat soybeans) and of the soybean oil resulting
from the crushing process are used in animal feed as well. Globally, most soybean oil is used as
refined cooking oil, in margarines, dressings and for other food purposes, as well as in industrial
and chemical purposes such as biodiesel, soaps, and fatty acids.1 Uncrushed beans are also used
for food products such as tofu or soy drinks.
In animal products, the soy is no longer physically present in the meat, dairy, or egg found in stores,
despite millions of tonnes of soy products being fed to farm animals every year. Therefore, this
research aims to map the distribution of soy use across different market segments in 2020 based
on soy production, trade, and consumption data. Geographically, the current 27 member states of
the European Union (EU27) plus the United Kingdom (UK) (EU27+UK) are the focus of the analysis.
Due to the incomplete data on feed composition for individual countries, the analysis must rely on
several assumptions. The resulting estimates should therefore be seen as approximates rather
than precise figures. The approach to calculating the use of soy in the production of animal feed,
the resulting flow of soy into different animal product segments as well as other uses of soy
products is explained in the text.
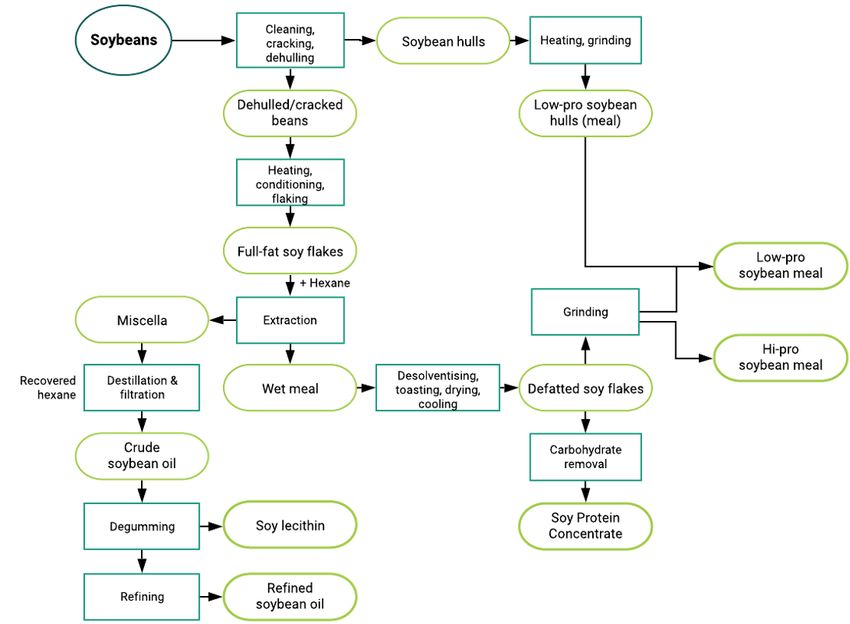
Figure 1 Key soy processing stages
Source: Own elaborations, based on: Greenwood, W. and J. Kim (2021, April 10), “Shining a light on soybean meal quality”, FeedAdditive,
viewed in January 2022; U.S. Soybean Export Council (2015), Manual of Quality Analysis for Soybean Products in the Feed Industry.
Page | 3When comparing the results with other studies as well as figures for previous years a couple of
factors need to be kept in mind. The soy market, like all agricultural commodity markets, is highly
volatile as it is affected by a broad range of influencing factors. These range from weather impacts
on harvests and resulting surpluses or shortages in availability from one year to another, changes
in demand as caused by the outbreak of African swine fever in China,2 political developments like
the US-China trade war, to the supply chain hick-ups and changes in demand because of the
COVID-19 epidemic.3 A snapshot based on data for one specific year may be influenced by one or
more of these factors when comparing with other years. Comparisons with other approaches to
calculating soy use in specific products need to consider potential differences in the underlying
methodology to calculate soy content in feedstuffs, data sources and geographic scope, among
other factors.
Page | 41
Global soy production and trade
Global soybean production reached 340 million tonnes in 2019/20. More than 90% of this
volume was crushed into the main products soybean meal (78.5%) and soybean oil
(18.5%). The production and export of soy is dominated by the key producing countries,
Brazil, the U.S., and Argentina. The most important destinations are China and the
EU27+UK region.
1.1 Global soy production
The global soybean harvest reached a volume of 340 million tonnes in the marketing year 2019/20
(Table 1).a This corresponds with a total area of 123 million hectares. Over 80% of soybeans
globally are produced in Brazil, the United States and Argentina combined. The EU27+UK countries
produced 2.6 million tonnes in 2019/20, less than 1% of the global total.
Soybeans are crushed in the country of origin as well as in importing countries. The EU27+UK
countries accounted for around 5% of global soybean crushing in 2019/20.
Table 1 Soy production and crushing per country/region (2019/20)
Result of crushing
Harvest of Share global Volume Share global (1,000 t)
Country / Area planted
soybeans soybean crushed crushing
region (1,000 ha)
(1,000 t) harvest (%) (1,000 t) volume (%) Soybean Soybean
meal oil
Brazil 36,900 128,500 37.8% 46,742 15.0% 36,225 9,000
Argentina 16,700 48,800 14.4% 38,770 12.4% 30,240 7,700
Paraguay 3,500 10,250 3.0% 3,500 1.1% 2,645 665
Bolivia 1,358 2,829 0.8% 2,550 0.8% 2,000 473
Rest of Latin 1,044 2,265 0.7% 1,340 0.4% 1,037 257
America
U.S. 30,327 96,667 28.4% 58,910 18.9% 46,358 11,299
Canada 2,271 6,145 1.8% 1,755 0.6% 1,366 320
EU27+UK 904 2,617 0.8% 16,275 5.2% 12,324 2,964
Ukraine 1,963 4,499 1.3% 1,850 0.6% 1,460 340
a The marketing year in production data provided by the U.S. Department of Agriculture (USDA) begins on September 1
for soybeans, and on October 1 for soybean meal and soybean oil. The USDA provides detailed and recent overviews
on the world production of agricultural commodities. It was chosen to use USDA on soybean production as e.g. the
UN Food and Agriculture Organization (FAO) as another important global agricultural data provider at the time of
writing only provides production data until 2019.
Page | 5Result of crushing
Harvest of Share global Volume Share global (1,000 t)
Country / Area planted
soybeans soybean crushed crushing
region (1,000 ha)
(1,000 t) harvest (%) (1,000 t) volume (%) Soybean Soybean
meal oil
Russia 2,776 4,359 1.3% 4,650 1.5% 3,664 834
India 12,193 9,300 2.7% 8,400 2.7% 6,720 1,512
China 9,332 18,092 5.3% 91,500 29.3% 72,468 16,397
Indonesia 400 480 0.1% - 0.0% - -
Japan 144 212 0.1% 2,460 0.8% 1,855 480
Vietnam 42 66 0.0% 1,250 0.4% 976 238
South Korea 58 105 0.0% 1,035 0.3% 815 183
Thailand 34 52 0.0% 2,610 0.8% 2,035 468
Rest of Asia 391 588 0.2% 7,916 2.5% 6,193 1,452
& Oceania
South Africa 705 1,246 0.4% 1,100 0.4% 868 204
Nigeria 1,040 1,150 0.3% 870 0.3% 676 157
Rest of Sub- 357 497 0.1% 305 0.1% 239 56
Saharan
Africa
North Africa 9 25 0.0% 5,786 1.9% 4,508 1,066
Other 477 1,133 0.3% 12,906 4.1% 10,962 2,380
countries
Total 122,893 339,885 312,480 245,634 58,543
Note: Volumes crushed are influenced by imports and exports of soybeans.
Source: USDA Foreign Agriculture Service (2021), "Production, supply and distribution online", viewed in November 2021.
1.2 Global soy trade
Global exports of soybeans, soybean meal and soybean oil amounted to a total of 245 million
tonnes in 2019/20 (Table 2). The division between the two main traded products, soybeans and
soybean meal, depends on a number of factors. In some producing countries the crushing before
export is stimulated to increase domestic value adding or to use the resulting soybean oil for
national biodiesel blending mandates.
Importing countries may prefer soybean imports as they have markets for both crushing products,
like for example in China with its large edible oil and animal product sectors. Meanwhile, the EU
imports large volumes of soybeans for crushing as well as soybean meal to fill the crop protein
gap for its animal product sector.
In line with their role as top producers, Brazil, the United States, and Argentina are the leading
exporters globally.
Page | 6Table 2 Soy exports per country/region (2019/20)
Export (1,000 tonnes)
Exporting Share total Share total Share total
country / region Soybean
Soybeans soybean soybean meal Soybean oil soybean oil
meal
exports (%) exports (%) exports (%)
Brazil 92,135 55.8% 17,499 25.8% 1,156 9.4%
Argentina 10,002 6.1% 27,461 40.6% 5,404 43.9%
Paraguay 6,619 4.0% 2,138 3.2% 631 5.1%
Bolivia 20 0.0% 1,723 2.5% 380 3.1%
Rest of Latin 1,933 1.2% 15 0.0% 106 0.9%
America
United States 45,701 27.7% 12,550 18.5% 1,287 10.5%
Canada 3,907 2.4% 329 0.5% 144 1.2%
EU27+UK 256 0.2% 952 1.3% 951 7.7%
Ukraine 2,633 1.6% 724 1.1% 338 2.7%
Russia 1,186 0.7% 557 0.8% 612 5.0%
India 80 0.0% 886 1.3% 16 0.1%
China 90 0.1% 1,012 1.5% 155 1.3%
Indonesia 3 0.0% - 0.0% - 0.0%
Japan - 0.0% 1 0.0% 1 0.0%
Vietnam - 0.0% 110 0.2% 10 0.1%
South Korea - 0.0% 44 0.1% 2 0.0%
Thailand 4 0.0% 47 0.1% 103 0.8%
Rest of Asia & 28 0.0% 78 0.1% 144 1.2%
Oceania
South Africa - 0.0% 106 0.2% 50 0.4%
Nigeria 7 0.0$ 100 0.1% - 0.0%
Rest of Sub- 91 0.1% 120 0.2% 1 0.0%
Saharan Africa
North Africa - 0.0% 38 0.1% 294 2.4%
Other countries 364 0.2% 1,227 1.8% 522 4.2%
Total 165,059 67,717 12,307
Note: Difference in totals with Table 3 may be due to a) countries with minor volumes of imports and/or exports not always appearing in
statistics but in totality creating a difference; and b) some exports and imports appearing in different marketing years.
Source: USDA Foreign Agriculture Service (2021), "Production, supply and distribution online", viewed in November 2021.
Page | 7Brazil rapidly increased its absolute traded volumes as well as its share in global trade in recent
years. While exports of soybean meal more of less stagnated during the ten year-period from
2010/11 to 2019/20, exports of unprocessed soybeans have experienced an ongoing and
significant increase (Figure 2). Its compound annual growth rate (CAGR) in soybean exports of
13.3% during the analysed ten years is almost twice as high as the average global CAGR (6.8%).b
Figure 2 Soybean and soybean meal exports by key producers (2010/11 to 2019/20)
Source: USDA Foreign Agriculture Service (2021), "Production, supply and distribution online", viewed in November 2021 .
China is by far the largest importer of soy, and then almost exclusively in the form of soybeans.
The country accounts for 60% of traded soybeans and 9% of traded soybean meal in 2019/20.
Looking at the total traded volume of soy products, this represents a combined share of around
42% of all traded soy products. The EU27+UK is another important destination of soy imports,
accounting for 10% of soybean imports, 30% of soybean meal imports and 6% of soybean oil
imports, or a share of around 15% in total traded soy products (Table 3 and Figure 3). While China
is a larger importer than the EU, Trase data shows though that the EU’s relative deforestation
impact linked to soy from Brazil was greater than China’s. Over the period 2009 to 2018, EU
imports of Brazilian soy on average led to 1.5 hectares of deforestation and conversion per 1,000
tonnes, compared to 0.75 hectares linked to Chinese imports from the country. A similar pattern
has been observed for imports of Argentinian soy.4
b The compound annual growth rate (CAGR) allows to calculate the annualized average rate of growth during a defined
number of years, assuming growth takes place at an exponentially compounded rate.
Page | 8Table 3 Soy imports per country/region (2019/20)
Soybeans Soybean meal Soybean oil Total soy
Importing
1,000 1,000 1,000 products
country / region Share (%) Share (%) Share (%)
tonnes tonnes tonnes share (%)
Brazil 549 0.3% 10 0.0% 66 0.6% 0.3%
Argentina 4,882 3.0% 1 0.0% 0 0.0% 2.0%
Paraguay 10 0.0% 0 0.0% 6 0.1% 0.0%
Bolivia 6 0.0% 0 0.0% 8 0.1% 0.0%
Rest of Latin 1,268 0.8% 7,089 11.4% 1,458 12.8% 4.1%
America
United States 419 0.3% 580 0.9% 145 1.3% 0.5%
Canada 263 0.2% 1,150 1.9% 27 0.2% 0.6%
EU27+UK 15,704 9.5% 18,464 29.8% 655 5.7% 14.6%
Ukraine 24 0.0% 4 0.0% 0 0.0% 0.0%
Russia 2,047 1.2% 288 0.5% 62 0.5% 1.0%
India 520 0.3% 23 0.0% 3,626 31.8% 1.7%
China 98,533 59.7% 51 0.1% 1,000 8.8% 41.8%
Indonesia 2,636 1.6% 5,043 8.1% 34 0.3% 3.2%
Japan 3,325 2.0% 1,858 3.0% 5 0.0% 2.2%
Vietnam 1,882 1.1% 5,090 8.2% 45 0.4% 2.9%
South Korea 1,291 0.8% 1,992 3.2% 402 3.5% 1.5%
Thailand 3,831 2.3% 2,854 4.6% 3 0.0% 2.8%
Rest of Asia & 8,701 5.3% 6,206 10.0% 1,055 9.3% 6.7%
Oceania
South Africa 10 0.0% 481 0.8% 150 1.3% 0.3%
Nigeria 52 0.0% 0 0.0% 1 0.0% 0.0%
Rest of Sub- 9 0.0% 97 0.2% 220 1.9% 0.1%
Saharan Africa
North Africa 6,176 3.7% 2,369 3.8% 1,790 15.7% 4.3%
Other countries 12,836 7.8% 8,321 13.4% 638 5.6% 9.1%
Total 164,974 61,971 11,396 100.0%
Note: Difference in totals with Table 2 may be due to a) countries with minor volumes of imports and/or exports not always appearing in
statistics but in totality creating a difference; and b) some exports and imports appearing in different marketing years.
Source: USDA Foreign Agriculture Service, "Production, supply and distribution online", viewed in November 2021.
Page | 9Figure 3 Regional distribution of soy imports (2019/20)
Source: USDA Foreign Agriculture Service, "Production, supply and distribution online", viewed in November 2021.
Page | 102
Soy production and use in EU27+UK
While output from domestic soy cultivation in the EU27+UK has increased in recent
years, it remains much too small to satisfy the demand for high-quality crop proteins. In
2020, a total net volume of 1.8 million tonnes of soybeans, 30.3 million tonnes of
soybean meal and 2.7 million tonnes of soybean oil were available for domestic use.
2.1 Soy production
Soy production in the EU27 is still small compared to global output but has shown significant
growth in recent years. Output more than doubled during the last ten years, from 1.26 million
tonnes in 2010 to 2.69 million tonnes in 2020. The top-5 producing countries – Italy, France,
Romania, Croatia, and Austria - accounted for more than 80% of output in the EU in 2020 (Table 4).
Production in the UK is too small to be reported in agricultural statistics.
Table 4 EU27+UK soy production (2020)
Production
Country Share in EU27+UK production
(1,000 tonnes)
Italy 965 35.8%
France 407 15.1%
Romania 334 12.4%
Croatia 266 9.9%
Austria 203 7.5%
Other 519 19.3%
Total 2,694
Source: Eurostat (2021), “Crop production in national humidity”, viewed in November 2021.
2.2 Imports of soybeans, soybean meal and soybean oil
Soybean, meal, and oil imports to the EU27+UK reached a combined 33.9 million tonnes in 2020
(Table 5). The top soy producing countries Brazil, Argentina, and the United States accounted for a
combined 86% of these imports, Brazil alone for almost half. Soybean meal and soybeans are the
main traded soy products. Soybean oil plays in comparison a much smaller role, and mostly comes
from Central and Eastern European countries, including Ukraine, Russia, and Serbia. This can be
explained with the demand for non-genetically modified (GM) soybean oil for food products.c
c In contrary to feed products, GM-ingredients in food products must be labelled as such in the EU.
Page | 11Table 5 Soy imports to the EU27+UK (2020)
Soybeans Soybean meal Soybean oil Total soy
Country / region of
products
origin 1,000 1,000 1,000
Share (%) Share (%) Share (%) share (%)
tonnes tonnes tonnes
Brazil 8,316 52.4% 7,843 44.7% 1 0.2% 48%
Argentina 121 0.8% 7,376 42.0% 2 0.5% 22%
United States 5,036 31.8% 407 2.3% 0 0.0% 16%
Canada 1,497 9.4% 164 0.9% - 0.0% 5%
Ukraine 496 3.1% 177 1.0% 184 39.9% 3%
Paraguay* 96 0.6% 478 2.7% 54 11.8% 2%
Russia 0 0.0% 336 1.9% 51 11.2% 1%
China 19 0.1% 162 0.9% 0 0.0% 1%
India 14 0.1% 102 0.6% 0 0.0% 0%
Uruguay 12 0.1% 28 0.2% - 0.0% 0%
Bolivia - 0.0% 21 0.1% - 0.0% 0%
Other countries 253 1.7% 456 2.8% 168 36.5% 3%
EU27+UK imports 15,860 17,551 461
of which UK imports 783 1,549 18 7%
Note: Difference with Table 3 due to differing time periods;
*Some of Paraguay’s soy exports may be included in data from Argentina, Brazil and Uruguay due to transhipment.
Source: Eurostat (2021), "International trade in goods - Detailed data", viewed in November 2021; UK Trade Info (2021), “Overseas trade
data table”, viewed in December 2021.
2.3 Exports of soybeans, soybean meal and soybean oil
Soy exports from the EU27+UK only account for a small share of total available soy from imports
and production. In 2020, a total of 1.31 million tonnes of soybeans, soybean meal and soybean oil
were exported to non-EU destinations (Table 6), with Morocco and Algeria as the most important
trading partners, and soybean oil as the most important exported product.
Page | 12Table 6 Soy exports from the EU27+UK (2020)
Country / region of Export (1,000 tonnes)
destination
Soybeans Soybean meal Soybean oil Total
Morocco 0 5 247 253
Algeria 0 13 194 207
Switzerland 15 118 5 137
Russia 124 6 0 130
South Africa 0 - 105 105
Other 44 204 224 472
Total 183 346 775 1,304
of which UK exports 0.2 0.4 0.0 0.6
Note: Difference with Table 2 due to differing time periods.
Source: Eurostat (2021), "International trade in goods - Detailed data", viewed in November 2021; UK Trade Info (2021), “Overseas trade
data table”, viewed in December 2021.
Overall, the EU27+UK trade balance for the key soy products shows little changes over the ten
years since 2011 (Figure 4). There has been a slight decrease in soybean meal and concurrent
increase in soybean imports to the EU27+UK over the ten year-period to 2020. After the crushing of
most of the soybeans with meal and oil as key products, the overall volume of soy products
available for use does not suggest a sizable shift away from the predominantly South American
soy imports to the region.
Exports of the key soy products to destinations outside the EU27+UK remained small, with
soybean oil taking up a comparatively large share in exports since 2013.
Figure 4 Soy imports and exports EU27+UK (2011 to 2020)
Source: Eurostat (2021), "International trade in goods - Detailed data", viewed in November 2021; UK Trade Info (2021), “Overseas trade
data table”, viewed in December 2021.
Page | 132.4 Soy available for use in the EU27+UK countries
Summarising the results from sections 2.1, 2.2 and 2.3, Table 7 presents the total volumes of the
main soy products – soybeans, soybean meal and soybean oil – that were available for use in the
EU27+UK in 2020. With 17.6 million tonnes, soybean meal accounted for the largest volume,
followed by uncrushed soybeans with 15.9 million tonnes. Imports of soybean oil are small at
around 0.5 million tonnes. However, the crushing of a large share of the soybeans – both from
imports and from regional production – results in an additional 3.1 million tonnes of oil, based on
the average crushing outcome of 18.5% oil. Adding the 13.1 million tonnes of soybean meal
resulting from the crushing of soybeans to net import volumes, a total of 30.3 million tonnes of
soybean meal was available for use in feed in the EU27+UK market. With respectively 1.8 and 2.7
million tonnes, soybeans and soybean oil are used in much smaller volumes.
Table 7 Soy available for use in the EU27+UK (2020)
Soy products Domestic Result of Available for use
Import Crushing Export
(1,000 tonnes) production crushing in EU27+UK
Soybeans 15,860 2,694 16,665 - 183 1,846
Soybean meal 17,551 - 13,082 346 30,287
Soybean oil 461 - 3,083 782 2,746
Note: Differences in totals available for use due to changes in stocks and small losses during crushing.
Source: Eurostat (2021), "International trade in goods - Detailed data", viewed in November 2021; ISTA Mielke (2021), Oil World Annual
2021, Hamburg, Germany: ISTA Mielke; Eurostat (2021), "Crop production in national humidity", viewed in November 2021.
The following sections focus on the role of animal farming as a key destination of these soy
products. Other uses such as direct processing into food products or in industrial products such as
biodiesel are considered in Chapter 3.
2.5 Soy use in animal feed
According to the European Compound Feed Manufacturers' Federation (FEFAC), the volume of
industrial compound feed produced in the EU27+UK reached 164.86 million tonnes in 2020.5 This
volume accounted for around 20% of the total feed consumed by farm animals in that year, while
roughages accounted for 67% and on-farm feed materials for 13%.6
The privileged role of soybean meal as an ingredient in compound feed formulation is mainly due
to its higher protein content in comparison to other crops, as well as its amino acid content and
year-round availability.d, 7 With roughage excluded,e soybean meal has therefore become the most
important individual protein source in the EU27+UK, supplying 29% of the crude protein for feed
use in 2019/20 (Figure 5). However, the self-sufficiency rate for protein from soybean meal is low,
with domestic production covering just 3% of demand in 2019/20.8 This crop protein gap in
relation to the extensive EU27+UK animal product industry is leading to the observed strong
dependence on soy imports.
d Based on dry matter, soybean meal has an average protein share of 53%, compared to rapeseed meal with 40% and
sunflower meal with 33%.
e Roughage accounts for around 45% of protein supply in feed, based on protein equivalent.
Page | 14Figure 5 Source materials for proteins for feed use in the EU27+UK (2019/20)
Note: Expressed in crude protein, excluding roughages.
Source: FEFAC (2020), From Farm to Table: 2020 Feed Statistics in Charts, p. 34.
As the 2020 compound feed production figures are only provided per species but not further
broken down per species (e.g., distinction between fattening and dairy cows for cattle feed or
between broilers and layers for poultry feed), the relative division as reported by FEFAC for 2017
was applied to the 2020 production volumes.9 Moreover, aquaculture feed production is not
separately reported by FEFAC. Therefore, its share in “other feed” was estimated based on
European aquaculture feed production volumes published in the Alltech Global Feed Survey 2021.10
There is no other sizeable market for soybean meal than its use in feedstuffs. This refers notably
to its inclusion as a high-quality crop protein source in compound feeds, as well as smaller
volumes that are added in home-mixing on the farm. The composition of industrial compound
feeds varies between certain margins on an annual basis, depending on availability and market
prices. In the case of soybean meal, its content share may be somewhat higher or lower depending
on the availability and price of other crop protein sources; however, as soybean meal is the most
important high-quality crop protein these margins are limited.
While it is known that the share of soybean meal in compound feeds also shows differences
between different European countries, it is difficult to access detailed figures across all countries
and animal species. For this research, data on the soymeal content in feeds for four key animal
products across ten European countries collected by Hoste (2016) was used (Figure 6).f,11 In 2020,
these countries accounted with around 81% for most of the industrial compound feed production
in the EU27+UK as reported by FEFAC.12
f The ten countries covered are Belgium, Denmark, France, Germany, Ireland, Italy, the Netherlands, Spain, Sweden, the
UK. No details on the role of soy protein concentrate (SPC) are included.
Page | 15Figure 6 Estimated soybean meal content in compound feed in ten EU27+UK countries
Source: Hoste, R. (2016, September), Soy Footprint of Animal Products in Europe – An Estimation, Wageningen, Netherlands:
Wageningen University & Research and IDH, p. 5.
Weighted averages based on the share of the ten countries in regional compound feed production
were used to extrapolate the available data and estimate shares per type of feed on the EU27+UK
level. As no figure for beef cattle could be drawn from the same report, an estimate for this share
for the Dutch market was used as a proxy.13
Also in aquaculture feed, soy is an important protein source. It includes considerable shares of soy
protein concentrate (SPC) as well as soybean meal.g The composition differs between different
aquaculture systems in Europe, with the main systems being freshwater, cold water marine and
warm water marine production.h First, the share of the three main aquaculture production systems
for fish in the overall reported volume of aquaculture fish feed in the EU27+UK in 2020 was
calculated based on FAO aquaculture production data.14 In a second step, average estimates for
the inclusion of SPC and soybean meal in the different aquaculture feeds allowed to estimate the
total volume of the soy products that was used for farmed fish in 2020.15 These calculations led to
an estimated average content of 15% SPC and 10% soybean meal in the total aquaculture feed.
Based on soybean industry conversion factors, SPC can be converted to soybean meal equivalent
volume by applying a factor of 2.38.i, 16
Smaller volumes of soybeans (roasted full-fat soybeans) and soybean oil are also added to
feedstuffs. These volumes were estimated based on data for EU27+UK feed use of soybeans and
soybean oil published by the U.S. Department of Agriculture (USDA) and distributed across
different animal product sectors based on their shares in total feed use.17 For the relatively small
volume of hulls resulting from the crushing of soybeans it is assumed that these are mixed into
g In addition, small amounts of soybean oil are used in aquaculture feed.
h Depending on the production system and geography, the share of SPC varies between approximately 5% and 30%,
and the share of soybean meal between 5% and 20%.
i Based on soy conversion factors provided by the U.S. Soybean Export Council.
Page | 16feeds to reduce the protein content. The relative soy share calculated for aquaculture feed is
influenced by the applied conversion from SPC to soybean meal.
Applying the average shares of soy products to the feed production volumes reported by FEFAC for
the EU27+UK in 2020 suggests a total use of soy products of 25.0 million tonnes, with soybean
meal accounting for 23.4 million tonnes. However, trade statistics point to an approximately 6
million tonnes higher consumption of soybean meal in feedstuffs (Table 7). This divergence may
be due to the use of soybean meal as a single feedstuff in on-farm mixing; higher average soybean
meal shares in industrial compound feeds than suggested by the estimates; a lack of data on the
share of SPC in animal diets; and some compound feed being produced by non-members of
FEFAC. These factors fed into the corrected soybean meal content as provided in Table 8, which
distributes the overall available volume of soybean meal as calculated in Table 7. Due to the lack
of detailed data insights, it is not feasible to apply different corrections per species. These
calculations lead to the conclusion that the average estimated soy content in feed in the EU27+UK
is 19%. The soy content in feed differs between different types of feed, depending on the specific
needs of the animals. Among farm animals, the estimated relative soy share in compound feeds is
highest for broilers (34%), laying hens (21%), and dairy cows (19%).
Table 8 Estimated soy content in different feeds in the EU27+UK (2020)
Soy product in feed (estimates, 1,000 tonnes)
FEFAC Average Total soy
compound feed soybean Soybean meal products
Type Soybean (1,000
production meal Soybeansb
(1,000 tonnes) content (%) Low oilb tonnes)
Correcteda
estimate
Pigs 52,412 10.1% 5,317 6,928 509 17 7,454
Dairy cows 28,682 14.2% 4,064 5,296 278 10 5,584
Cattlec 19,980 3.0% 599 781 194 7 982
Broilers 37,615 25.6% 9,639 12,560 365 13 12,938
Laying hens 17,931 15.1% 2,711 3,532 174 6 3,712
Other meatd 6,885 6.2% 426 556 66 2 624
e
Farmed fish 1,401 45.3% 634 634 - 0 635
Total 164,865 23,390 30,287 1,587 55 31,929
Notes: aIncluding estimates to correct for total soybean meal available for use in compound feeds and as single feedstuff in the
EU27+UK; bEstimates for total use of soybeans and soybean oil in feed based on USDA data; cIncluding milk replacer and part of
reported dairy feed attributable to young calves/old cows; dIncluding sheep, goat, horse, rabbit etc.; eFor aquaculture feed, estimated
average share of 15% SPC and 10% soybean meal; SPC converted to soybean meal equivalent with a factor of 2.38.
Source: Own calculations, based on: FEFAC (2021, July), Industrial compound feed production 1989-2020; Alltech (2021), Global Feed
Survey; Eurostat (2021), "International trade in goods - Detailed data"; Hoste, R. (2016, September), Soy Footprint of Animal Products in
Europe – An Estimation, Wageningen, Netherlands: Wageningen University & Research and IDH, p. 5; Nantier, G. (2019, October),
"Soja die je niet ziet", Veetelt, p. 20; FAO (2021), "FishstatJ - Global Aquaculture production statistics", viewed in December 2021;
Alltech (2021), "Global Feed Survey 2021"; USDA Foreign Agricultural Service (2021), “Production, supply and distribution”, viewed in
December 2021.
With an estimated 32 million tonnes of soy products used in feed, the production of animal
products accounted for around 90% of the total EU27+UK use of soy products (Table 7). Due to its
comparatively high soy content and its role as the second biggest category in compound feed
production, broiler feed accounted with an estimated 13 million tonnes or 41% for the largest share
in the overall use of soy products in feeds in the EU27+UK in 2020. The pork sector accounted for a
share of 23%, followed by dairy cows with 17% (Figure 7).
Page | 17Figure 7 Shares of different animal products in total feed soy use in the EU27+UK (2020)
.
Page | 183
Embedded soy in animal products and
consumption in EU27+UK
Due to the high share of domestic consumption of animal products, consequently also
most of the soy embedded in these products is consumed in the EU27+UK. The 2020 per
capita consumption of a range of different products was linked to an estimated
embedded soy content of 60.6 kg, with animal products accounting for 90% of this soy
consumption.
3.1 Consumption of animal products
The EU27+UK region is a large producer as well as consumer of animal products. Import volumes
of meat and dairy are comparatively small. Exports are considerable for some products, notably
pork with around 30% of production exported, and milk powder with an export share of around
25%, but domestic consumption is generally higher. This leads to the conclusion that most of the
soy embedded in animal products produced in the EU27+UK is for own consumption. Table 9
provides an overview of the estimated production, net-export and consumption of meat, dairy,
eggs, and farmed fish in the region.
Table 9 Production, net export, consumption of animal products in the EU27+UK (2020)
Product group Production Import Export Net-Export Consumption
Meat (1,000 tonnes carcass weight)
Beef & veal 6,822 291 746 454 6,368
Pork meat 23,031 44 7,364 7,320 15,711
Poultry meat 15,376 524 1,881 1,357 14,019
Other meat 796 165 59 -106 902
Eggs & egg products (million eggs)
125,982 1,108 4,962 3,854 122,127
Dairy products (1,000 tonnes)a
Consumption milk 30,333 11 1,056 1,045 29,288
Cream 2,806 2 201 199 2,607
Cheese 10,771 63 935 872 9,899
Butter & butter oil 2,488 4 236 233 2,255
Condensed milk 1,232 1 279 278 954
Milk powder 4,306 3 1,153 1,150 3,156
Yoghurt 8,137 4 79 75 8,061
Page | 19Product group Production Import Export Net-Export Consumption
Other dairy products 4,500 18 277 259 4,241
Farmed fish (1,000 tonnes)
742 1,081 361 -657 1,399
Notes: aNot considering whey and casein resulting from milk processing.
Source: Own calculations, based on: Eurostat, "Slaughtering in slaughterhouses - annual data", viewed in November 2021; Eurostat,
"EU trade since 1995 by HS6", viewed in November 2021; DEFRA (2021), "UK slaughterings and production", viewed in November
2021; DEFRA (2021), "FSA, E&W Poultry Slaughterhouse Survey, DAERA and RESAS", viewed in November 2021; OECD Data
(2018), “Meat consumption”, viewed in November 2021; European Commission (2021, November 17), EU Market Situation for Eggs, p.
10; Egginfo (n.d.), "Egg sizes", viewed in November 2021; EggInfo (2021), "Industry data", viewed in November 2021; Eurostat (2021),
"Milk and milk product statistics", viewed in November 2021; Eurostat (2021), "Cow's milk collection and products obtained", viewed in
December 2021; UK Trade Info (2021), “Overseas trade data table”, viewed in November 2021; FAO (2021), "FishstatJ - Global
Aquaculture production statistics"; European Observatory for Fishery and Aquaculture Products (EUMOFA) (2021), The EU Fish
Market, Brussels, Belgium: European Commission, p. 37;UK Commons Library (2021, November 16), "UK fisheries statistics", viewed in
November 2021.
Table 10 shows the estimated per capita consumption of animal products in the EU27+UK. Based
on a total population of 515 million,18 an EU27+UK-citizen on average roughly consumed 58 kg of
pork, poultry, beef, and other meat (in retail weight), 237 eggs, 117 kg of various dairy products and
2 kg of farmed fish per year. This corresponds to a daily consumption of about 160 grams of meat,
two-thirds of an egg, 320 grams of dairy products and 7 grams of farmed fish.
Table 10 Per capita consumption of animal products in the EU27+UK (2020)
Annual per capita consumption
Product (group)
(in kg / number of eggs)
Meat (retail weight) 58.0
Beef & veal 8.7
Pork meat 23.8
Poultry meat 24.0
Other meat 1.5
Eggs & egg products (number of eggs) 237
Dairy products (weight) 117.5
Consumption milk 56.9
Cream 5.1
Cheese 19.2
Butter & butter oil 4.4
Condensed milk 1.9
Milk powder 6.1
Yoghurt 15.7
Other dairy products 8.2
Farmed fish (retail weight) 2.4
Note: Based on the following carcass weight to retail weight conversion factors: 0.7 for beef, 0.78 for pigmeat, and 0.88 for poultry and
other meat (based on average sheep meat conversion), 0.9 for farmed fish.
Source: Input from Table 9; Eurostat (2020, July 10), EU Population in 2020; conversion rates from OECD (2021), “Meat consumption”,
OECD data, online: https://data.oecd.org/agroutput/meat-consumption.htm, viewed in November 2021; USDA Foreign Agriculture
Service (1992, June), Weights, Measures and Conversion Factors for Agricultural Commodities and their Products, Washington:
Agricultural Handbook Number 697, p. 38.
Page | 203.2 Consumption of embedded soy in the EU27+UK
Table 11 presents an overview on the estimated amount of soy needed for the EU27+UK
consumption of animal products with embedded soy and other products in which soy is directly
processed. In total, an estimated 31 million tonnes of soy products were required for domestic
consumption, of which soybean meal accounted for 27 million tonnes or 86%.
Table 11 Soy consumption in the EU27+UK (2020)
Consumption Soy volume
(1,000 tonnes) Embedded soy
(1,000 tonnes of
Product (group) products
meat/dairy/fish
Soy- Soybean Soybean (gr/kg, gr/egg)a
or million eggs) Total
beans meal oil
Meat (carcass weight) 37,000 936 17,536 32 18,505 500
Beef & veal 6,368 181 729 6 916 144
Pork meat 15,711 347 4,726 12 5,085 324
Poultry meat 14,019 333 11,451 11 11,796 841
Other meat 902 75 629 3 707 784
Eggs and egg products 122,127 169 3,424 6 3,599 29
Dairy products 60,462 247 4,692 8 4,947 82
Consumption milk 29,288 49 926 2 976 33
Cream 2,607 4 84 0 88 34
Cheese 9,899 121 2,296 4 2,421 245
Butter & butter oil 2,255 5 101 0 106 47
Condensed milk 954 4 70 0 73 77
Milk powder 3,156 44 841 2 887 281
Yoghurt 8,061 14 259 0 273 34
Other dairy products 4,241 6 115 0 121 29
Farmed fish 1,399 - 1,196 1 1,197 856
Sub-total animal products 1,352 26,848 47 28,247
Other products 258 - 2,691 2,950
Food products 258 - 1,528 1,786
Biodiesel - - 1,163 1,163
Total consumption 1,610 26,848 2,738 31,197
Note: aIn italics, average soy content across product groups; for meat and fish based on carcass weight.
Source: Own calculations based on Table 7, Table 8, Table 10; USDA Foreign Agriculture Service, "Production, supply and distribution
online", viewed in November 2021; ISTA Mielke (2021), Oil World Annual 2021, Hamburg, Germany: ISTA Mielke.
Page | 21The 2020 per capita consumption of a range of different products by the 515 million inhabitants of
the EU27+UK was linked to an estimated embedded or direct soy content of 60.6 kg (Table 12).
With 54.9 kg, the largest share of soy products is embedded in the consumption of animal
products.
Table 12 Per capita soy consumption in the EU27+UK (2020)
Annual per capita
(Embedded) soy Annual per capita
consumption
Product (group) products (gr/kg, consumption
(in kg / number of
gr/egg) (embedded) soy (kg)
eggs)
Meat (retail weight) 35.9
Beef & veal 8.7 206 1.8
Pork meat 23.8 415 9.9
Poultry meat 24.0 956 22.9
Other meat 1.5 891 1.4
Eggs and egg products 7.0
237 29 7.0
Dairy products 9.6
Consumption milk 56.9 33 1.9
Cream 5.1 34 0.2
Cheese 19.2 245 4.7
Butter 4.4 47 0.2
Condensed milk 1.9 77 0.1
Milk powder 6.1 281 1.7
Yoghurt 15.7 34 0.5
Other dairy products 8.2 29 0.2
Farmed fish (retail weight) 2.3
2.4 951 2.3
Sub-total animal products 54.9
Other products 5.7
Food products 3.5
Biodiesel 2.3
Total embedded soy consumption 60.6
Note: Difference in embedded soy content with Table 11 due to conversion to retail weight.
Source: Own calculations, input from Table 10, Table 11.
Page | 223.3 Embedded soy consumption per iconic product
Table 13 shows the estimated embedded soy consumption for several iconic animal products.j,19
Table 13 Embedded soy consumption per iconic product in the EU27+UK in 2020
Product Embedded soy (in gr)
Hamburger (100 gr of beef) 21
Pork meat (100 gr) 41
Pork sausage (50 gr)a 13
Chicken breast (100 gr) 96
Egg (55 gr) 29
Cheese (100 gr) 24
Glass of milk (200 ml) 7
Bowl of yoghurt (200 ml) 7
Salmon filet (100 gr)b 95
Note: aAssuming a weight of 50 grams for a pork sausage containing 65% of pork meat; bEstimated SPC content converted to soybean
meal equivalent.
Source: Own calculations, input from Table 8, Table 9, Table 11.
j While some animal products are linked to lower shares of embedded soy, this does not automatically imply an overall
lower resource consumption but may be linked to large volumes of other crop ingredients and co-products consumed
in feed.
Page | 23References
1 Kuepper, B. and M. Riemersma (2019), European Soy Monitor, Amsterdam, Netherlands: IUCN Netherlands and IDH,
p. 15.
2 Bloomberg News (8 March 2021), “Disease that wiped out millions of pigs is creeping back in Asia”, online:
https://www.bloomberg.com/news/articles/2021-03-08/disease-that-wiped-out-millions-of-pigs-is-creeping-back-
in-asia?sref=q8seIhDd, viewed in November 2021;
Gro Intelligence (2019, November 27), “How African Swine Fever in China is shaking up world trade flows, online:
https://gro-intelligence.com/insights/articles/how-african-swine-fever-in-china-is-shaking-up-world-trade-flows,
viewed in November 2021.
3 Patterson, W. (2020, Aug 21), “Chinese purchases of US soybeans pick up”, ING THINK Economic and Financial
Analysis, online: https://think.ing.com/articles/chinese-purchases-of-us-soybeans-pick-up/, viewed in November
2021;
Voora, V. C. Larrea and S. Bermúdez (October 2020), Global Market Report: Soybeans, Sustainable Commodities
Marketplace Series 2019, International Institute for Sustainable Development and State of Sustainability Initiatives,
p.4.
4 Trase (2020, July), Trase Yearbook 2020 – The State of Forest-Risk Supply Chains, p. 5.
5 FEFAC (2021), EU Industrial Compound Feed Production, p. 3.
6 FEFAC (2020), From Farm to Table: 2020 Feed Statistics in Charts, p. 4.
7 European Commission (2018, November), Report from the Commission to the Council and the European Parliament
on the Development of Plant Proteins in Europe, p. 3;
EIP Agri Focus Group (2014, April), Protein Crops: Final Report, p. 11.
8 FEFAC (2020), From Farm to Table: 2020 Feed Statistics in Charts, p. 33.
9 FEFAC (2018), Industrial Compound Feed Production 1989-2017.
10 Alltech (2021), 2021 Global Feed Survey, p. 9.
11 Hoste, R. (2016, September), Soy Footprint of Animal Products in Europe – An Estimation, Wageningen, Netherlands:
Wageningen University & Research and IDH, p. 5.
12 FEFAC (2021), EU Industrial Compound Feed Production, p. 13.
13 Nantier, G. (2019, October), "Soja die je niet ziet", Veetelt, p. 20..
14 FAO (2021), "FishstatJ - Global Aquaculture production statistics", viewed in December 2021;
Alltech (2021), "Global Feed Survey 2021", online: https://www.alltech.com/2021-global-feed-
survey/results?submissionGuid=e0d20127-3529-4443-83fc-353a7f20afb4, viewed in January 2021.
15 Confidential industry data, available to Profundo.
16 U.S. Soybean Export Council (USSEC) (n.d.), “Conversion table”, online: https://ussec.org/resources/conversion-
table/, viewed in December 2021;
Rainforest Foundation Norway & Framtiden (2017), From Brazilian Farms to Norwegian Tables.
17 USDA Foreign Agriculture Service, "Production, supply and distribution online", online:
https://apps.fas.usda.gov/psdonline/app/index.html#/app/advQuery, viewed in November 2021
18 Eurostat (2020, July 10), EU Population in 2020.
19 Feed & Additive (2021), “FutureEUAqua and sustainable innovative tailor-made fish diets”, online:
https://www.feedandadditive.com/futureeuaqua-and-sustainable-innovative-tailor-made-fish-diets/, viewed in
November 2021;
FAO (2021), “FishStatJ”, viewed in November 2021.
Page | 24Page | 25
You can also read