Headwater Exploration Inc - CORPORATE PRESENTATION March 2022
←
→
Page content transcription
If your browser does not render page correctly, please read the page content below
Headwater Exploration Inc.

 CORPORATE PRESENTATION

  TSX:HWX                    March 2022
CAPITALIZATION, GUIDANCE AND BUSINESS STRATEGY

                                                  Outlook                                                                  Capitalization
                                                                2022 Original   Revised 2022
                                                                                               Headwater Exploration Inc.                         TSX     HWX
                                                                  Guidance       Guidance
 Average Daily Production (1)                                                                  Share Price (March 9th, 2022)                     $/sh.    $6.94
 Annual Daily Production (boe/d)                                   12,500          12,500      Shares Outstanding (Basic)                         MM      223.7
 Q4 Average Daily Production(boe/d)                                15,000          15,000
                                                                                               Dilutives (Avg strike $1.68/share) (4)             MM      18.0
                                                                                               Shares Outstanding (Fully Diluted) (4)             MM      241.7
 Financial Summary ($millions)
                                                                                               2021 Exit Adjusted Working Capital (3)            $MM      $93
 Capital Expenditures (2)                                           120             145
 Adjusted Funds Flow From Operations (3)                            207             259
 Exit Adjusted Working Capital (3)                                  183             207                                 Business Strategy

                                                                                                        Build a sustainable core business with no debt
 Pricing and Key Assumptions
 Crude Oil – WTI (US$/bbl)                                           75.00          88.00                  Grow the sustainable business through
 Crude Oil – WCS (CDN$/bbl)                                          74.00          97.00              exploitation and evaluation of exploration lands

                                                                                                      Add incremental prospects through strategic land
                                                                                                                       acquisitions

                                                                                                        Implement secondary recovery where returns
                                                                                                                      justify capital

                                                                                                       Pursue M&A that creates incremental long term
                                                                                                                    shareholder value

                                                                                                         Implement a return of capital strategy at the
                                                                                                                      appropriate time

See Slide Notes and Advisories including "Non-GAAP Advisory".
                                                                                                                                                                  1
CORE AREA DEVELOPMENT OUTLOOK

                                                 5 Year Core Area Development Strategy (1) @ US $88/$80/$75 bbl WTI
                                   16,000

                                   14,000

                                   12,000
                Production boepd

                                   10,000

                                    8,000

                                    6,000

                                    4,000

                                    2,000

                                       0
                                        2021                      2022                              2023                     2024                                        2025                              2026
                                                                                                             Core Area Development

                                                       Production                         Capital Reinvestment                   Free Cash        Adjusted Working Distributable
                                                                           AFFO
                                                                                        Program (1)  Rate (2)                      Flow               Capital (3)  Cash per FD
                                                                           $MM
                                                        Boe/d                              $MM         (%)                         $MM                  $MM           share (4)
                                               2022E    12,100              251             87        35%                           164                  257           $1.19
                                               2023E    13,700              218             64        29%                           154                  411           $1.82
                                               2024E    14,500              203             59        29%                           145                  568           $2.42
                                               2025E    14,500              193              6         3%                           187                  772           $3.20
                                               2026E    14,500              188              0         0%                           187                  960           $3.97

The Company has presented herein a five-year base strategy on its core development based on US$88/bbl WTI (2022), US$80/bbl WTI (2023) and US$75/bbl WTI (2024-2026) and certain other commodity price and other assumptions. Such
five-year base strategy is not based on a budget or capital expenditures plan approved by the Board of Directors of the Company beyond 2022. See “Advisory Relating to Five-Year Base Strategy” under Advisories. See Slide Notes and
Advisories including "Non-GAAP Advisory".
                                                                                                                                                                                                                                        2
CORE AREA SUMMARY
                                                                                                                          Core Area

                                                                                                    Asset Duration
                                                                                                    •    Production built to 14,500 boe/d and
                                                                                                         maintained with minimal reinvestment
                                                                                                    •    Implementation of secondary recovery
                                                                                                            • Decrease corporate decline to 10-12%
                                                                                                            • Increase RLI(1) to 12-16 years
                                                                             Core Area
                                                                                                            • Expect 100% of lands under waterflood by
                                                                                                              year-end 2024

                                                                                                    Facilities
                                                                                                            • 15,000 bbls/d oil processing facility fully
                                                                                                              commissioned that will reduce
                                                                                                              transportation costs by $4.00/bbl

                                                                                                    2022 Development Program
                                                         Core Area Results                                  • ~20, 6-leg lateral producing wells

  •       Production grown from 3,000 bbls/d in Jan 2021 to current levels of 10,500 bbls/d                 • ~32, 4-leg lateral Injection wells
                                                                                                            • 6 stratigraphic test and source wells
  •       Reduced GHG emissions intensity by approximately 50% throughout 2021
                                                                                                            • Expect ~50% of core area under
  •       Increased core area total proved plus probable reserves from 9.3 MMboe to 18.4
          MMboe
                                                                                                              waterflood by Q1 2023

  •       Implemented three waterflood pilots resulting in first waterflood reserves recognized
          by independent evaluators
  •       Based on positive waterflood results, we expect to have 45% of core area (35 injectors)
          on injection by year end 2022, with a total of 21 wells on injection by July 1st, 2022

See Slide Notes and Advisories including "Non-GAAP Advisory".
                                                                                                                                                            3
WATERFLOOD IMPLEMENTATION
Waterflood Pilots and 2022 Expansion
00/16-35-074-25W4/00 (15-34) (8 Legs)
First Oil Date: 2019-12-17
Year-end 2022 – 39 injectors drilled 900
Data Current to: 2022-02-27
10000
~50% of core under waterflood Total Fluid (bbl/d)
by Q1 2023 Oil (bbl/d)
800 Injection (bbl/d)
GOR (scf/bbl)
BS&W (%) 1000
700
600
GOR (scf/bbl), BS&W (%)
100
Rate (bbl/d)
500
400
10
300
200
1
100
0 0.1
0 50,000 100,000 150,000 200,000 250,000 300,000
Cumulative Oil (bbl)
07/16-26-074-25W4/00 (16-27) (6 Legs) 03/02-35-074-25W4/03 (16-27) (6 Legs)
First Oil Date: 2021-09-21 First Oil Date: 2021-08-01
Data Current to: 2022-02-27 Data Current to: 2022-02-27
600 1000 500 1000
Total Fluid (bbl/d) Total Fluid (bbl/d)
Oil (bbl/d) Oil (bbl/d)
Injection (bbl/d)
450 Injection (bbl/d)
GOR (scf/bbl) GOR (scf/bbl)
500
BS&W (%) 400 BS&W (%)
100 100
350
400
GOR (scf/bbl), BS&W (%)
GOR (scf/bbl), BS&W (%)
300
Rate (bbl/d)
Rate (bbl/d)
300 10 250 10
200
200
150
1 1
100
100
50
0 0.1 0 0.1
0 10,000 20,000 30,000 40,000 50,000 60,000 0 10,000 20,000 30,000 40,000 50,000 60,000
Cumulative Oil (bbl) Cumulative Oil (bbl)
See Advisories
4
HEADWATER - YEAR END 2021 RESERVES SUMMARY

                                                                                      2021 Year End Reserves

                             Reserve Category                                                                    Year Over Year
                                                            Heavy Oil (1)       Gas               Total                           Recycle
                                                                                                                    Change
                                                              (Mbbl)          (MMcf)             (Mboe)                            Ratio
                                                                                                                      (%)

                                 Proved Producing               6,645            19,039            9,818                96%         2.4

                                   Total Proved                 11,992           22,027           15,663                65%         2.2

                        Total Proved Plus Probable              18,871           29,517           23,790                82%         3.2

                                                                         NOTES

1)    Heavy oil volumes include heavy crude oil and natural gas liquids
2)    Total future development costs of $88.6 million proved reserves and $94.3 million proved plus probable reserves
3)    No undeveloped locations are included for the McCully asset
4)    42 undeveloped locations have been included in the Marten Hills area

See Slide Notes and Advisories
                                                                                                                                            5
EXPLORATION SUCCESS

                                                                        13-07-076-02W5 RR: 12/17/2021
                                                                        IP 60: 215 bbls/d, 19° API
                                                                          11-05-076-02W5 RR: 12/08/2021
                                                                          IP 60: 225 bbls/d 21° API

                                                                                          15-29-075-01W5
                                                                                          RR: 01/16/2022
                                                                                          IP24: 82 bbls/d, 21° API

         CLGP B 08-34-075-03W5 RR: 11/27/2021
         IP 60 - 149 bbls/d 19° API                                                                                                      Core Area
         100/09-34-075-03W5 RR: 02/22/2022
         Current prod. post load > 200 bbls/d                                                        16-27-074-01W5
                                                                                                     RR: 01/26/2022
                                                                                                     Current prod. post load: 50 bbls/d, 18° API

                                                                Exploration Well Economics - US$80/bbl WTI
                                             IP 30 bbls/d (1)            EUR            Payout (2)        NPV 10 (3)
                                                                         mbbls           Months             ($M)
                                                      75                   77               17               1,400
                                                     100                  103               12               2,400
                                                     150                  154               8                4,300
                                                     200                  200               6                5,700
                                                     250                  250               5                7,440

See Slide Notes and Advisories including "Non-GAAP Advisory".                                                                                        6
REGIONAL CLEARWATER

                                                                          West Marten Hills
                                        CLGP B Regional Shoreface Trend
                               Nipisi

See Slide Notes & Advisories
                                                                                              7
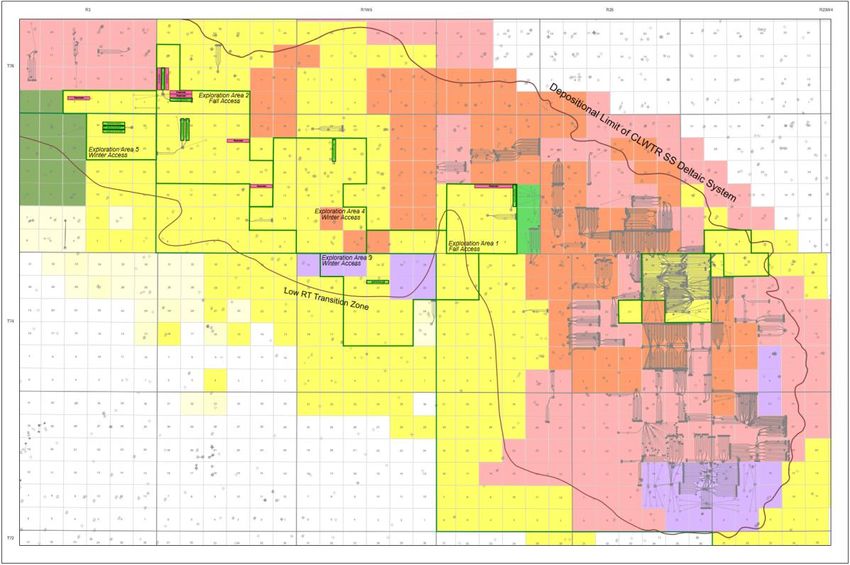
WEST MARTEN HILLS CLEARWATER A DELTA COMPLEX

                                               West Marten Hills Delta Complex:

                                               •   Delineation/exploration drilling
                                                   has proven hydrocarbon charge
                                                   of 17-21° API oil along a ~25km
                                                   long, 6km wide fairway

                                               •   Expected variability encountered
                                                   with IP rates of 70-270 bbls/d at
                                                   100% economic success

                                               •   Further delineation now required
                                                   to establish areas with
                                                   secondary recovery potential

See Slide Notes & Advisories
                                                                                  8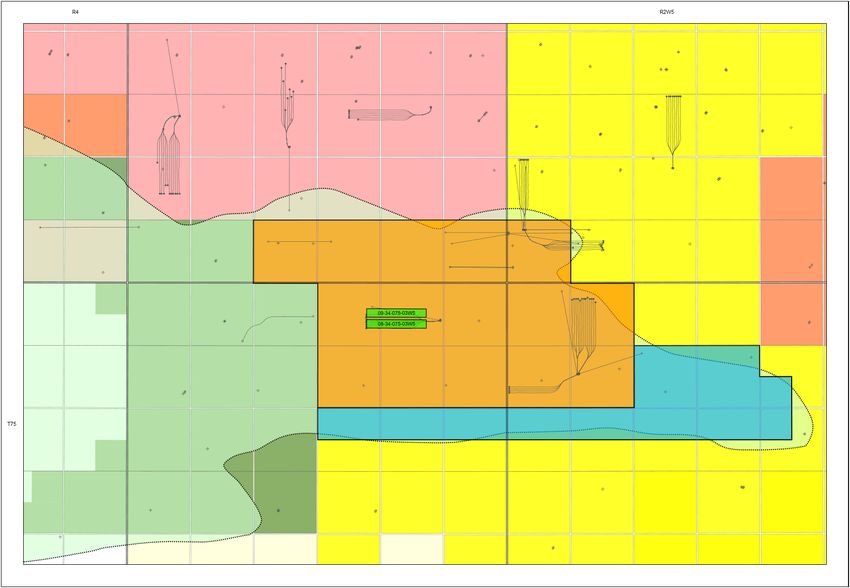
EXPLORATION SUCCESS
 Clearwater A – West Marten Hills Delta Complex

                                                                                    Clearwater A Discovery
                                                                                    • 27.5 Identified Low Risk Sections
                                                                                    • 36 Identified Medium Risk Sections
                                                                                    • Viscosity suggests strong waterflood
                                                                                      potential
                                                               15-29-075-01W5
                                                               RR: 01/16/2022       • Prospective and Identified areas have OOIP
                                                               IP24: 82 bbls/d        ranging from 7-30 MMBbl/section
                                 Low Risk
                                                               API – 21°

                                            Medium Risk
                                                                                   Low Risk

                                                                                   Medium Risk

                                                                                                                      Low Risk

                                                                                 16-27-074-01W5
                                                          Medium Risk            RR: 01/26/2022
                                                                                 Current prod: 50 bbls/d
                                                                                 API – 18°

See Slide Notes and Advisories                                                                                                     9
CLEARWATER B SHOREFACE TREND
Spur 100/15-19-076-03W5 CLGP B Discovery
Spud: 01/03/2022
• 15 Identified Low Risk Sections
• 6 Identified Medium Risk Sections
• Viscosity suggests strong waterflood potential and
possible extension of pool boundaries
• OOIP: 5-15 MMBbl/section
Spur 100/15-19-076-03W5
Spur 100/15-02-076-04W5 RR: 01/23/2022
Spud: 01/14/2022
TVE CLGP B 102/08-33-075-03W5
IP15: 175 bbls/d
CLGP B 100/09-34-075-03W5 RR: 02/22/2022
IP Post load > 200 bbls/d
CLGP B 100/08-34-075-03W5
RR: 11/27/2021 IP 60: 149 bbls/d 19° API
See Slide Notes & Advisories
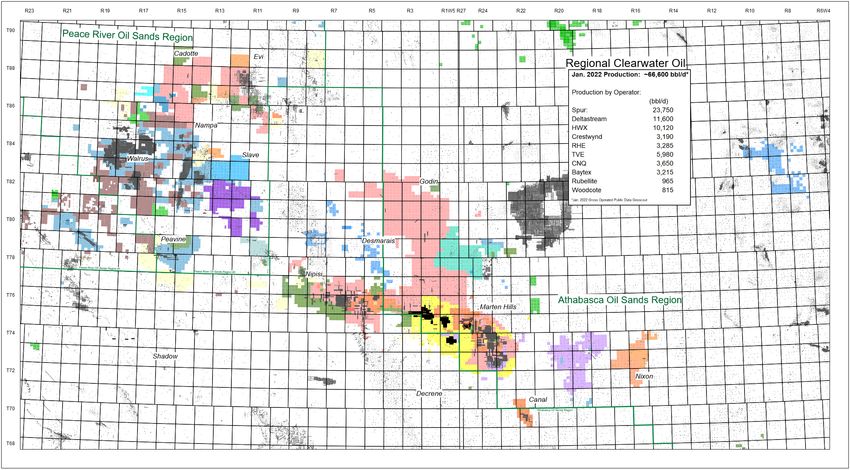
10EXPLORATION UPSIDE
Exploration Strategy
• 350 sections of exploration
Illustrative Exploration Upside lands
20,000 • Exploration drilling to account
for 5-10% of AFFO
18,000
16,000 Exploitation Strategy
14,000 • Multiple successful discoveries
Production boepd
12,000
executed in 2021 de-risking 43
sections of exploration acreage
10,000 • Follow-up successful tests with
scaled development
8,000
• Continue to test existing and newly
6,000 acquired exploration lands
• Secondary recovery
4,000
implementation where returns
2,000 justify capital
• Self funding development within 2
0 years resulting in increased free
2021 2022 2023 2024 2025 2026 cash flow
Low Risk Medium Risk
• HWX type well of 115-150 bbls/d
IP30(1)
See Slide Notes and Advisories including "Non-GAAP Advisory".
11CLEARWATER REGIONAL MAP
Strategy
• Additional prospective lands will be
added through crown land sales and
other M&A
• The team is experienced and
proficient with M&A and continues to
be patient
• If profitable consolidation is not
possible, significant capital will be
returned to shareholders
See Slide Notes
12WHY HEADWATER
Upside Opportunity Sustainability Resiliency
▪ Exploration upside with 350 ▪ Zero leverage maintained through
▪ EOR implementation reducing
sections of exploration lands business cycle
sustaining capital requirements
▪ Exploration success has validated ▪ Expected reinvestment rate of 55% in
▪ Return of capital strategy when
significant additional inventory and 2022 that falls toHeadwater Exploration Inc. Appendix TSX:HWX
MANAGEMENT ALIGNMENT AND ESG LEADERSHIP

             Board and Management Alignment                                                                                                                        ESG Leadership

     Insiders are Owners First                                                                                                              Scope 1 Emissions Intensity Comparison To
                                                                                                                                               Industry Peer Group (kgCO2e/boe)

                                                                                                    Emissions Intensity (kg CO2e/boe)
            ▪ 6% of basic shares
                                                                                                                                        40.0
            ▪ 13% of fully diluted shares                                                                                               35.0
                                                                                                                                        30.0
                                                                                                                                        25.0
     Short Term Incentive Plan                                                                                                           20.0
            ▪ Shareholder return 50%                                                                                                     15.0
                                                                                                                                         10.0
            ▪ Financial and operational                                                                                                   5.0
              performance 30%                                                                                                              0.0
                                                                                                                                                   Peer
            ▪ ESG 20%                                                                                                                             Group
                                                                                                                                                         HWX Q1
                                                                                                                                                                  HWX Q2
                                                                                                                                                                           HWX Q3
                                                                                                                                                 Average                            HWX Q4
                                                                                                                                                                                              HWX
                                                                                                                                                                                             (2022E)
     Long Term Incentive Plan
            ▪ Currently 100% allocated to
                                                                                            Emissions Intensity
              stock options
                                                                                            ▪ Top decile performer in peer group emissions intensity with an estimated 50% reduction in
                                                                                              scope 1 emissions over the 2021 calendar year
     No Management Contracts                                                                ▪ With exploration success corporate emissions intensity is forecasted to increase in 2022
                                                                                                      ▪ Core area 2022 forecast 16 kgCO2e/boe
                                                                                                      ▪ Exploration 2022 forecast 8 kgCO2e/boe
                                                                                                      ▪ Total 2022 forecasted emissions 24 kgCO2e/boe
                                                                                            ▪ Exploration area infrastructure being evaluated with gas egress expected by Q1 2023
                                                                                            Fresh Water Usage Intensity
                                                                                            ▪ With the conversion to oil-based drilling fluids, HWX’s freshwater use is less than 0.010 m3/m
                                                                                              drilled
                                                                                            ▪ Waterflooding to be completed with 100% saline water
                                                                                            Safety
                                                                                            ▪ Industry leading Total Recordable Incident Frequency and Lost Time Injury Frequency
                                                                                            Indigenous Engagement
See Advisories
(1) Peer data as per annual sustainability reports. Peers include WCP, CPG, TVE, ERF, CJ.
                                                                                            ▪ Active partner with Treaty 8 Nations supporting indigenous businesses and community
                                                                                              initiatives                                                                                              15
MCCULLY PRODUCING ASSET
DRY GAS WITH 100% OWNED INFRASTRUCTURE AND LIMITED LIABILITY
McCully Asset Daily Production
McCulley Daily Production mcfd
30,000
Average year over year
Production period
25,000
decline since intermittent New Brunswick
20,000 production implemented is MNP pipeline
4.2% per year
Production mcfd
15,000
10,000
Nova Scotia
5,000
0
Jan-08 Jan-09 Jan-10 Jan-11 Jan-12 Jan-13 Jan-14 Jan-15 Jan-16 Jan-17 Jan-18 Jan-19 Jan-20 Jan-21 Jan-22
HWX Realized Pricing and Winter 2021/22 Strip (US$/MMBTU) Operational Summary
Decline Rate % 5% - 7%
P+P producing RLI (1) years 16
Undiscounted uninflated ARO (2) $MM 11.7
Gross producing wells 32
Net producing wells 24.5
Production period
Production period
Production period
Production period
Production period
Production period
Production period
Sales capacity mmscf/d 15
2021 free cash flow (4) $MM 9.6
2022 est. free cash flow (3) (4) $MM ~ 17
• Asset is produced November through April and shut-in during summer months
to capture premium pricing as highlighted in this slide
• Algonquin City-Gate is a unique Boston area demand driven market offering
premium winter pricing with a historical Dec - Mar strip basis premium to
NYMEX of > US$4.00/mmbtu
See Slide Notes and Advisories including "Non-GAAP Advisory".
16OTHER CLEARWATER WATERFLOOD PILOTS
Spur Marten Hills Section 32-073-24W4 (Grandpa Burger)
• 4 leg producer (F1), 6 leg producer (F2), 5 leg injector (F3)
• Bottom waterflood
• Injecting at 431 bbls/day (1.4x VRRi Full Pattern )
• Gas-Oil-Ratio decreasing
• No premature water breakthrough
• Approximately 300-400 days of injection prior to oil rate
increasing
F2 producer is showing positive response with decreasing GOR, stable F1 producer is showing positive response with decreasing GOR, stable
water cut and increasing oil rates water cut and increasing oil rates
Operator: Spur Petrl Ltd 103/14-32-073-24W4/00 First Prod: May-18 Operator: Spur Petrl Ltd 100/14-32-073-24W4/00 First Prod: May-18
6 Legs / 11,009m Total Lateral Length Last Prod: Jan-22 4 Legs / 7,243m Total Lateral Length Last Prod: Jan-22
450 10000 450 10000
Oil (bbl/d) Oil (bbl/d)
Injection (bbl/d) Injection (bbl/d)
400 BS&W (%) 400 BS&W (%)
GOR (scf/bbl) GOR (scf/bbl)
350 350
1000 1000
300 300
GOR (scf/bbl), BS&W (%)
GOR (scf/bbl), BS&W (%)
Rate (bbl/d)
Rate (bbl/d)
250 250
100 100
200 200
150 150
10 10
100 100
50 50
0 1 0 1
0 20,000 40,000 60,000 80,000 100,000 120,000 140,000 160,000 180,000 0 20,000 40,000 60,000 80,000 100,000 120,000 140,000 160,000
Cumulative Oil (bbl) Cumulative Oil (bbl)
See Slide Notes and Advisories 17OTHER CLEARWATER WATERFLOOD PILOTS
Spur Marten Hills Section 20-074-25W4
• 6 leg producer (F1), 6 leg injector (F2)
• Bottom waterflood
• Injecting at 155 bbls/day (1.5x VRRi)
• Gas-Oil-Ratio continues to decrease
• No premature water breakthrough
• Oil rates continue to increase towards initial peak rates
• Current cumulative voidage replacement of 1.24x
Operator: Spur Petrl Ltd 103/13-20-074-25W4/00 First Prod: Sep-18 Operator: Spur Petrl Ltd 103/13-20-074-25W4/00 First Prod: Sep-18
6 Legs / 11,854m Total Lateral Length Last Prod: Jan-22 6 Legs / 11,854m Total Lateral Length Last Prod: Jan-22
300 1000 300 1000
Oil (bbl/d) Oil (bbl/d)
Injection (bbl/d) Injection (bbl/d)
BS&W (%) BS&W (%)
GOR (scf/bbl) GOR (scf/bbl)
250 250
200 100 200 100
GOR (scf/bbl), BS&W (%)
GOR (scf/bbl), BS&W (%)
Rate (bbl/d)
150 Rate (bbl/d) 150
100 10 100 10
50 50
0 1 0 1
0 10,000 20,000 30,000 40,000 50,000 60,000 70,000 80,000 90,000 100,000 0 200 400 600 800 1,000 1,200 1,400 1,600
Cumulative Oil (bbl) Days
See Slide Notes and Advisories 18EXPERIENCED TEAM
Headwater Exploration Inc.
Management Team
Neil Roszell, P. Eng. ▪ Former President, CEO and/or Executive Chairman and founder of Raging River Exploration Inc., Wild Stream Exploration Inc.
CEO & Chairman and Wild River Resources Ltd.
Jason Jaskela, P. Eng.
▪ Former COO and founder of Raging River Exploration Inc. and VP Production and founder of Wild Stream Exploration Inc.
President, COO & Director
Terry Danku, P. Eng.
▪ Former VP, Engineering of Raging River Exploration Inc. and Engineering Manager of Wild Stream Exploration Inc.
Vice President, Engineering
Jonathan Grimwood, P.Geo
▪ Former VP, Exploration of Raging River Exploration Inc., President of and founder of RMP Energy Inc.
Vice President, Exploration
Ali Horvath, CA, CPA
▪ Former Controller and founder of Raging River Exploration Inc. and Wild Stream Exploration Inc.
CFO & Vice President Finance
Scott Rideout
▪ Former VP, Land of Raging River Exploration Inc. and Manager Business Development and Land of Surge Energy Inc.
Vice President, Land
Brad Christman
▪ Former Manager of Production and Facilities and founder of Raging River Exploration Inc.
Vice President, Production
Kevin Olson ▪ Former director of Raging River Exploration Inc., Wild Stream Exploration Inc. and Wild River Resources Ltd.
Chandra Henry ▪ Currently CFO & Chief Compliance Officer of Longbow Capital Inc. and Director of Bonavista Energy Corp.
Stephen Larke ▪ Currently Director with Vermilion Energy Inc. and Topaz Energy Corp.
Dave Pearce ▪ Currently Deputy Managing Partner with Azimuth Capital Management and former director of Raging River Exploration Inc.
Phillip Knoll ▪ Director of Corridor since 2010. Formerly CEO of Corridor and currently a director of AltaGas Ltd.
Kam Sandhar ▪ Currently Cenovus’s Executive Vice-President, Strategy & Corporate Development
19SLIDE NOTES
Slide 1
1. Forecasted 2022 annual average production of 12,500 boe/d is comprised of 11,500 bbls/d of heavy oil and 6.2 mmcf/d of natural gas. Forecasted fourth quarter 2022 production of 15,000 boe/d is comprised of
13,770 bbls/d of heavy oil and 7.4 mmcf/d of natural gas.
2. Capital expenditures is a non-GAAP measure. Please refer to Non-GAAP Advisory.
3. Adjusted funds flow from operations and exit adjusted working capital are capital management measures. Please refer to Non-GAAP Advisory.
4. Basic shares outstanding consists of 223.7 million common shares of Headwater (“Headwater Shares”) as at March 9, 2022. Fully diluted shares outstanding includes 8.6 million non-brokered private placement
warrants outstanding at a strike price $0.92/share and 9.4 million stock options outstanding at a weighted average strike price of $2.38. The warrants issued pursuant to the non-brokered private placement have
vested and are fully exercisable.
Slide 2
Refer to Advisory Relating to Five-Year Base Strategy.
1. Capital expenditures includes capital spending before acquisitions, dispositions and other corporate expenditures on core development only. No exploration capital is included in 2022-2026.
2. Reinvestment rate is calculated as capital expenditures divided by adjusted funds flow.
3. Adjusted working capital includes proceeds from dilutive instruments.
4. Distributable cash per fully diluted (“FD”) share is calculated as adjusted working capital plus fully diluted instrument proceeds divided by fully diluted shares outstanding (see slide 1).
5. Funds flow from operations and adjusted working capital are capital measurement measures. Capital expenditures (also capital program) and free cash flow are non-GAAP measures. Reinvestment rate and
distributable cash per FD share are non-GAAP ratios. Please refer to Non-GAAP Advisory.
Slide 3
1. Estimated Reserve Life Index (“RLI”) is calculated using estimated recoverable oil of 60 - 80 mmstb divided by annual sustainable production of 14,500 boe/d in the core development area. The RLI is calculated using
an estimated recovery factor of 10-12%. Recovery factor is based on management's analysis and interpretation of the results from analogous waterflood projects and pilots in the greater Clearwater area including
management's analysis of how such results may apply to the Company's assets, refer to Advisories.
2. Reserve Life Index and Corporate decline – Refer to Oil and Gas Metrics.
Slide 5
1. Recycle ratio is a non-GAAP ratio. Please refer to Non-GAAP Advisory.
Slide 6
1. IP30: The average hydrocarbon production rate for the first 30 days of a well's life, post load recovery.
2. Payout is a specified financial measure. Please refer to Non-GAAP Advisory.
3. The net present value (“NPV10”) is the anticipated net present value of the future operating cash flow after capital expenditures, discounted at a rate of 10% (before tax). Assumptions include US$80/bbl WTI and
per well capital expenditures of $1.6 million.
4. See Well Economics Advisory.
5. EUR is estimated ultimate recovery. See EUR advisory.
Slide 7
1. Pool outline based on management’s internal geotechnical interpretation.
Slide 8-10
1. See Exploration Lands Advisory.
Slide 11
1. IP30: The average hydrocarbon production rate for the first 30 days of a well's life, post load recovery.
2. See Exploration Lands Advisory.
3. Free cash flow is a non-GAAP measure. Please refer to Non-GAAP Advisory.
Slide 12, 17 & 18
Public data obtained from geoSCOUT.
Slide 13
1. ARO as at December 31, 2021.
2. Reinvestment rate is a non-GAAP measure. Please refer to Non-GAAP Advisory.
20SLIDE NOTES
Slide 16
1. Proved plus probable producing (P+P) reserves life index (“RLI”) is calculated by dividing the P+P producing reserves by the average annual production for 2021.
2. As at December 31, 2021.
3. Headwater has made the following assumptions:
2022E
AGT (1) US$/mmbtu $ 14.20
FX US$/Cdn$ 0.79
Pricing reflects natural gas production through the winter producing months (January to April, November, December).
4. Free cash flow is a non-GAAP measure. Please refer to Non-GAAP Advisory.
21ADVISORIES
Forward Looking Statements Advisory
This investor presentation of Headwater Exploration Inc. ("Headwater") contains forward-looking statements and forward-looking information (collectively, "forward-looking statements"). More particularly, this
investor presentation contains forward-looking statements concerning: 2022 guidance including annual 2022 daily production, Q4 2022 daily production, 2022 capital expenditures and details of such capital
expenditures, adjusted funds flow from operations and exit adjusted working capital; Headwater's business strategies and the expected benefits of such strategy; the expectation that production under the core
area will be built to 14,500boe/d and maintained with minimal reinvestment; expected declines rates; expected reserves life index associated with core area development; the number of potential sections with
exploration potential; certain expected type curve and economics associated with drilling and waterflood operations; the future success associated with waterflood implementation and the expectation to
decrease corporate decline rates to 10-12% and increase RLI to 12-16 years; the expectation to have 100% of the core area under waterflood by year-end 2024; the expected details of Headwater's 2022 core area
capital expenditure program; the expectation to have 50% of the core area under waterflood by Q1 2023; the expectation to have drilled 39 injectors by year end 2022 with a total of 21 wells taking water by July 1,
2022; the expected details of waterflood expansions in 2022; Headwater's exploration strategy including the expectation to execute on the exploration/exploitation strategy including the expectation that
Headwater will allocate 5%-10% of its AFFO to exploration drilling; the expectation to follow-up successful tests with scaled development and the expectation to continue to test existing and newly acquired
exploration lands, the expectation to implement secondary recovery where returns justify capital and the expectation to be self-funding within 2 years resulting in increased free cash flow; the expectation of
adding additional prospective lands through lands sales; the expectation of future M&A activity; the expectation that if consolidation is not possible, significant capital will be returned to shareholders; the
expectation that exploration success has validated significant additional inventory and EOR potential; the expectation to maintain zero leverage with an expected reinvestment rate of 55% in 2022 that falls toADVISORIES
Five-Year Base Strategy Advisory
Advisory Relating to Five-Year Base Strategy (Slide 2)
The Company has presented herein a five-year base strategy that provides for developing the Company's core area to a sustainable production base of 14,500 BOE/d. The five-year base strategy is based on a
number of assumptions as presented in such slides including, without limitation: the required reinvestment rates in 2022 and beyond required to maintain production from the Company's core area; expected
results from wells drilled in the core area; expected percentage of lands under waterflood and expected recovery factors resulting from waterfloods and other enhanced oil recovery options; average
production per year resulting from such strategy; expected adjusted funds flow from operations; capital expenditures per year; expectations as to commodity prices, royalty rates, general and administrative
expenses and certain other assumptions. Waterflood results in the five-year base strategy are based on management's analysis and interpretation of the results from analogous waterflood projects and pilots in
the greater Clearwater area including management's analysis of how such results may apply to the Company's assets. See “Type Curve information and Well Economics” under oil and gas advisories. Refer to
Slide 1 for the fully diluted proceeds on dilutive instruments and number of fully diluted shares outstanding. For the purposes of determining the adjusted funds from operations and distributable cash per fully
diluted share available based on the five-year strategy presented the following pricing assumptions have been utilized:
2022E 2023E 2024E 2025E 2026E
WTI US$/bbl $ 88.00 $ 80.00 $ 75.00 $ 75.00 $ 75.00
WCS Differential US$/bbl $ (12.00) $ (13.00) $ (12.50) $ (12.50) $ (12.50)
AECO Cdn$/mmbtu $ 4.60 $ 3.70 $ 3.20 $ 3.40 $ 3.50
AGT (1) US$/mmbtu $ 14.20 $ 14.00 $ 8.80 $ 8.00 $ 7.70
FX US$/Cdn$ 0.79 0.79 0.79 0.79 0.79
(1) The AGT price is the volume weighted average price for the winter producing months in the McCully field which include January – April and November – December of the applicable year.
Such five-year base strategy is not based on a budget or capital expenditures plan approved by the Board of Directors of the Company beyond 2022 and is not intended to present a forecast of future
performance or a financial outlook. In addition, such five-year base strategy does not represent management's expectations of the Company's future performance but rather is intended to present readers
insight into management's view of the opportunities associated with the Company's assets as used by management for planning and strategy purposes based on the commodity pricing and other assumptions
used for such strategy. In addition, the five-year base strategy does not represent an estimate of reserves or resources or the future net present value of reserves or resources.
There is no certainty that the Company will proceed with all of the drilling of wells, enhanced oil recovery plans or other capital expenditures contemplated by the five-year base strategy and even if the
Company does proceed with such plans there is no certainty that the reserves or resources recovered will match the expectations used for such five-year base strategy. All future drilling, enhanced oil recovery
plan and other capital expenditures will ultimately depend upon the availability of capital, regulatory approvals, seasonal restrictions, oil and natural gas prices, costs, actual drilling results, additional reservoir
information that is obtained and other factors.
There is no certainty that cash will be available for distribution to shareholders even if all assumptions are met as management and the Board of Directors of the Company have not made any decision to pay
dividends or otherwise distribute cash to shareholders. Management and the Board of Directors of the Company may determine to utilize cash for other purposes if determined in the best interests of the
Company to do so.
The assumptions used for the five-year strategy presented herein and the five-year strategy are subject to a number of risks including the risks set out under the forward-looking advisory on the previous slide,
the risk factors identified above and the risk factors set out in the Company's annual information form for the year ended December 31, 2021, which is available on SEDAR at www.sedar.com.
23ADVISORIES
Non-GAAP Advisory
NON-GAAP MEASURES AND RATIOS
This investor presentation contains the terms “adjusted funds flow from operations (“AFFO”)”, “adjusted working
capital”, “capital expenditures or capital program”, “free cash flow”, “recycle ratio”, "reinvestment rate”, “payout”
and “distributable cash per fully diluted share” which do not have standardized meanings prescribed by
International Financial Reporting Standards (“IFRS” or, alternatively, “GAAP”) and therefore may not be comparable
with the calculation of similar measures by other companies. The non-GAAP measures used in this presentation,
defined terms outlined below, are used by Headwater as key measures of financial performance and are not
intended to represent operating profits nor should they be viewed as an alternative to cash provided by operating
activities or other measures of financial performance calculated in accordance with IFRS. Free cash flow
Capital Management Measures Management uses free cash flow for its own performance measure and to provide shareholders and potential
investors with a measurement of the Company’s efficiency and its ability to generate the cash necessary to
Adjusted funds flow from operations (“AFFO”) fund its future growth expenditures. Free cash flow is defined as adjusted funds flow from operations less
capital expenditures. The most directly comparable GAAP measure for free cash flow is cash flows provided
Management considers adjusted funds flow from operations to be a key measure to assess the Company’s by operating activities.
management of capital. In addition to being a capital management measure, adjusted funds flow from operations is
used by management to assess the performance of the Company’s oil and gas properties. Adjusted funds flow from Non-GAAP Ratios
operations is an indicator of operating performance as it varies in response to production levels and management of
production and transportation costs. Management believes that by eliminating changes in non-cash working capital Recycle Ratio
Recycle ratio is used as a measure of profitability. Recycle ratio is calculated as the Company’s operating
and transaction costs, adjusted funds flow from operations is a useful measure of operating performance.
netback including financial derivatives divided by F&D costs per boe. 2021 operating netback including
Management removes transaction costs as these costs relate to acquisitions/dispositions and not the operations of
financial derivatives is $45.11/boe. Recycle ratio on a proved basis is calculated as $45.11/boe divided by
the underlying properties.
$20.43/boe = 2.2. Recycle ratio on a proved plus probable basis is calculated as $45.11/boe divided by
$13.92/boe = 3.2.
F&D costs is used as a measure of capital efficiency. The F&D cost calculation includes all capital expenditure
(exploration and development) for that period plus the change in future development capital ("FDC") for that
period based on the evaluations completed by GLJ as at December 31, 2020, as compared to December 31,
2021. This total capital including the change in the FDC is then divided by the change in reserves for that
period incorporating all revisions and production for that same period. Total proved F&D is calculated as
follows = ($140.4 million (2021 capital expenditures) + $40.7 million (change in FDC associated with proved
reserves)) / (15,663 mboe – 9,495 mboe +2,699 mboe) = $20.43 per boe. Total proved plus probable F&D is
Adjusted working capital calculated as follows = ($140.4 million (2021 capital expenditures) + $46.3 million (change in FDC associated
with proved plus probable reserves)) / (23,790 mboe – 13,080 mboe +2,699 mboe) = $13.92 per boe.
Adjusted working capital is a capital management measure which management uses to assess the Company’s
liquidity. Operating netback is defined as sales less royalties, transportation and blending costs and production
expense divided by sales volumes in the period. The sales price, transportation and blending costs, and sales
volumes exclude the impact of purchased condensate. Operating netback, including financial derivatives is
defined as operating netback plus realized gains on financial derivatives.
Reinvestment Rate
Management believes the reinvestment rate is a useful measure to analyze the ratio of funds generated by
the Company and used for reinvestment and is calculated as total capital expenditures divided by AFFO.
Distributable cash per fully diluted share
Non-GAAP Measures Distributable cash per share is a useful measure of potential shareholder return and is calculated as adjusted
working capital plus proceeds from all outstanding dilutive instruments divided by fully diluted shares
Capital expenditures or capital program outstanding.
Management utilizes capital expenditures to measure total cash capital expenditures incurred in the period. Capital Payout (Specified Financial Measure)
expenditures represents capital expenditures – exploration and evaluation and capital expenditures – property,
plant and equipment in the statement of cash flows in the Company’s audited annual financial statements. Payout is calculated as the time at which a well or project’s cumulative operating netback equals total capital
expenditures. Headwater uses this ratio to determine the amount of cash flows from operating activities
used to reinvest into capital expenditures. 24ADVISORIES
Certain Oil and Gas Advisories
ESTIMATED ULTIMATE RECOVERY (EUR)
This investor presentation contains a metric commonly used in the oil and natural gas industry, "estimated ultimate recovery" or "EUR". The term EUR is the estimated quantity petroleum that is potentially
recoverable or has already been recovered from a well based on the expected production type curves for certain wells. EUR does not have a standardized meaning and may not be comparable to similar
measures presented by other companies. As such, it should not be used to make comparisons. Headwater management uses EUR as a measure of performance and to provide shareholders with measures to
compare the Marten Hills assets over time; however, EUR is not intended to represent an estimate of reserves and is not a reliable indicator of the Marten Hills assets' future performance. Future performance
may not compare to the EUR or other well economics presented herein.
TYPE CURVE INFORMATION AND WELL ECONOMICS
Headwater has presented certain type curve information and well economics for certain development, exploration and waterflood wells in the Clearwater area. The type curve information and well economics
presented are based on historical production in respect of Headwater’s Clearwater assets as well as production history from analogous Clearwater developments located in close proximity to Headwater’s
Clearwater assets. Such type curve information is useful in understanding Headwater management's assumptions of well performance in making investment decisions in relation to development and
exploration drilling in the Marten Hills area and for determining the success of the performance of development and exploration wells; however, such type curve information and well economics are not
necessarily determinative of the production rates and performance of existing and future wells. In addition, the type curves and well economics presented do not reflect the type curves used by GLJ (as defined
below) in estimating the reserves volumes attributed to the Marten Hills assets.
EXPLORATION LANDS
This presentation discloses Headwater's exploration lands in three categories: (i) low risk sections; (ii) medium risk sections; and (iii) identified drilling extension sections. All exploration lands have specifically
been identified by management based on evaluation of applicable geologic, seismic, and engineering, drilling results, analogous information, production and reserves data on prospective acreage and geologic
formations. Low risk sections are sections that have been derisked by drilling existing exploration wells on or in close proximity to such sections of land. Medium risk sections are farther away from existing wells
where management has less information about the characteristics of the reservoir and therefore there is more uncertainty whether such sections will be developed and if developed there is more uncertainty
that such development will result in additional oil and gas reserves, resources or production. Identified drilling extension sections are those sections that have been identified by management as extensions of
existing development blocks where further delineation of the reservoir is required to derisk such sections. The Company has also disclosed the illustrative exploration upside associated with low risk and
medium risk exploration sections. Such upside is not intended to be a forecast of production or an estimate of volumes or value associated with any reserves of such exploration sections. No reserves were
attributed to any of the low risk sections, medium risk sections and identified drilling extension sections in the evaluation by GLJ of Headwater's reserves in its report dated effective December 31, 2021. The
illustrative exploration upside is intended to provide readers with insight into management's view of the potential impact of developing exploration sections if such development is ultimately successful, which
helps inform management when presenting capital expenditure budgets to the Board of Directors for approval. There is no certainty that the Company will develop all or any exploration sections identified as
low risk sections, medium risk sections and identified drilling extension sections and if developed there is no certainty that such development will result in additional oil and gas reserves, resources or
production. The sections on which Headwater actually drills wells will ultimately depend upon the availability of capital, regulatory approvals, seasonal restrictions, oil and natural gas prices, costs, actual drilling
results and other factors.
RESERVES INFORMATION
Headwater currently has reserves in the Marten Hills area of Alberta and the McCully Field near Sussex, New Brunswick. The reserves information contained in this presentation in respect of Headwater assets is
based on an evaluation by GLJ Ltd. ("GLJ") of Headwater's reserves in its report dated effective December 31, 2021, which was prepared in accordance with standards of the Canadian Oil and Gas Evaluation
Handbook ("COGE Handbook") and NI 51-101 and is based on the average forecast prices as at January 1, 2022, of three independent reserves evaluation firms. Additional information regarding reserves data
and other oil and gas information is included in Headwater's Annual Information Form for the year ended December 31, 2021, which may be accessed through the SEDAR website (www.sedar.com).
Reserves are estimated remaining quantities of petroleum anticipated to be recoverable from known accumulations, as of a given date, based on the analysis of drilling, geological, geophysical, and engineering
data; the use of established technology; and specified economic conditions, which are generally accepted as being reasonable. Reserves are further classified according to the level of certainty associated with
the estimates and may be sub-classified based on development and production status. Proved Reserves are those quantities of petroleum, which, by analysis of geoscience and engineering data, can be
estimated with reasonable certainty to be economically producible from a given date forward, from known reservoirs and under existing economic conditions, operating methods and government regulations.
Proved Developed Producing Reserves (or PDP Reserves) are a subset of Proved Reserves and are Proved Reserves which are producing at the time of the reserves evaluation. Probable Reserves are those
additional quantities of petroleum that are less certain to be recovered than Proved Reserves, but which, together with Proved Reserves, are as likely as not to be recovered.
25ADVISORIES
Certain Oil and Gas Advisories
BARRELS OF OIL EQUIVALENT
The term "boe" or barrels of oil equivalent may be misleading, particularly if used in isolation. A boe conversion ratio of six thousand cubic feet of natural gas to one barrel of oil equivalent (6 Mcf: 1 bbl) is
based on an energy equivalency conversion method primarily applicable at the burner tip and does not represent a value equivalency at the wellhead. Additionally, given that the value ratio based on the
current price of crude oil, as compared to natural gas, is significantly different from the energy equivalency of 6:1; utilizing a conversion ratio of 6:1 may be misleading as an indication of value.
OIL AND GAS METRICS
In presenting type curves, inputs and economics information and in this presentation generally, Headwater has used a number of oil and gas metrics which do not have standardized meanings and
therefore may be calculated differently from the metrics presented by other oil and gas companies. Such metrics include "P+P producing RLI“, “NPV 10” and “corporate declines”. P+P producing RLI is
calculated by dividing the P+P producing reserves by the average annual production for that period. NPV 10 is the anticipated net present value of the future operating cash flow after capital expenditures,
discounted at a rate of 10% (before tax). Corporate decline is calculated by the year over year reduction in the corporate production if the Company is not drilling any additional wells. Such metrics have
been included herein to provide readers with additional measures to evaluate the performance of the Marten Hills assets or McCully assets, as applicable; however, such measures are not a reliable
indicator of the future performance of Headwater’s assets or value of its common shares.
INITIAL PRODUCTION RATES
References in this presentation to initial production rates, other short-term production rates or initial performance measures relating to new wells are useful in confirming the presence of hydrocarbons;
however, such rates are not determinative of the rates at which such wells will commence production and decline thereafter and are not indicative of long-term performance or of ultimate recovery.
Additionally, such rates may also include recovered "load oil" fluids used in well completion stimulation. While encouraging, readers are cautioned not to place reliance on such rates in calculating the
aggregate production for the Company. Accordingly, the Company cautions that the test results should be considered to be preliminary.
ANALOGOUS INFORMATION
Certain information in this investor presentation may constitute “analogous information” as defined in National Instrument 51-101 – Standards of Disclosure for Oil and Gas Activities ("NI 51-101"),
including, but not limited to, information relating to the areas in geographical proximity to the Marten Hills assets and production information related to wells that are believed to be on trend with the
Marten Hills assets. Headwater Management believes the information is relevant as it helps to define the characteristics of the Marten Hills assets. Headwater is unable to confirm that the analogous
information was prepared by a qualified reserves evaluator or auditor. Such information is not an estimate of the reserves or resources attributable to lands held or to be held by Headwater and there is no
certainty that the data and economics information for the Marten Hills assets will be similar to the information presented herein. The reader is cautioned that the data relied upon by Headwater may not
be analogous to the Marten Hills assets.
OOIP
Original Oil-In-Place ("OOIP") is equivalent to Total Petroleum Initially-In-Place ("TPIIP") and has been estimated as at March 9, 2022. TPIIP, as defined in the Canadian Oil and Gas Evaluations Handbook, is
that quantity of petroleum that is estimated to exist in naturally occurring accumulations. It includes that quantity of petroleum that is estimated, as of a given date, to be contained in known
accumulations, prior to production, plus those estimated quantities in accumulations yet to be discovered. A portion of the TPIIP is considered undiscovered and there is no certainty that any portion of
such undiscovered resources will be discovered. If discovered, there is no certainty that it will be commercially viable to produce any portion of such undiscovered resources. With respect to the portion of
the TPIIP that is considered discovered resources, there is no certainty that it will be commercially viable to produce any portion of such discovered resources. A significant portion of the estimated volumes
of TPIIP will never be recovered. The OOIP contained in this presentation has been internally estimated by Headwater management.
26You can also read