A 20-year retrospective review of global aquaculture
←
→
Page content transcription
If your browser does not render page correctly, please read the page content below
Review

A 20-year retrospective review of global
aquaculture

https://doi.org/10.1038/s41586-021-03308-6                        Rosamond L. Naylor1,2 ✉, Ronald W. Hardy3, Alejandro H. Buschmann4, Simon R. Bush5,
                                                                  Ling Cao6, Dane H. Klinger7,8, David C. Little9, Jane Lubchenco10, Sandra E. Shumway11 &
Received: 21 August 2020
                                                                  Max Troell12,13
Accepted: 29 January 2021

Published online: 24 March 2021
                                                                  The sustainability of aquaculture has been debated intensely since 2000, when a
    Check for updates                                             review on the net contribution of aquaculture to world fish supplies was published in
                                                                  Nature. This paper reviews the developments in global aquaculture from 1997 to 2017,
                                                                  incorporating all industry sub-sectors and highlighting the integration of aquaculture
                                                                  in the global food system. Inland aquaculture—especially in Asia—has contributed the
                                                                  most to global production volumes and food security. Major gains have also occurred
                                                                  in aquaculture feed efficiency and fish nutrition, lowering the fish-in–fish-out ratio for
                                                                  all fed species, although the dependence on marine ingredients persists and reliance
                                                                  on terrestrial ingredients has increased. The culture of both molluscs and seaweed is
                                                                  increasingly recognized for its ecosystem services; however, the quantification, valuation,
                                                                  and market development of these services remain rare. The potential for molluscs and
                                                                  seaweed to support global nutritional security is underexploited. Management of
                                                                  pathogens, parasites, and pests remains a sustainability challenge industry-wide, and
                                                                  the effects of climate change on aquaculture remain uncertain and difficult to validate.
                                                                  Pressure on the aquaculture industry to embrace comprehensive sustainability
                                                                  measures during this 20-year period have improved the governance, technology,
                                                                  siting, and management in many cases.

Twenty years ago, Nature published a review characterizing aquaculture                             potential to provide a wide range of food, industrial, and ecosystem
as a possible solution, and a contributing factor, to the decline in fisher-                       services.
ies stocks worldwide1. At the time, the commercial aquaculture sector                                 These trends reveal increasingly tight connections between land
was flourishing, whereas the production of capture fisheries remained                              and sea. Continuing a long history of inland production, the share of
stagnant. The farmed (live-weight) production of fish and shellfish had                            freshwater fish raised on compound feed, which is made largely from
almost tripled from 10 million tonnes (Mt) in 1987 to 29 Mt in 1997, and                           terrestrial and some marine ingredients, has increased over the past
roughly 300 species of animals, plants, and algae were being cultivated                            two decades3. Meanwhile, the inclusion of plant-based ingredients
worldwide2. The paper placed greater emphasis on fed marine species                                in aquafeed has increased, and the production of extractive species
than on freshwater and molluscan species and cautioned that the net                                (molluscs and seaweed) that filter nutrients from terrestrial and marine
positive contribution of aquaculture to world fish supplies could not                              food systems has grown. Aquaculture has thus become more integrated
be sustained unless the sector reduced its use of wild fish in feed as well                        into the global food system, with rapid growth in production and major
as its environmental impacts.                                                                      transformations in feed ingredients, production technologies, farm
   This Review covers global trends in aquaculture over the past                                   management, and value chains. Through aquaculture growth, consum-
20 years, citing a selection of the most relevant papers (additional                               ers from low- to high-income nations have benefited from year-round
reviewed articles are listed in the Supplementary Information). In 2017,                           availability and access to aquatic foods, which are rich in protein and
aquaculture supplied more than 80 Mt of fish and shellfish and 32 Mt                               micronutrients4–7. The sector produces far more than fish, shellfish, and
of seaweeds, encompassing around 425 farmed species2. Three main                                   algae for direct human consumption. It also generates products used
patterns of aquaculture development have characterized the sector as                               in food processing, feed, fuels, cosmetics, nutraceuticals, pharmaceu-
it matured: continued growth in the volume and value chains of fresh-                              ticals, and a variety of other industrial products, and it contributes to
water aquaculture; advances in fish nutrition, genetics, and alternative                           a range of ecosystem services8.
types of feed that reduce the use of wild fish in aquafeed formulations;                              Despite impressive gains, the aquaculture sector still faces
and expanded culture of extractive bivalves and seaweeds with the                                  serious challenges that, in some cases, undermine its ability to achieve

1
 Department of Earth System Science, Stanford University, Stanford, CA, USA. 2Center on Food Security and the Environment, Stanford University, Stanford, CA, USA. 3Aquaculture Research
Institute, University of Idaho, Moscow, ID, USA. 4Centro i-mar & CeBiB, Universidad de Los Lagos, Puerto Montt, Chile. 5Environmental Policy Group, Wageningen University, Wageningen, The
Netherlands. 6School of Oceanography, Shanghai Jiao Tong University, Shanghai, China. 7Center for Oceans, Conservation International, Arlington, VA, USA. 8Department of Nutrition, Harvard
T. H. Chan School of Public Health, Boston, MA, USA. 9Institute of Aquaculture, University of Stirling, Stirling, UK. 10Department of Integrative Biology, Oregon State University, Corvallis, OR,
USA. 11Department of Marine Sciences, University of Connecticut, Groton, CT, USA. 12Beijer Institute, Royal Swedish Academy of Sciences, Stockholm, Sweden. 13Stockholm Resilience Centre,
Stockholm University, Stockholm, Sweden. ✉e-mail: roz@stanford.edu

                                                                                                                                             Nature | Vol 591 | 25 March 2021 | 551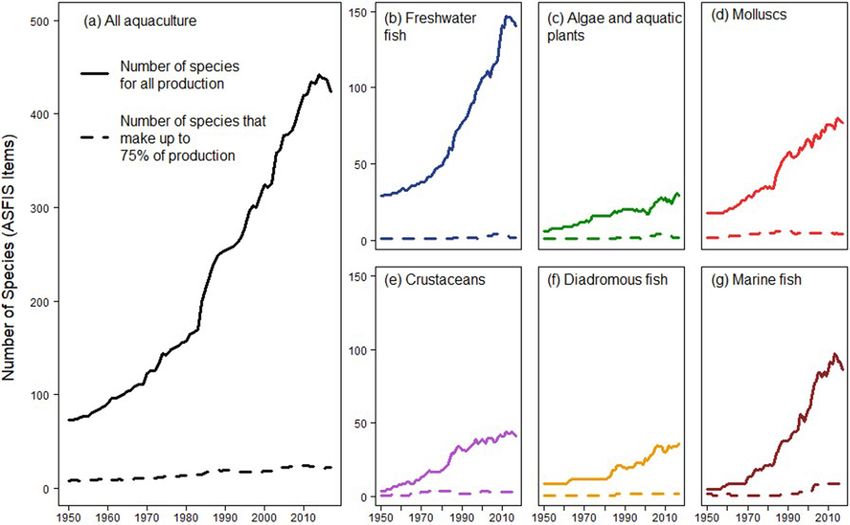
Review
a 112 Mt b
Japanese
kelp (10%) 120
Total
Eucheuma
100 Freshwater fish
seaweeds NEI (8%)
Algae
Grass carp (5%) Molluscs
Production (Mt)
80
CDMM
Cupped oysters
NEI (4%)
Silver carp (4%)
60
Japanese
kelp (15%) Whiteleg
shrimp (4%) 40
Silver carp (9%)
Gracilaria
Grass carp (7%)
seaweeds (4%)
Cupped oysters 20
NEI (6%) Japanese
carpet shell (4%)
Common carp (6%)
Nile tilapia (4%)
Bighead carp (4%) 0
Common carp (4%)
Freshwater 1997 2000 2003 2006 2009 2012 2015
fishes NEI (4%) Bighead carp (3%)
Japanese
c
Carassius spp. (3%) 10
carpet shell (3%)
Catla (2%) CDMM
Marine molluscs
NEI (3%) Freshwater Crustaceans
Scallops NEI (3%) fishes NEI (2%) 8 Diadromous fish
Carassius spp. (2%)
36 Mt Atlantic
Marine fish
Production (Mt)
salmon (2%)
Nile tilapia (2%)
Wakame (2%) 6 Miscellaneous
Roho labeo (2%)
Atlantic Scallops NEI (2%)
salmon (2%) Roho labeo (2%)
Pacific cupped 4
Pangas
oyster (2%) catfishes NEI (2%)
Elkhorn
Nori NEI (2%)
sea moss (2%) 2
Catla (2%) Milkfish (2%)
Sea mussels Elkhorn
NEI (2%) sea moss (1%) 0
All others (26%) All others (26%) 1997 2000 2003 2006 2009 2012 2015
1997 2017 Date (year)
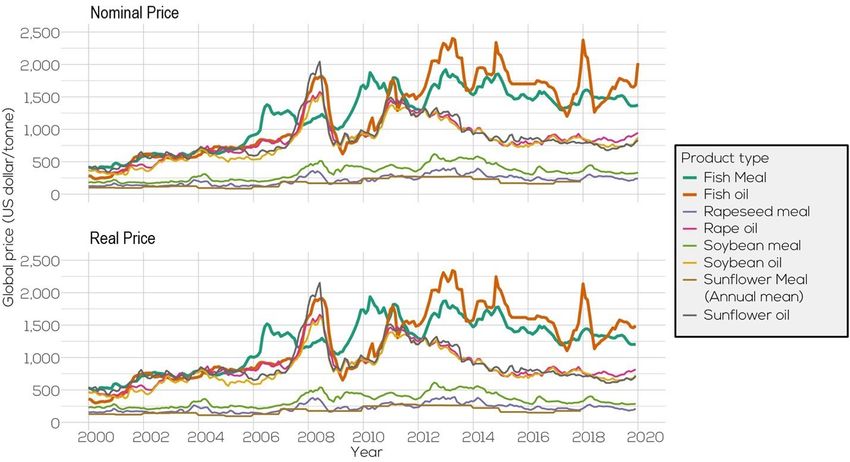
Fig. 1 | Composition and growth of global live-weight aquaculture expanded in c. Algae comprised more than 99% of the production weight of
production. a, The species composition is shown for 1997 and 2017. Green, ‘algae and aquatic plants’ production in 2017. Data were obtained from the
plants and algae; blue, freshwater fish; pink, shellfish; orange, diadromous fish. FAO2. National data are reported on the basis of the ASFIS List of Species
b, c, Growth is shown from 1997 to 2017 for the following production categories (http://www.fao.org/fishery/collection/asfis/en). NEI, not elsewhere included
(b): total, freshwater fish, algae, molluscs and CDMM, which comprises for species identification in question.
crustaceans, diadromous fish, marine fish, and miscellaneous species and is
sustainable outcomes. The sector has generally embraced a business feed in the production of high trophic marine and diadromous species,
and societal expectation of environmentally and socially sound prac- the dominant role of freshwater systems was only lightly covered1.
tices. Globally traded finfish and crustacean systems are progressively The role of freshwater systems has gained attention in part because
improving their environmental performances, either independently advances in feed technology and breeding, particularly for salmon
or in response to government regulation, private and public sector and shrimp, are addressing earlier concerns regarding the effects of
standards, and market incentives. Many aquaculture systems, however, aquaculture on wild-capture fisheries.
still lack the motivation to meet sustainability criteria because their Aquaculture is more diverse today, with 40% more fish, shellfish,
targeted markets do not reward producers through improved prices or aquatic plant, and algal species cultivated in a wide variety of marine,
access. At the same time, molluscs, filter-feeding finfish, and seaweeds brackish, and freshwater systems globally10. Global production remains
have sustainable characteristics, particularly because they do not rely concentrated, however, with only 22 of all 425 species groups farmed
on aquafeed, but instead remove nutrients from the water column. In in 2017 (5%) accounting for over 75% of global live-weight production2
summary, as the global industry continues to expand, its contribution (Extended Data Fig. 1). A small fraction of the ‘aquatic plant and algae’
to economic social and environmental performance varies across a category (~32 Mt) consisted of aquatic plants (1,639 tonnes) in 20172.
wide diversity of aquaculture systems. Aquatic plants are listed by the Food and Agriculture Organization
(FAO) under ‘aquatic plants NEI’ and are underreported given the
informal nature of the harvests for household and local consumption.
Global expansion Asia remains the largest aquaculture producer, accounting for 92% of
Global aquaculture production more than tripled in live-weight volume the live-weight volume of animals and seaweeds in 20172. Aquaculture
from 34 Mt in 1997 to 112 Mt in 2017 (Fig. 1). The main species groups that in Asia is also more diverse than other regions in terms of production
contributed to the top 75% of aquaculture production in 2017 included systems and cultivated species11. Nine of the top-ten ranked coun-
seaweeds, carps, bivalves, tilapia, and catfish. Although the production tries for aquaculture species diversity are in Asia, with China leading
of marine and diadromous fish species and crustaceans has also grown by a wide margin. As an example, China cultivated 86 different species
rapidly during this period, it has been dwarfed by the live-weight volume of aquatic organisms in a variety of production systems in 2017, whereas
of marine bivalves and seaweeds, and by the production of freshwater Norway cultivated 13 different species, mainly in marine cage systems10.
aquaculture. Freshwater fish account for 75% of global edible aquacul- China has an oversized role in nearly all areas of aquaculture produc-
ture volume, reflecting their favourable conversion from live to edible tion. Since 2000, the country has maintained its role as the largest
weight in comparison to molluscs and crustaceans, which have high global producer, processor, and trader of fish, crustaceans, and mol-
shell weights9. Because the previous review focused on marine-sourced luscs, and has emerged as a leading consumer owing to the rapid growth
552 | Nature | Vol 591 | 25 March 2021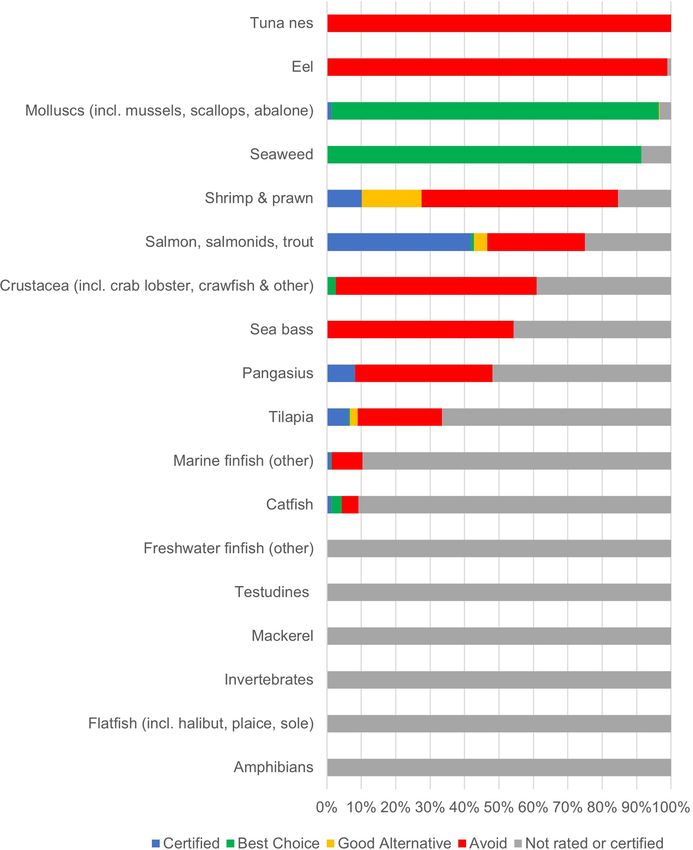
in income and domestic seafood demand12–14. China alone supplied 58%       in 2017 (Extended Data Table 1). The expansion of freshwater aqua-
and 59% of the global aquaculture volume and value, respectively, for      culture in Asia (93% of global production) has been driven mainly by
all categories combined in 2017 (Extended Data Table 1).                   urban demand and the decline in wild inland fisheries that previously
   The role of China notwithstanding, the aquaculture sector has           supported rural livelihoods and food security30.
become increasingly global, with growth rates in South America                Diverse value chains underpinning freshwater aquaculture in Asia
and Africa exceeding Asia during the past two decades (albeit from a       have emerged with limited governmental support, spurred by economic
much smaller production base), and with relatively rapid expansion         development, rural transformation, and urbanization. These processes
in South and Southeast Asia compared to East Asia3,15,16. The largest      have boosted purchasing power and fuelled the demand for freshwater
aquaculture producers outside Asia—each accounting for 1–2% of the         fish, paving the way for the expansion of private sector investment27,31.
global production—include Norway and Chile, which mainly produce           The development of aquaculture in small- to medium-scale commercial
Atlantic salmon (Salmo salar), and Egypt, which produces Nile tilapia      enterprises in South and Southeast Asia has helped to alleviate rural
(Oreochromis niloticus)17. Aquaculture in the Western Hemisphere has       poverty, through direct benefits to consumers and other value chain
largely developed around single- or dual-species and single-production     participants21,32 and broader ‘spillover’ benefits to labour and liveli-
systems (for example, Atlantic salmon in cages, Nile tilapia and chan-     hoods in adjacent industries33. A similar process of the development
nel catfish (Ictalurus punctatus) in ponds). These systems and spe-        of freshwater aquaculture is now occurring in parts of sub-Saharan
cies have benefitted from targeted genetic and nutritional advances,       Africa15, albeit shaped by different social and economic constraints to
but remain vulnerable to shocks related to market volatility, extreme      production, structures of the value chains, and consumer demand16,34,35.
climate events, and pandemics such as COVID-1910,17,18.                       Given the heterogeneity of freshwater aquaculture systems, much
   The growth of aquaculture has been fuelled by the expansion in global   of the recent literature focuses on system diversity, nutrition security,
trade, declines in the availability of wild fish, competitive product      and value chains, particularly within the Asian context. Generalizations
pricing, rising incomes, and urbanization—all of which contribute to       regarding freshwater production practices, resource depletion, and
rising per capita consumption of seafood worldwide11,19. Global fish       environmental constraints are limited, but three lessons emerge.
trade remains limited, however, to a relatively small number of spe-          First, over-intensification, particularly in cage aquaculture, has cre-
cies and countries: salmon, shrimp, catfish, and tilapia collectively      ated problems of nutrient pollution and pathogen-related production
represent approximately one-third of internationally traded seafood        declines in areas with unconstrained growth, such as Lake Taal, The
by value, but only 8% of global seafood production17. The process of       Philippines36. Cage culture in deep lakes and reservoirs can be subject
globalization itself has been dynamic, with incomes and markets in the     to turnover and related mortality due to sudden anoxic conditions37.
global South expanding more rapidly than the global North in recent        In regions in which freshwater resource depletion, nutrient pollution,
decades20. The growing importance of domestic markets, particularly        disease problems, and other constraints on the use of public waters
in Asia, means that over 89% of aquaculture output does not enter into     have emerged, industry consolidation has often followed, forcing
international markets21.                                                   poor producers out of the sector29,38,39. In China, aquaculture pollu-
                                                                           tion accounts for more than 20% of the total input of nutrient into
                                                                           freshwater environments in some provinces40, leading to prohibition
Freshwater aquaculture                                                     in many public water bodies that are essential for drinking water and
Freshwater aquaculture has been underrepresented in the proliferat-        other important ecosystem services41. In other regions, in-pond race-
ing literature on global environment and food system interactions          way systems have been promoted to enhance feed-use efficiency and
since 2000 despite its dominant contribution to aquatic food supplies      solid-waste removal (for example, channel catfish, carps and tilapia),
and nutrition security21,22. Of the 11,625 articles published in English   but widespread adoption has been constrained by high capital costs42.
between 2000 and 2020 with marine or freshwater aquaculture (or               Second, and related to production intensification, compound feed use
farming) in their titles (indexed in Web of Knowledge (https://apps.       in freshwater systems has steadily increased, driven by local and interna-
webofknowledge.com/)), three-quarters focused on mariculture and           tional companies and certification initiatives operating across a range of
68% on high-valued mariculture. These metrics do not include the vast      production systems and countries3,43. An estimated 92% of tilapia, 81% of
literature published in Asia, particularly in China, where freshwater      catfish and 57% of Chinese carps rely on some combination of commer-
aquaculture has a long and vibrant tradition23.                            cially formulated pelleted feed and feed types made at the farm to supple-
   Freshwater aquaculture consists of a wide diversity of systems          ment the naturally occurring nutrients produced in the culture systems3.
across physical and economic scales, infrastructure configurations,        Fertilization, combined with supplementary feeds, remains a key approach
species, ownership, and value chains. It consists predominantly of         to producing low-cost tilapia, catfish, and carp in semi-intensive systems,
household-managed ponds and small- to medium-scale commercial              and has underpinned the growth of commercial production in Asia.
enterprises that produce a variety of carps and other fish in polycul-        Third, the steady emergence and proliferation of relatively low
ture systems for local and regional consumption24. Freshwater aqua-        input–output culture-based fisheries through different forms of col-
culture is widely recognized for the production of tilapia and striped     lective management has permitted access to, and control of, aquatic
catfish (Pangasianodon hypophthalmus) that are produced mainly in          commons (for example, floodplains, reservoirs, and seasonal water
earthen ponds for export and national consumption. It also includes        bodies)44. Field studies show that productivity gains from non-fed,
the cultivation of freshwater and brackish-water crustaceans, produced     often exotic carp have generally been achieved in low-input systems
intensively in monoculture (for example, whiteleg shrimp (Litopenaeus      while maintaining or enhancing nutrient balances and the biodiversity
vannamei)) or in polyculture systems (for example, black tiger shrimp      of indigenous species45.
(Penaeus monodon)) with a wide variety of other fish, molluscs, and           These three trends result in a sector tightly integrated into terrestrial
aquatic plants. Urbanization has increasingly shifted the demand from      food systems via feed, nutrient cycling, and value chains. Scientific
subsistence to marketed fish25.                                            knowledge surrounding freshwater aquaculture and local resource
   A key characteristic of freshwater aquaculture growth during the        use is extensive, especially in an Asian context. In comparison to
past 20 years has been the proliferation of value chains in and across     ocean-based production, however, the global environmental impacts of
countries located in South and Southeast Asia, for example, in Andra       freshwater aquaculture remain understudied. Specifically, the trend to
Pradesh, India26, Bangladesh24, Myanmar27, Thailand,28 and Vietnam29.      intensify freshwater systems is increasingly linked to globally sourced
China remains the single largest producer of freshwater fish—for export    feed ingredients that represent a critical area of the overall environ-
and domestic consumption—accounting for 56% of the global output           mental impact of the aquaculture sector46.

                                                                                                           Nature | Vol 591 | 25 March 2021 | 553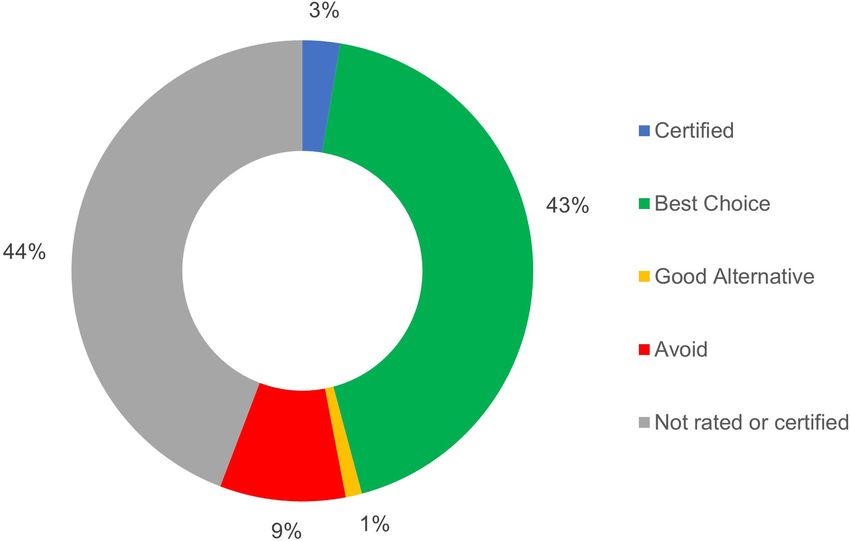
Review
                                                                              in Vietnam) now comprise roughly one-third of global fishmeal produc-
Fish feed and wild fisheries                                                  tion and one-half of fishmeal production in Europe3,8,47. Greater use
A major focus of the previous aquaculture review1 was the increasing          of trimmings in fishmeal has been documented, in particular, in feed
proportion of annual fishmeal and fish oil production for aquaculture         formulations for salmon production in Norway55 and for shrimp and
feed, and the consequent potential future impacts on wild forage fish         catfish production in Thailand44.
landings and stocks as well as marine ecosystems. In aggregate, global           The combination of improved FCR, reduced fishmeal and fish oil
landings of forage fish have trended downward (Extended Data Fig. 2),         inclusion ratios, and increased use of fishmeal from trimmings have low-
reflecting full to overexploitation, and harvest restrictions (for exam-      ered the ratio of wild fish inputs to farmed fish output (fish-in:fish-out
ple, in Peru) to prevent fishing above maximum sustainable yield levels.      ratio (FIFO)) (Extended Data Tables 2, 3). On a global basis, FIFO was 0.28
   The aquaculture sector has made considerable progress in enhancing         in 2017 for the main aquaculture species groups that are dependent on
the efficiency of use of marine resources over the past 20 years. The         feed (Table 1). FIFO exceeded 1.0 for shrimp, salmon, trout, and eels, but
global production of fed fish tripled between 2000 and 20173 while the        was still far below the FIFO calculated for these species 20 years ago.
annual catch of forage fish used to make fishmeal and fish oil decreased      The previously published review of aquaculture and world fish sup-
from 23 Mt to 16 Mt (refs. 47,48) (Extended Data Fig. 3). Global produc-      plies1 calculated a global FIFO for fed aquaculture species of 1.9 using
tion of fishmeal from capture fisheries and trimmings decreased over          1997 data (FIFO by species group was 2.81 for shrimp, 5.16 for marine
the same period from 6.6 to 4.8 Mt (ref. 17). The production of fish oil      fish, 3.16 for salmon, 2.46 for trout, 4.69 for eels, and below 1.0 for all
declined from around 1.5 to 1.0 Mt and has been stable around 1.0 Mt          freshwater fish). Calculations in Table 1 include the residual availability
during the past decade49–51.                                                  of fishmeal and fish oil from feed across different species groups, which
   Prices for fishmeal and fish oil have more than doubled during the         can be used for global aquaculture feed production—thus addressing
2000s and have remained consistently higher than plant-based alterna-         a point of contention related to earlier FIFO calculations8,47,56.
tives since 2012 (Extended Data Fig. 4). Aquaculture producers have              Despite the positive contribution of trimmings to global fishmeal
responded by reducing the use of fishmeal and fish oil in feed formu-         production, aquaculture production in Asia—notably China, Thailand,
lations, and these efforts have been reinforced by sustainability goals       and Vietnam—still relies on low-value feed-grade fish from non-targeted
throughout the supply chain. Fishmeal and fish oil remain important           fisheries (including quasi-targeted bycatch) as an input for feeds57.
ingredients of fish feed, suppling essential nutrients to support larval      In 2017, Asian aquaculture systems consumed more than 6.6 Mt of
and fry performance and survival, but are now used at lower percent-          low-valued fish as direct or indirect feed inputs17. Roughly one-third
ages in grow-out, broodstock, and finishing feeds. Nonetheless, the           of the Chinese domestic fish catch comprises low-valued fish (89%
share of global fishmeal used by the aquaculture sector (versus live-         juveniles) that are used mainly in aquaculture feeds57. Such feed-grade
stock and non-food uses) increased from 33% in 2000 to 69% in 2016,           focused fisheries can affect wild fish populations and marine ecosys-
while the share of global fish oil used by aquaculture rose from 55% to       tems considerably through the capture of juvenile fish and loss of
75% (refs. 50,52). A continuation of this trend could push fishmeal and       biodiversity12,57.
fish oil prices higher, creating further incentives for innovations in
aquaculture feed.
   Four major developments along the aquaculture supply chain have            Feed from land and sea
helped to reduce the dependence on wild fish resources since 2000:            Although marine resources continue to have an important role in aqua-
rapid growth in omnivorous species production; improved feed conver-          feed, the use of plant-based ingredients has been increasing stead-
sion ratios (FCRs) for all fed species; higher use of alternative protein     ily, creating tighter connections between land and sea. The aquafeed
and oil ingredients in feed; and increased production and use of fish-        industry has become increasingly dependent on conventional animal
meal and fish oil from fish-processing wastes and bycatch. In addition,       feed ingredients from terrestrial systems that are widely traded in inter-
improvements in processing technologies have increased fishmeal               national markets (Fig. 2).
recovery from anchovies and other pelagic species from 22.5% to 24%              Three factors have contributed to the expanding role of terrestrial
over the past few decades53. Fish oil recovery remains around 5% for          food systems in global aquaculture: feed ingredients tailored to fish;
anchovies and about 10% for fatty fish such as herring, capelin, and          feed formulations based on accurate nutritional requirements; and
sand eel, which are used widely in the production of fish oil in Europe.      breeding to enhance fish growth, feed efficiency, and animal health.
   Between 1997 and 2017, the volume and share of freshwater fish pro-        Feed ingredients from grains and oilseeds are the basis of livestock feed-
duced with compound feeds, such as fed carps, tilapia, and catfish,           ing, but carnivorous fish have difficulty digesting starch, non-soluble
increased substantially, but FCR also improved (Extended Data Table 2).       carbohydrates, or fibre in these ingredients. They are also more sensi-
Meanwhile, fishmeal inclusion rates dropped for these species to 1–2%,        tive than livestock to antinutrients and toxins in plant protein ingredi-
and there is almost no fish oil used in most types of freshwater aqua-        ents58. Additional processing steps have been introduced to increase
feed. Compound feed types for marine and brackish water finfish and           the nutritional value of plant and land animal protein concentrates
crustaceans remain higher in fishmeal and fish oil, but their fishmeal        for fish59–61. Alternative oil sources—including rapeseed (canola) oil,
and fish oil inclusion rates decreased by one-half to two-thirds over         palm oil, and poultry fat—are now commonly used substitutes for a
the period. For shrimp, there has been a major global shift in produc-        portion of fish oil62. Although farmed salmon remain a good source of
tion away from black tiger shrimp to the more omnivorous whiteleg             omega-3 fatty acids, replacing fish oil with terrestrial oils lowers the
shrimp. Breeding strategies for salmon and trout and improvements in          omega-3 content in fillets63. The use of high omega-3 oils from algae
feed ingredient quality and formulations have permitted much higher           or genetically modified oilseeds can reduce fish oil use in salmon feed
inclusion of plant protein concentrates in feed54.                            while maintaining the health benefits to consumers, but this remains
   The increasing use of trimmings in fishmeal production, particularly       economically inefficient and, in some markets, the latter is constrained
for lower-valued freshwater species, has also had a critical role in lower-   by weak consumer acceptance59,64.
ing the use of wild fish in feed since 2000 (Table 1). The estimated use of      Replacing fishmeal and fish oil in feed with plant-sourced products
trimmings is three times the use of wild fish in fishmeal for tilapia and     affects the health of piscivorous aquaculture species through altera-
catfish. Even high-valued marine and brackish species, such as salmon         tions of the microbiome, changes in gut morphology, modification
and shrimp, use equal ratios of fishmeal from trimmings and wild fish         of immune function, and interference with normal function of the
in their feed. Trimmings from both wild fisheries (for example, tuna in       endocrine system and maturation65,66. Moving towards full plant-based
Thailand) and aquaculture (for example, salmon in Norway, pangasius           diets for these species thus increases disease risks. New tools, including

554 | Nature | Vol 591 | 25 March 2021
Table 1 | Wild fish used in aquaculture feeds for 11 commonly farmed fed fish and shellfish
Farmed fish and Total Percentage Average Percentage Percentage Percentage Net wild FIFOc in
crustaceansa production produced with FCRb fishmeal in feed fishmeal in feed fish oil in feeds fish used 2017
(kilotons)a compound feed (wild) (trimmings) (wild) (kilotons)
(by weight)a
Fed carps 13,986 57 1.7 0.4 0.6 0 0 0.02
Tilapia 5,881 92 1.7 0.5 1.5 0 0 0.03
Shrimp 5,512 86 1.6 5 5 2 3,034 0.82
Catfishes 5,519 81 1.3 0.5 1.5 0 0 0.02
Marine fish 3,098 80 1.7 8 6 3 2,528 1.25
Salmon 2,577 100 1.3 6 6 6 4,020 1.87
Freshwater crustaceans 2,536 60 1.8 5 7 1 548 0.43
ODF fish 2,491 43 1.7 3 8 2 728 0.38
Milkfish 1,729 55 1.7 2 0 0 0.07
Trout 846 100 1.3 5 4 6 1,320 1.82
Eel 259 100 1.5 25 10 5 389 2.98
Total 44,424 12,566 0.28
a
Categories from Tacon3, Table 4. ODF, other diadromous and freshwater fish. The calculations by the authors are based on data from the following sources: production, share of production and
FCR were obtained from the FAO2 and Tacon3; inclusion of fishmeal and fish oil data were from the National Resource Council report on Nutrient Requirements for Fish and Shrimp54, Naylor et al.59,
and Ytrestøyl et al.55; and analyses of fish trimmings in fishmeal were from Green (SeaFish)47 and Leadbitter44. We use conservative estimates of 24% fishmeal and 10% fish oil recovery from wild fish.
b
FCR is defined as the estimated average species-group economic FCR (total feed fed/total species group biomass increase). Economic FCR (also known as EFCR)3,55,59 is defined as total feed fed/
total species group biomass increase and includes waste, escapes and other non-ingested feeds55.
c
FIFO, wild fish inputs to fed fish output.
See Extended Data Table 3 for more information.
high-throughput technologies (metabolomics and proteomics), RNA with roughly 40% for poultry, 30% for swine, and 25% for ruminants)43.
sequencing, polymerase chain reaction (PCR) and whole-genome Many terrestrial feed ingredients for aquaculture are by-products, such
sequencing, have been used since 2000 to detect and mitigate these as oilseed protein concentrates extracted from the processing of food
problems67. Conventional breeding and marker-assisted selection have products, or protein meals and oils recovered from the processing of
also been used to improve fish growth and health, and lessons from ter- livestock and seafood (including aquaculture)43,59. Recycling processed
restrial animal breeding, especially poultry, have been used to advance by-products and food wastes into high protein feed ingredients contrib-
breeding strategies for fish68,69. For example, genetically selected trout, utes to the sustainable production of food globally, but life-cycle analysis
which show improved weight gain of 10–15% per generation on fully is needed to measure the net environmental impact.
plant-protein feeds70, are able to digest amino acids from plant proteins Nonetheless, terrestrial crop demand for aquafeed is expected to rise
in a similar temporal pattern as fishmeal and do not develop distal in the future as the production of finfishes and crustaceans expands
enteritis in the intestine when fed high-soy diets71.These tools have in freshwater and marine systems43,74. Rising demand will probably
thus far been applied to only a few high-valued aquaculture species. place pressure on natural resources and feed prices. Research on new
The increasing share of plant-based ingredients in mariculture feed feed ingredients has proliferated recently59,74,78–81 and will continue to
types, coupled with the steady growth in feed use in freshwater aquacul- expand. Single-cell proteins, insect meal, and microalgae represent
ture, has led to a new set of controversies surrounding resource use and early stage technologies with potential for replacing fishmeal and fish
the environmental effects of terrestrial crop production for aquafeed. oil in aquaculture feed81.
Life cycle analyses indicate that feed accounts for more than 90% of the
environmental impact from fed aquaculture production72,73. Studies
modelling fishmeal replacement with plant-based proteins (for exam- Extractive species
ple, soy protein concentrate) in shrimp74 and salmon75 show potential Extractive species—molluscs and algae—have doubled in volume since
increases in ecotoxicity from fertilizer and pesticide use, rising pressure 2000 (Fig. 1b) and represent the third area of aquaculture development.
on freshwater and land resources, and heightened carbon emissions Extractive filter-feeding bivalves and algae accounted for 43% of total
and biodiversity loss from forest clearing—particularly in Brazil. (live-weight) aquacultural output in 20172. On an edible-weight basis,
Aquaculture producers seeking to market sustainable products are however, molluscs and algae comprised only 6% and 7.6%, respectively,
therefore faced with the unintended environmental and social conse- of total aquaculture output9. These groups also provide a wide range
quences of their feeding practices. For example, between 2000 and of ecosystem services and non-food products8,82–85.
2016, the Norwegian salmon aquaculture industry cut its shares of
marine protein in feed from 33.5% to 14.5% and marine oils from 31.1% to Molluscs
10.4%, and increased the shares of plant proteins from 22.2% to 40.3% and Molluscan aquaculture includes approximately 65 reported species,
terrestrial oils from 0 to 20.2%76. Despite its success in substituting fish- mainly bivalves (clams, oysters, scallops, and mussels)3. Clams, for
meal and fish oil with plant-based alternatives, including non-genetically example, Japanese littleneck (carpet shell, Venerupis philippinarum),
engineered soy, the industry has been under pressure to identify new and Pacific cupped oysters (Crassostrea gigas), account for two-thirds
feed sources to eliminate the environmental damages associated with of the total. Bivalves do not require feed inputs, making them attrac-
forest conversion to crop production in Brazil77, and parts of the industry tive candidates for the expansion of sustainable seafood—a point that
have already banned the use of Brazilian soy in aquafeed. was made in the previous review1 and has been argued for more than
Although certain segments of the aquaculture industry, such as salmon, 30 years82,84,86–88. Some high-value farmed molluscs, such as abalone
face sustainability challenges with terrestrial feed sourcing, the share of and conchs, are herbivorous and reliant on feed, but they account for
global animal feed used as aquafeed is small—estimated at 4% (compared only 2.4% of cultivated molluscan output3.
Nature | Vol 591 | 25 March 2021 | 555Review
Agriculture Land Key areas for governance
production flow
Co-product Spillovers between and
flow within sectors
Aquatic product • Technology transfer from
Freshwater capture
flow agriculture and livestock
fisheries
Livestock farming to aquaculture
Co-product (12 Mt (10 Mt))
flow Negative externalities
(>1,000 Mt) • Land: Land-use change,
biodiversity loss, GHG
Crops emissions, nutrient and
Farmed freshwater chemical wastes and/or
fish and crustaceans effluent (pollution), and
(48 Mt (40 Mt)) antibiotic and antimicrobial
resistance
25% FO,
(40 Mt) • Oceans: Habitat change,
31% FM
biodiversity loss, GHG
emissions, nutrient and
75% FO, chemical wastes and/or
69% FM Fishmeal effluent (pollution), and
Aquaculture and oil antibiotic and antimicrobial
feeds reduction resistance
Aquatic food Positive externalities
• Oceans: Ecosystem
services (for example,
Non-targeted marine (18 Mt) nutrient uptake and habitat
capture fisheries from mollusc and seaweed
farming)
Farmed fish and Targeted marine
Low income
crustaceans capture fisheries
• Nutrition security
(14 Mt (10 Mt)) (82 Mt (63 Mt))
High income
• Certified or rated Persistent stressors to
seafood for aquatic food systems
sustainability
and health Farmed seaweed Farmed molluscs • Pathogens, parasites
(31 Mt (12 Mt)) (17 Mt (3 Mt)) and pests
All income levels
• Healthy source of • Climate change and ocean
animal protein and acidification
micronutrients • Harmful algal blooms
• Pollution
Marine
Fig. 2 | Interactions between sea and land. Blue arrows show the flows of respectively. Fishmeal (FM) and fish oil (FO) shares used in aquaculture and
aquatic products from freshwater and marine systems, including wild fish used livestock production are also shown. Aquafeeds include a majority of
as fishmeal and fish oil in animal feeds. Green arrows show the flows of ingredients from agriculture, and co-products from processing of terrestrial
terrestrial feed products. Co-products from terrestrial and aquatic processing and aquatic foods are used as ingredients for fish feeds. Data sources: edible
used in feeds are indicated by dotted arrows. Live-weight and edible conversions9 and production data2,49–51,204,205. GHG, greenhouse gas.
production from aquaculture sources are indicated in black and red numbers,
The global production of farmed molluscs grew at an annual rate of for example, agriculture, aquaculture, and sewage discharge. Bivalves
3.5% between 2000 and 2017, which is lower than that of farmed fish (5.7%) filter large volumes of water daily, and their abilities and impacts are
and crustaceans (9.9%)3. In China, however, bivalve culture expanded species- and area-specific82,84,92. Nutrient extraction has two modes:
considerably in response to consumer demand. Between 2005 and 2014, harvest and removal of the bivalves, and increased denitrification near
the volume of scallops increased by 80.4%, clams by 40.8%, oysters by dense populations of wild or farmed bivalves. The ability of bivalves to
30%, and mussels by 19%84. China is the largest consumer and producer mitigate coastal eutrophication fully requires large-scale production
of molluscs, accounting for 84% of global cultivated volume in 2017. and a considerable reduction in nutrients at the source is also needed
In addition to seafood, outputs from molluscan aquaculture are used in most cases93. Efforts have been made to introduce new markets for
in a variety of industrial products, such as fertilizers, construction mate- bivalves that generate offset credits for non-point source pollution,
rials, poultry grit, pharmaceuticals, and nutraceuticals82,84. Bivalves also but these markets have yet to develop at scale84,94,95
provide important benthic and coastal ecosystem functions. By filter- Although bivalves can enhance water purification and water clarity,
ing phytoplankton and accumulating nitrogen and phosphorous, they they also absorb viruses, bacteria, toxic algae, and polluted organic
remove nutrients from the ambient environment when harvested. In particles from the ambient environment. Food safety risks are there-
addition, molluscan aquaculture can provide habitat structure, shore- fore high for molluscs cultivated in polluted environments. Moreo-
line stabilization, and local incomes for waterfront communities82,84,87,89. ver, the introduction of large densities of filter-feeding bivalves to
The role of bivalves as a carbon sink or source remains unclear, however, a habitat, whether in suspended or bottom culture, has the poten-
and research aimed at measuring carbon sequestration and system tial to impart negative changes in the water quality and benthic eco-
performance from these systems is ongoing84,90,91. systems (for example, depletion of phytoplankton and seston, and
The most widely recognized ecosystem service of molluscan aqua- localized increases in sedimentation rates through bio-deposition)
culture is the assimilation of excess nutrients from human activities, and can present serious disease risks96,97. Most negative impacts of
556 | Nature | Vol 591 | 25 March 2021bivalve production are site- and species-specific, and uncommon98. seaweeds (Saccharina japonica, also known as Laminaria japonica)
Negative environmental impacts may ensue if aquaculture systems and the expansion of agar-bearing seaweed aquaculture (Gracilaria)
are overstocked, inappropriately sited, or unsustainably managed, at scale. The industry remains fragmented outside Asia (mainly China
as indicated in certain cases in China99,100. Assessment of the influence and Indonesia), and competitive pricing constrains net revenues and
of bivalve farming on the surrounding environment can be a complex incentives for innovation108. Value in the seaweed industry could be
process. As in many aquaculture systems, however, the application of enhanced through the adoption of a ‘biorefinery’ approach to process-
carrying capacity models101–104 and routinely modified best manage- ing, in which the most valuable products from the algal biomass are
ment practices105 have continuously improved the sustainability of extracted sequentially, leaving the remaining material for commodity
molluscan culture. uses and minimizing waste, energy inputs and environmental harm123.
This approach has been successful in various segments of terrestrial
Algae agriculture. New global initiatives to promote seaweed production
Since 2000, there has been a growing appreciation for algae (dominated and use124 will need to tackle critical social, economic, and regulatory
by macroalgae or seaweed) for improved nutrition, industrial use, constraints, including unethical supply chain activities125, food safety
and ecosystem services, even in regions outside China, Japan, Korea, considerations, and limited consumer demand83,106,126.
and parts of South America, where seaweeds have been consumed as
food for centuries83,106,107. The global production of aquatic plants and
algae has tripled from 10 Mt of wet biomass in 2000 to more than 32 Mt Persistent challenges
in 2017, with aquaculture contributing more than 97% of the current Over the past 20 years, trends in the production and environmental
volume17,106. Of the 32 Mt of cultured algae—99% of which is produced in performance of aquaculture have been positive. Destructive habitat
Asia—between 31% and 38% is consumed directly as food (Extended Data conversion, particularly by shrimp farming in mangrove ecosystems
Table 4). The majority is used by the food industry sector as polysac- raised in the previous review1, has declined markedly since 2000127,128.
charide additives and functional food ingredients, and by the non-food Challenges to the industry persist, however, including the effects of
sector as hydrocolloid products in nutraceuticals, pharmaceuticals pathogens, parasites, and pests (PPP), pollution, harmful algal blooms,
and cosmetics, and to a lesser extent as fertilizers, feed ingredients, and climate change. The aquaculture industry has become increasingly
biofuels, bioplastics, and other industrial outputs106,108,109. vulnerable to these stressors given its rapid expansion, its reliance on
Research in recent decades has explored the potential for seaweeds the ambient environment, and the changing world in which all food
to substitute for terrestrial crop and animal production in protein, fat systems operate43,129.
(omega 3) and energy intake—alleviating pressure on freshwater and
land resources and biodiversity—but there is little evidence to date Pathogens, parasites and pests
that seaweeds can contribute substantially to human macronutrient Pathogens, parasites, and pests (PPP) are a chronic risk for the aqua-
intake110. Numerous studies have highlighted the micronutritional culture sector, and the intensification of production and increased
and sensory attributes of seaweeds for direct human consumption111 trade and supply chain integration since 2000 have amplified these
or as functional foods112, but benefits are difficult to quantify because risks130. Aquaculture species differ in their defences, and although inver-
of variation across species, seasons, and coastal environments, and a tebrates lack the adaptive immunity of finfish, their innate immune
lack of clear scientific evidence regarding nutritional bioavailability and system—which is certainly not simple or homogenous—is not fully
metabolic processes associated with algal consumption110. Research understood131–133. The gut is an important component of the immune
has examined the use of microalgal biomass in aquaculture feed as a system for finfish, which allows diet and alterations in the microbiome
cost-competitive replacement for fishmeal and the use of macroalgae to influence the susceptibility and potential resistance of finfish to dis-
in dairy and cattle feed to reduce methane emissions113, but these types ease, whereas the external microbial communities are vitally important
of feed have yet to develop commercially at scale. for the health status of invertebrates134. For most high-value and widely
Like molluscan aquaculture, seaweed culture is widely recognized for traded species, there have been substantial advances in PPP identifica-
its ecosystem service values beyond the provision of food and feed, yet tion, diagnosis, and treatment over the past 20 years, derived in part
producers have not been able to capture this value in financial returns114. from innovations in agriculture and human medicine131,132,134,135. Such
Bioremediation is the main ecological service reviewed in the literature. science-led disease management options remain largely unavailable for
Some seaweed systems receive additional fertilizers, for example, many low-value aquaculture species and low-income regions owing to
in low-nutrient coastal zones, although fertilization is regulated in a lack of product development and prohibitive costs. Global networks,
Japan and South Korea115. Ongoing research is also investigating the such as the World Organization for Animal Health, have emerged to
role of seaweed culture in mitigating ocean acidification, sequester- facilitate the transfer of scientific knowledge.
ing carbon, and enhancing biodiversity116–118. In China, studies suggest The aquaculture industry has responded to PPP pressures in recent
that large-scale seaweed aquaculture is effective in reducing nitrogen decades using a variety of approaches. Adoption of best management
levels, controlling phytoplankton blooms, and limiting the frequency practices (for example, for site and system selection, stocking densities,
of toxic algal blooms119,120. Considerable variability exists, however, in species rotations, broodstock, and feed quality, filtration, pond, and
the potential provision of seaweed ecosystem services across cultured cage cleanliness, parasite monitoring and removal, culling, zoning, and
systems, seasons, and scales. surveillance) has been the most important means of minimizing PPP
Seaweed aquaculture lags behind other food sectors in breeding, risks across all types of production systems25,134. Once a pathogen, para-
pathogen management, and optimization of production systems site, or pest is widely recognized in a given system, avoidance through
for nutrient, light and temperature conditions83. Bacterial and viral biosecurity is the primary management action available to most aqua-
outbreaks are especially high in intensively farmed seaweed systems, culture producers136. In some systems in which epizootics have caused
where disease management can account for up to 50% of farm-variable boom-and-bust cycles, resistant species have been introduced, pro-
costs106,121. New seaweed cultivars with higher yield potential, disease vided that viable markets exist137. For example, the aquaculture industry
resistance, nutritional qualities, and consumer attributes are needed in Thailand transitioned from black tiger shrimp to whiteleg shrimp,
to ensure production growth and increased value for the industry108,122. largely because of problems with infectious diseases, specifically white
Overall, progress in research and development for the seaweed spot disease and monodon slow growth syndrome138,139.
industry has not met expectations in recent decades108. A few major The use of therapeutants—chemical substances used to prevent and
exceptions include China’s success in cultivating alginate-bearing treat pathogens—including antimicrobials, has become a common
Nature | Vol 591 | 25 March 2021 | 557Review
practice in many aquaculture systems140. There are no comprehensive operations to close for 2 years because of food safety risks, generating
data on the nature and extent of therapeutic use in most aquaculture economic losses of around US$ 800 million98,159.
sectors, and both good and bad practices are found worldwide141–144. Climate-driven losses to aquaculture productivity and livelihoods
Although improper therapeutant use can pose risks to the health stem mainly from suboptimal growing temperatures, sea-level rise
of consumers, workers, cultured organisms, and surrounding eco- (saltwater intrusion), infrastructure damage, droughts and freshwater
systems (particularly in open production systems)96,142, the misuse of shortages, and rising feed costs associated with lower crop yields and
antimicrobials in aquaculture is especially problematic as it can lead forage fish landings156,160. Risks to aquaculture infrastructure often drive
to the emergence and transfer of antimicrobial-resistant genes and investments to more protected geographies and systems. In addition,
bacteria140. ocean acidification affects shellfish production, mainly at the larval life
As an alternative, large investments have been made in selective stage, and is managed through adjustments in pH within the hatchery161.
breeding for disease resistance in certain aquaculture species, but this The literature does not support generalizations of the damages of
avenue is costly and cannot easily be replicated across species145. Effec- ocean acidification to shellfish aquaculture given the species-specific
tive multivalent vaccines have also been introduced for some high-value responses documented, sparse data, uneven and questionable experi-
species such as salmon and trout146, and show promise for replication mentation, and the complexity of pathways through which species
in marine species aquaculture if efficient and cost-effective delivery are affected162. Climate change also amplifies the uncertainties sur-
systems (for example, oral or immersion) can be developed147. Vaccines rounding PPP and harmful algal blooms in aquaculture159,160,163 and
developed for farmed salmon have led to reductions in antibiotic use predictions remain uncertain98,164. In general, scientific studies on cli-
of up to 95% in Norway, the UK, Ireland and Canada, but antibiotic use mate–aquaculture interactions are based on laboratory-based toler-
remains high in Chile143. Advanced water management through recir- ance data and modelled, but not validated, for commercial aquaculture
culating aquaculture systems, as discussed in the following section, and thus remain speculative165–168. There are no comprehensive data
represents another important, but relatively costly, technology for on climate-driven production and economic losses in aquaculture at
controlling PPP148. In addition, supplementation of feed with nutraceu- regional or global scales, and outcomes are contingent on adaptation
ticals, plant extracts, prebiotics, and probiotics is used to boost fish responses129.
growth and immunity and serves as a promising alternative to antibiot-
ics—mainly in high-value production systems, but also increasingly in
lower-value freshwater systems in Southeast Asia142. Responding to the challenges
Even in sectors in which major investments and progress have been Increased attention has been directed to ecosystem-based manage-
made in the detection, avoidance, and treatment of PPP, new threats ment, system design, and new forms of private and public sector
frequently emerge. For example, the salmon aquaculture industry governance to manage biological and climate risks, and encourage
has successfully controlled some diseases, such as infectious pancre- sustainable aquaculture production86,169,170. Integrated multi-trophic
atic necrosis virus and infectious salmon anaemia, but other diseases aquaculture has shown high bioremediation capacity in China120,171,
and parasites (for example, salmon rickettsial syndrome and sea lice) but has demonstrated limited commercial success globally despite
remain costly for many producers and damaging to wild salmon as considerable research interest172,173. Recirculating aquaculture systems
treatment options are either unavailable or the target organism has and offshore aquaculture have promising growth potential.
become resistant to treatment131,143,149,150. Similarly, despite the shift
from black tiger shrimp to whiteleg shrimp, emerging diseases such as Recirculating aquaculture systems
white spot disease, acute hepatopancreatic necrosis disease, shrimp Recirculating aquaculture systems are designed to control all environ-
hemocyte iridescent virus, and the microsporidian parasite (Enterocy- mental facets of production by continually filtering, treating, and reus-
tozoon hepatopenaei) have resulted in substantial production losses ing water, and thereby increasing operational efficiency and reducing
and sustained economic costs to the shrimp industry136,151–153. risks from PPP and climate change. Recirculating aquaculture systems
As aquaculture production expands into new geographies, PPP out- have lower direct land and water requirements than conventional aqua-
breaks and the risks to human health from therapeutic management culture and enable higher stocking densities174 but are constrained
approaches will probably increase, particularly in low-income regions. by large energy requirements, high production costs, waste disposal
Studies also project increased risks of aquaculture disease incidence challenges, and risk of catastrophic disease failures78,175,176.
and antimicrobial resistance associated with disease management Recirculating aquaculture system technologies are typically used
owing to global warming154,155,160. The quantification of trends in PPP is, when advantages in fish performance outweigh the increased costs—
however, complicated by variation between national and international for example, for broodstock and vulnerable early life stages175,177 and
disease monitoring and treatment regulations and by a lack data for recently for full-life cycle production of salmon. Applications of
most aquaculture species and production regions157. In the absence of recirculating aquaculture systems within raceways and channelled
reliable data, the incidence and management of PPP throughout the pond systems for shrimp aquaculture are also cost-effective in many
global aquaculture industry is and will remain highly unpredictable. farming areas given high disease and water-quality risks148. Grow-out
operations using recirculating aquaculture system technology are
Harmful algal blooms and climate change progressively focused on species with high market value, established
Harmful algal blooms are increasing globally with respect to frequency, production protocols, and production models that are large enough
magnitude, duration, geographical ranges, and species composition, to realize the efficiency benefits of scale177,178. The competitiveness of
and are driven largely by anthropogenic processes98. They occur in recirculating aquaculture systems for full grow-out relative to other
aquaculture areas worldwide, and their influences on production production systems remains uncertain, however, and there have been
vary widely depending on species-specific effects98,158. Intensive and several failures in North America and Europe and few large-scale, com-
poorly managed finfish and crustacean systems can contribute to the mercial successes over multiple years179.
emergence of harmful algal blooms, and shellfish, sea urchins, and sea
cucumbers are common vectors for toxic microalgae98. Toxic blooms Offshore aquaculture
represent a large economic cost to parts of the industry for which moni- Offshore aquaculture in deep and open ocean waters is designed to
toring and management are ineffective. Large blooms of Pseudochat- produce large volumes of fish while minimizing land and freshwater
tonella and Karenia in southern Chile in 2016 caused salmon mortalities constraints and coastal environmental impacts, such as nutrient pollu-
of 40,000 tonnes and required several salmon, mussel, and abalone tion and sea lice infestations78,180. Prudent siting is required, however,
558 | Nature | Vol 591 | 25 March 2021to avoid conflicts with other marine uses and to ensure the effective which integrate private assessment tools into spatial management
dilution of wastes, particularly for large-scale systems181. Norway units that are managed in collaboration with buyers and states198.
and China lead in offshore fish aquaculture with the introduction of These ‘beyond farm’ forms of management aim to foster greater
massive submersible cages182–184. Given large capital costs and high inclusion of large and small-holder producers in a given jurisdiction
risk-to-return ratios, offshore aquaculture in other countries has been to minimize PPP, climate, and other ecological risks169. They are also
confined mainly to small-scale pilot operations cultivating high-valued, increasingly aimed at avoiding spatial conflicts, promoting the trade
carnivorous species. Offshore environments present a range of opera- in bio-derivatives, and creating new ecosystem and climate services
tional challenges (for example, water depth, strong currents and waves, markets199–202. They may also enable greater transparency and trust of
and storms), which have induced several new design approaches180. aquaculture products exported from developing countries and create
Government regulations have constrained commercial development inclusive improvement pathways for the 90% of aquaculture output
of offshore aquaculture, particularly in the USA and European Union, that is not directed towards export markets.
because of public controversy regarding its interactions with the marine
environment, potential ecological damage, and competing uses of
ocean and natural resources185,186. Outlook
Over the past 20 years the aquaculture sector has evolved from having
Governance a relatively minor role to playing a mainstream part in the global food
Aspirations to improve the environmental and social performance of system. The aquaculture literature reflects the increased attention to
aquaculture practices and technologies have led to the emergence of food system outcomes, with consumers, value chains, and sustainability
new combinations of public and private regulation, codes and stand- criteria progressively shaping the direction of the industry. Contin-
ards187; however, the application of these governance instruments has ued growth in the sector has important implications for achieving the
struggled to match the expanded geographies, volumes, and diversity United Nations Sustainable Development Goals.
of aquaculture systems188. The uneven implementation of government Three key patterns emerge in this Review. First, freshwater fish have
regulation has led to regional disparities in production, growth and a central role in the global production, contributing more than any
system design. Governments have facilitated aquaculture expansion other aquaculture sub-sector to the total (live and edible) volume, rural
in many Asian countries, Norway, and Chile, whereas in other regions— livelihoods, and food security during the past two decades. Because
including the European Union and USA—governments have constrained most farmed freshwater fish do not enter the global market, however,
growth15. In very few countries, such as Norway, has strict environmen- there is currently little impetus for producers to engage in sustainable
tal regulation allowed the sector to expand by coordinating governing practices with recognized ratings or certification. Second, marked
institutions to support planned aquaculture growth15. Uneven regula- improvements have been made in the efficiency of marine resource use
tion has led to disparities in investment and trade, with only a few export across all fed species and in the field of fish nutrition. Further gains in
nations selling into major net seafood importing markets such as the these areas may be more difficult and costly to achieve for carnivorous
USA and European Union. species, but the increasing costs of fishmeal and fish oil that are associ-
In response to public over- and under-regulation, several types of ated with marine resource limitation will provide continued incentives
private governance arrangements have emerged with the intention of for innovation. Third, careful siting of aquaculture systems underpins
shaping demand for sustainable, ‘fair’, and organic aquaculture produc- the commercial and environmental success of the industry. Almost all
tion. For example, 30–50 voluntary labelling, certification and rating freshwater and marine aquaculture systems interact with the ambient
schemes have been introduced by non-government organizations and aquatic environment and both benefit from and provide environmental
private companies189,190. services to the ambient environment as a result. Prudent siting and
Farm-level certification is setting new norms for sustainable aquacul- scaling are essential for maximizing the ecosystem services provided
ture globally191, yet the role of certification remains limited by low (yet by farmed extractive species and for mitigating critical challenges to
growing) levels of producer compliance. The two largest certification the industry associated with PPP, coastal pollution, and climate change.
groups—the Aquaculture Stewardship Council (ASC) and the Global The wide diversity of aquaculture systems across species, geogra-
Aquaculture Alliance Best Aquaculture Practice (GAA-BAP) stand- phies, producers, and consumers prevents the development of a single
ards—account for 3% of global aquaculture production (Extended Data strategy to achieve sustainable and healthy products. Governance
Fig. 5). Low levels of compliance have been attributed to insufficient systems need to be designed with clearly articulated, science-informed
finances, low demand for certified products, poor literacy levels, and goals, but without overly proscriptive standards and regulations for
inadequate administrative skills required for monitoring and report- realizing those goals. Such flexibility is needed to support the abilities
ing192,193, and environmental production risks beyond the control of of industries, governments, and non-government organizations to
the producer194. Consumer guides such as the US Seafood Watch have innovate while still providing clear end points and requirements for
rated a further 53% of global production (Extended Data Fig. 5). These monitoring, reporting, transparency, and accountability. The aqua-
ratings are involuntary and based on broad-scale assessments at the culture sector will continue to face large uncertainties in the future,
sector or regional level. including climate change, evolving PPP pressures, pandemics, and
Certified and rated production is skewed to major export species. market disruptions and changes in food systems more broadly.
Overall, 57% of salmon and trout, 17% of shrimp and prawns, 17% of Looking ahead, the effective spatial planning and regulation of
pangasius and 11% of tilapia are certified (Extended Data Fig. 6), with aquaculture sites will be paramount for achieving positive environ-
higher levels of compliance observed in countries with a greater propor- mental outcomes, especially as aquaculture systems increase in scale
tion of vertically integrated supply chains38,195,196. Domestic demand for and production intensifies. The industry is investigating recirculating
sustainable products in Asian seafood markets appears to be increasing, and offshore technologies to reduce its exposure to and impact on
driven by food safety concerns197, but considerable growth in domestic aquatic environments; however, these systems will require innova-
demand for sustainable seafood is needed to make aquaculture certi- tive financial and environmental management to have any chance of
fication and rating systems effective globally187. widespread success. In addition, investments are needed in an array
States can enhance the success of private governance arrangements of PPP prevention strategies across different aquaculture sub-sectors,
by providing capabilities, resources, and minimum regulation to sup- recognizing that treatments after PPP problems emerge are largely
port improvements in farm practices. Both certification and consumer futile. Finally, future policies and programmes to promote aquaculture
guides have now started shifting to ‘hybrid’ forms of governance190, will require a food systems approach that examines nutrition, equity,
Nature | Vol 591 | 25 March 2021 | 559You can also read